Jordan Sodium Percarbonate Market (2026-2032) Outlook | Size, Analysis, Growth, Trends, Companies, Revenue, Share, Forecast, Industry & Value
Market Forecast By Type (Coated, Uncoated, Tablet), By Application (Detergent Agent, Cleaning Agent, Bleaching Agent, Water Treatment, Others), By End-users (Household Cleaning, Laundry, Industrial Cleaning, Textile Industry, Chemical Industry, Papermaking Industry, Food Industry, Others) And Competitive Landscape
| Product Code: ETC091265 | Publication Date: Jun 2021 | Updated Date: Jun 2026 | Product Type: Report | |
| Publisher: 6Wresearch | Author: Shubham Padhi | No. of Pages: 70 | No. of Figures: 35 | No. of Tables: 5 |
Jordan Sodium Percarbonate Market Size, Share & Growth Rate
The Jordan Sodium Percarbonate Market was estimated at USD 379 Million in 2025 and is projected to reach USD 530 Million by 2032, growing at a CAGR of 4.9% from 2026 to 2032. This growth trajectory is primarily driven by a significant shift toward environmentally-friendly cleaning agents, as consumers become increasingly aware of the adverse effects of conventional chemical cleaners. Additionally, the rising adoption of sodium percarbonate in diverse applications, including laundry detergents and industrial cleaning solutions, contributes to this expanding market.
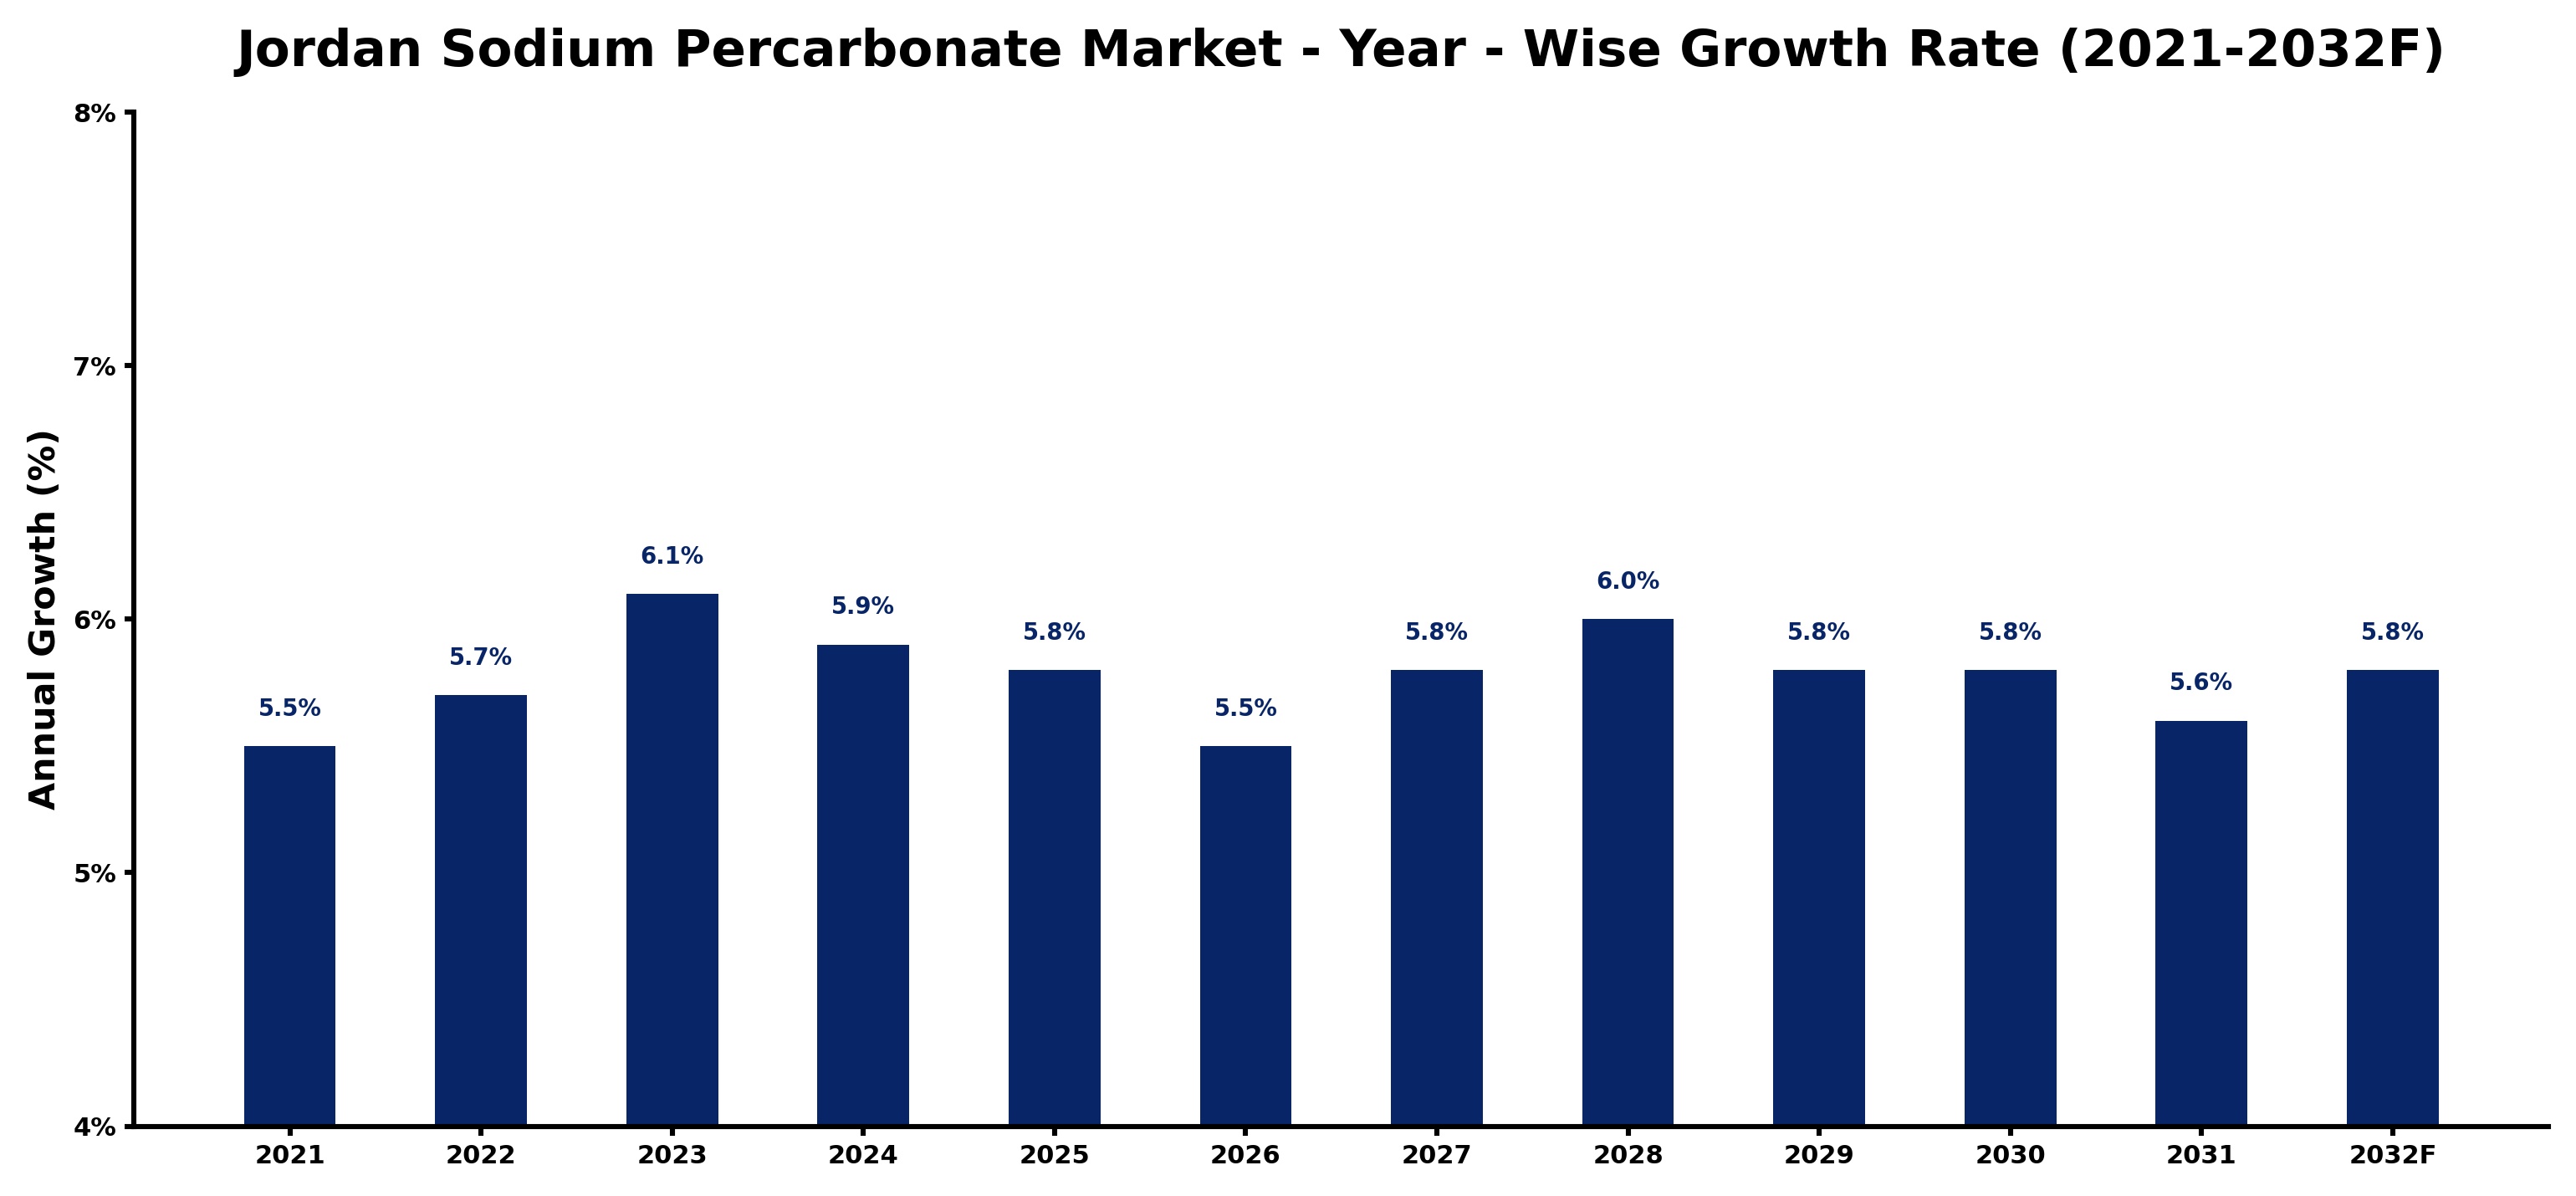
Jordan Sodium Percarbonate Market Growth Rate Analysis (2021-2032)
The Jordan Sodium Percarbonate market has exhibited stable growth over the past few years, beginning with a 5.5% increase in 2021, followed by 5.7% in 2022 and a notable uptick to 6.1% in 2023. This upward trend can be largely attributed to growing consumer demand for eco-friendly cleaning products and innovations in industrial applications, particularly in textiles and agriculture. While projected growth remains robust, slight fluctuations—such as the 5.9% forecast for 2024 and 5.5% for 2026—reflect sequential adjustments influenced by shifts in energy policy and supply chain dynamics. By 2028, growth is expected to stabilize around 6.0%, making the market well-positioned for sustained investment and development through 2032, despite minor variances.
Jordan Sodium Percarbonate Market Year-wise Growth Rate and Key Drivers
This graph highlights how the Jordan Sodium Percarbonate Market has steadily grown over the past five years, supported by major growth factors.
The table below presents the year‑wise growth rates along with the key drivers influencing the market
| Year | Growth Rate | Major Drivers |
| 2021 | 5.5% | Advanced mixing technology boosts sodium percarbonate production efficiency |
| 2022 | 5.7% | Higher capacity utilization drives sodium percarbonate production efficiency improvements |
| 2023 | 6.1% | Manufacturing upgrades boosted local demand for sodium percarbonate applications |
| 2024 | 5.9% | Increased local demand spurred sodium percarbonate production capacity investments |
| 2025 | 5.8% | Manufacturing investments boost local production of sodium percarbonate products |
| 2026 | 5.5% | Surge in detergent production drives sodium percarbonate demand growth |
| 2027 | 5.8% | Advanced washing technology boosts sodium percarbonate manufacturing efficiency |
| 2028 | 6.0% | New production facilities boost sodium percarbonate manufacturing capacity |
| 2029 | 5.8% | Technological upgrades in packaging enhanced sodium percarbonate export efficiency |
| 2030 | 5.8% | Improved facility efficiencies boosted sodium percarbonate production capacity |
| 2031 | 5.6% | Demand for sodium percarbonate in detergent formulations drives production expansion |
| 2032 | 5.8% | Local manufacturing investments boost sodium percarbonate production capabilities |
Note - Market size estimations and growth projections presented in this report are based on 6Wresearch’s advanced forecasting approach, validated with industry datasets as of June 2026.
Jordan Sodium Percarbonate Market Synopsis
In Jordan, the demand for sodium percarbonate is notably influenced by the local consumer shift toward sustainable living. As awareness about the ecological impact of traditional bleach agents grows, households and businesses are favoring sodium percarbonate for its biodegradable properties. Moreover, the increasing integration of this compound into various sectors, including textile and water treatment industries, further underpins its market demand.
Notably, the surge in eco-conscious product formulations presents an opportunity for manufacturers to innovate. In response to consumer preferences, companies are developing new product lines featuring sodium percarbonate, aiming to meet the rising expectations for safety and environmental responsibility in cleaning products.
Jordan Sodium Percarbonate Market Key Takeaways
- The market is positioned for steady growth driven by increasing consumer demand for eco-friendly cleaning solutions.
- Sodium percarbonate is favored for its non-toxic and biodegradable qualities, appealing to environmentally conscious consumers.
- Investment in research and development is crucial for manufacturers to explore new applications and product innovations.
- Regulatory support from the Jordanian government is shaping a favorable environment for sustainable product offerings.
- Challenges such as price competition and logistics require strategic positioning by stakeholders in the market.
Evaluation of Restraints in Jordan Sodium Percarbonate Market
Despite its positive trajectory, the Jordan Sodium Percarbonate market faces several challenges that could impede growth. Limited consumer awareness about the benefits of sodium percarbonate compared to traditional cleaning agents can hinder adoption. Additionally, there are inconsistencies in the availability of high-quality sodium percarbonate products in the market, which poses a risk to consumer trust. Pricing pressures from cheaper alternatives complicate the competitive landscape, forcing manufacturers to adopt innovative pricing strategies while ensuring compliance with stringent safety and environmental regulations.
Jordan Sodium Percarbonate Market Trends
The Jordan Sodium Percarbonate market is undergoing dynamic shifts as eco-consciousness permeates consumer preferences. This trend is echoed in the rising demand for eco-friendly cleaning products across households and industries alike. Notably, innovations in product formulations are on the rise, as manufacturers explore combinations with other green ingredients to enhance cleaning efficacy while ensuring safety. Moreover, the increasing popularity of bulk purchasing among consumers presents additional avenues for growth.
Jordan Sodium Percarbonate Market Opportunities
Investment opportunities in the Jordan Sodium Percarbonate market are robust, particularly in manufacturing and distribution channels. Companies willing to innovate can capture market share through the development of specialized sodium percarbonate products tailored for niche applications, such as specialized cleaning agents for the industrial sector. Moreover, establishing reliable supply chains will ensure consistent product availability, further solidifying market positions amidst growing demand.
Government Initiatives in the Jordan Sodium Percarbonate Market
The Jordanian government plays a pivotal role in shaping the sodium percarbonate market through regulations aimed at ensuring environmental sustainability and safety. Policies enforced by the Ministry of Environment regulate the production, importation, and use of sodium percarbonate to mitigate potential health risks and promote eco-friendly practices. By encouraging the use of sustainable products, the government fosters a conducive environment for market growth while ensuring compliance with international safety standards.
Future Insights of the Jordan Sodium Percarbonate Market
Looking ahead to 2026-2032, the Jordan Sodium Percarbonate market is poised for continued growth as consumer preference for sustainable products intensifies. The increasing integration of sodium percarbonate in various cleaning applications will propel its market share. Despite potential challenges posed by fluctuating raw material costs and regulatory pressures, the overall trajectory remains positive, fueled by an unwavering commitment to environmental responsibility and innovation.
Jordan Sodium Percarbonate Market Latest Developments (May 2025 - June 2026)
Recent developments in the Jordan Sodium Percarbonate market indicate a strong focus on innovation and sustainability. Companies are launching new product lines that incorporate sodium percarbonate, emphasizing its eco-friendly attributes. Additionally, collaborative efforts between manufacturers and suppliers aim to streamline logistics, ensuring that high-quality sodium percarbonate remains accessible to meet rising demand.
Jordan Sodium Percarbonate Market - Key Attractiveness of the Report
- 10 Years of Market Numbers
- Historical Data Starting from 2022 to 2025
- Base Year: 2025
- Forecast Data until 2032
- Key Performance Indicators Impacting the Market
- Major Upcoming Developments and Projects
Key Highlights of the Report:
- Jordan Sodium Percarbonate Market Outlook
- Market Size of Jordan Sodium Percarbonate Market, 2025
- Forecast of Jordan Sodium Percarbonate Market, 2032
- Historical Data and Forecast of Jordan Sodium Percarbonate Revenues & Volume for the Period 2022-2032F
- Jordan Sodium Percarbonate Market Trend Evolution
- Jordan Sodium Percarbonate Market Drivers and Challenges
- Jordan Sodium Percarbonate Price Trends
- Jordan Sodium Percarbonate Porter's Five Forces
- Jordan Sodium Percarbonate Industry Life Cycle
- Historical Data and Forecast of Jordan Sodium Percarbonate Market Revenues & Volume By Type for the Period 2022-2032F
- Historical Data and Forecast of Jordan Sodium Percarbonate Market Revenues & Volume By Coated for the Period 2022-2032F
- Historical Data and Forecast of Jordan Sodium Percarbonate Market Revenues & Volume By Uncoated for the Period 2022-2032F
- Historical Data and Forecast of Jordan Sodium Percarbonate Market Revenues & Volume By Tablet for the Period 2022-2032F
- Historical Data and Forecast of Jordan Sodium Percarbonate Market Revenues & Volume By Application for the Period 2022-2032F
- Historical Data and Forecast of Jordan Sodium Percarbonate Market Revenues & Volume By Detergent Agent for the Period 2022-2032F
- Historical Data and Forecast of Jordan Sodium Percarbonate Market Revenues & Volume By Cleaning Agent for the Period 2022-2032F
- Historical Data and Forecast of Jordan Sodium Percarbonate Market Revenues & Volume By Bleaching Agent for the Period 2022-2032F
- Historical Data and Forecast of Jordan Sodium Percarbonate Market Revenues & Volume By Water Treatment for the Period 2022-2032F
- Historical Data and Forecast of Jordan Sodium Percarbonate Market Revenues & Volume By Others for the Period 2022-2032F
- Historical Data and Forecast of Jordan Sodium Percarbonate Market Revenues & Volume By End-users for the Period 2022-2032F
- Historical Data and Forecast of Jordan Sodium Percarbonate Market Revenues & Volume By Household Cleaning for the Period 2022-2032F
- Historical Data and Forecast of Jordan Sodium Percarbonate Market Revenues & Volume By Laundry for the Period 2022-2032F
- Historical Data and Forecast of Jordan Sodium Percarbonate Market Revenues & Volume By Industrial Cleaning for the Period 2022-2032F
- Historical Data and Forecast of Jordan Sodium Percarbonate Market Revenues & Volume By Textile Industry for the Period 2022-2032F
- Historical Data and Forecast of Jordan Sodium Percarbonate Market Revenues & Volume By Chemical Industry for the Period 2022-2032F
- Historical Data and Forecast of Jordan Sodium Percarbonate Market Revenues & Volume By Papermaking Industry for the Period 2022-2032F
- Historical Data and Forecast of Jordan Sodium Percarbonate Market Revenues & Volume By Food Industry for the Period 2022-2032F
- Historical Data and Forecast of Jordan Sodium Percarbonate Market Revenues & Volume By Others for the Period 2022-2032F
- Jordan Sodium Percarbonate Import Export Trade Statistics
- Market Opportunity Assessment By Type
- Market Opportunity Assessment By Application
- Market Opportunity Assessment By End-users
- Jordan Sodium Percarbonate Top Companies Market Share
- Jordan Sodium Percarbonate Competitive Benchmarking By Technical and Operational Parameters
- Jordan Sodium Percarbonate Company Profiles
- Jordan Sodium Percarbonate Key Strategic Recommendations
Jordan Sodium Percarbonate Market - Frequently Asked Questions
The growth is primarily driven by an increasing demand for eco-friendly cleaning products, as consumers become more aware of the harmful effects of traditional chemicals. Sodium percarbonate's biodegradable and non-toxic properties position it favorably in this evolving market.
The Jordan Sodium Percarbonate Market was estimated at USD 379 Million in 2025 and is projected to reach USD 530 Million by 2032, growing at a CAGR of 4.9% from 2026 to 2032. This substantial growth is indicative of rising consumer preference for sustainable cleaning solutions.
Manufacturers may confront challenges such as limited consumer awareness, inconsistent product quality, and competitive pricing pressures from alternative cleaning agents, which can hinder market penetration and profitability.
The industry is witnessing a surge in product innovation, with manufacturers developing formulations that combine sodium percarbonate with other eco-friendly ingredients, enhancing its effectiveness while appealing to a broader audience.
The Jordanian government has enacted regulations to ensure safety and environmental protection concerning sodium percarbonate production and usage. This regulatory framework is crucial in fostering a sustainable market ecosystem.
6Wresearch actively monitors the Jordan Sodium Percarbonate Market and publishes its comprehensive annual report, highlighting emerging trends, growth drivers, revenue analysis, and forecast outlook. Our insights help businesses to make data-backed strategic decisions with ongoing market dynamics. Our analysts track relevent industries related to the Jordan Sodium Percarbonate Market, allowing our clients with actionable intelligence and reliable forecasts tailored to emerging regional needs.
Yes, we provide customisation as per your requirements. To learn more, feel free to contact us on sales@6wresearch.com
1 Executive Summary |
2 Introduction |
2.1 Key Highlights of the Report |
2.2 Report Description |
2.3 Market Scope & Segmentation |
2.4 Research Methodology |
2.5 Assumptions |
3 Jordan Sodium Percarbonate Market Overview |
3.1 Jordan Country Macro Economic Indicators |
3.2 Jordan Sodium Percarbonate Market Revenues & Volume, 2022 & 2032F |
3.3 Jordan Sodium Percarbonate Market - Industry Life Cycle |
3.4 Jordan Sodium Percarbonate Market - Porter's Five Forces |
3.5 Jordan Sodium Percarbonate Market Revenues & Volume Share, By Type, 2022 & 2032F |
3.6 Jordan Sodium Percarbonate Market Revenues & Volume Share, By Form, 2022 & 2032F |
3.7 Jordan Sodium Percarbonate Market Revenues & Volume Share, By End-users, 2022 & 2032F |
4 Jordan Sodium Percarbonate Market Dynamics |
4.1 Impact Analysis |
4.2 Market Drivers |
4.3 Market Restraints |
5 Jordan Sodium Percarbonate Market Trends |
6 Jordan Sodium Percarbonate Market, By Types |
6.1 Jordan Sodium Percarbonate Market, By Type |
6.1.1 Overview and Analysis |
6.1.2 Jordan Sodium Percarbonate Market Revenues & Volume, By Type, 2022-2032F |
6.1.3 Jordan Sodium Percarbonate Market Revenues & Volume, By Coated, 2022-2032F |
6.1.4 Jordan Sodium Percarbonate Market Revenues & Volume, By Uncoated, 2022-2032F |
6.1.5 Jordan Sodium Percarbonate Market Revenues & Volume, By Tablet, 2022-2032F |
6.2 Jordan Sodium Percarbonate Market, By Application |
6.2.1 Overview and Analysis |
6.2.2 Jordan Sodium Percarbonate Market Revenues & Volume, By Detergent Agent, 2022-2032F |
6.2.3 Jordan Sodium Percarbonate Market Revenues & Volume, By Cleaning Agent, 2022-2032F |
6.2.4 Jordan Sodium Percarbonate Market Revenues & Volume, By Bleaching Agent, 2022-2032F |
6.2.5 Jordan Sodium Percarbonate Market Revenues & Volume, By Water Treatment, 2022-2032F |
6.2.6 Jordan Sodium Percarbonate Market Revenues & Volume, By Others, 2022-2032F |
6.3 Jordan Sodium Percarbonate Market, By End-users |
6.3.1 Overview and Analysis |
6.3.2 Jordan Sodium Percarbonate Market Revenues & Volume, By Household Cleaning, 2022-2032F |
6.3.3 Jordan Sodium Percarbonate Market Revenues & Volume, By Laundry, 2022-2032F |
6.3.4 Jordan Sodium Percarbonate Market Revenues & Volume, By Industrial Cleaning, 2022-2032F |
6.3.5 Jordan Sodium Percarbonate Market Revenues & Volume, By Textile Industry, 2022-2032F |
6.3.6 Jordan Sodium Percarbonate Market Revenues & Volume, By Chemical Industry, 2022-2032F |
6.3.7 Jordan Sodium Percarbonate Market Revenues & Volume, By Papermaking Industry, 2022-2032F |
6.3.8 Jordan Sodium Percarbonate Market Revenues & Volume, By Others, 2022-2032F |
6.3.9 Jordan Sodium Percarbonate Market Revenues & Volume, By Others, 2022-2032F |
7 Jordan Sodium Percarbonate Market Import-Export Trade Statistics |
7.1 Jordan Sodium Percarbonate Market Export to Major Countries |
7.2 Jordan Sodium Percarbonate Market Imports from Major Countries |
8 Jordan Sodium Percarbonate Market Key Performance Indicators |
9 Jordan Sodium Percarbonate Market - Opportunity Assessment |
9.1 Jordan Sodium Percarbonate Market Opportunity Assessment, By Type, 2022 & 2032F |
9.2 Jordan Sodium Percarbonate Market Opportunity Assessment, By Application, 2022 & 2032F |
9.3 Jordan Sodium Percarbonate Market Opportunity Assessment, By End-users, 2022 & 2032F |
10 Jordan Sodium Percarbonate Market - Competitive Landscape |
10.1 Jordan Sodium Percarbonate Market Revenue Share, By Companies, 2025 |
10.2 Jordan Sodium Percarbonate Market Competitive Benchmarking, By Operating and Technical Parameters |
11 Company Profiles |
12 Recommendations |
13 Disclaimer |
Global Go To Market Strategy - 2030
Export potential enables firms to identify high-growth global markets with greater confidence by combining advanced trade intelligence with a structured quantitative methodology. The framework analyzes emerging demand trends and country-level import patterns while integrating macroeconomic and trade datasets such as GDP and population forecasts, bilateral import–export flows, tariff structures, elasticity differentials between developed and developing economies, geographic distance, and import demand projections. Using weighted trade values from 2020–2024 as the base period to project country-to-country export potential for 2030, these inputs are operationalized through calculated drivers such as gravity model parameters, tariff impact factors, and projected GDP per-capita growth. Through an analysis of hidden potentials, demand hotspots, and market conditions that are most favorable to success, this method enables firms to focus on target countries, maximize returns, and global expansion with data, backed by accuracy.
By factoring in the projected importer demand gap that is currently unmet and could be potential opportunity, it identifies the potential for the Exporter (Country) among 190 countries, against the general trade analysis, which identifies the biggest importer or exporter.
To discover high-growth global markets and optimize your business strategy:
Click Here
Pricing
- Single User License$ 1,995
- Department License$ 2,400
- Site License$ 3,120
- Global License$ 3,795

Leadership Perspectives from Industry Events
Search
Thought Leadership and Analyst Meet


Our Clients
6WResearch In News
- India Air Conditioner Market Set for Strong Rebound in 2026 After Weather-Led Correction and GST-Driven Recovery: 6Wresearch
- ADAS in India: How Automatic Emergency Braking, Blind Spot Detection & Driver Monitoring are Transforming Road Safety
- Doha a strategic location for EV manufacturing hub: IPA Qatar
- Demand for luxury TVs surging in the GCC, says Samsung
- Empowering Growth: The Thriving Journey of Bangladesh’s Cable Industry
- Demand for luxury TVs surging in the GCC, says Samsung
Latest Reports
- Poland Fire Protection Systems Market (2026-2032)
- Cape Verde Portable Hand-Thrown Extinguisher Market (2026-2032)
- Canada Portable Hand-Thrown Extinguisher Market (2026-2032)
- Cameroon Portable Hand-Thrown Extinguisher Market (2026-2032)
- Burundi Portable Hand-Thrown Extinguisher Market (2026-2032)
- Burkina Faso Portable Hand-Thrown Extinguisher Market (2026-2032)
- Bulgaria Portable Hand-Thrown Extinguisher Market (2026-2032)
- Brunei Portable Hand-Thrown Extinguisher Market (2026-2032)
- Botswana Portable Hand-Thrown Extinguisher Market (2026-2032)
- Bosnia and Herzegovina Portable Hand-Thrown Extinguisher Market (2026-2032)
Industry Events and Analyst Meet

HIMTEX 2026

India Refining Summit 2026

India EV Show 2026

EV tech India Expo 2026

Auto Tech Asia 2026
Whitepaper
- Middle East & Africa Commercial Security Market Click here to view more.
- Middle East & Africa Fire Safety Systems & Equipment Market Click here to view more.
- GCC Drone Market Click here to view more.
- Middle East Lighting Fixture Market Click here to view more.
- GCC Physical & Perimeter Security Market Click here to view more.