Kazakhstan Balance Shaft Market (2025-2031) Outlook | Size, Revenue, Trends, Analysis, Forecast, Companies, Growth, Value, Industry & Share
Market Forecast By Engine Type (Inline-3 Cylinder, Inline-4 Cylinder, Inline-5 Cylinder, V-6 Cylinder), By Manufacturing Process (Forged , Cast Balance Shaft) And Competitive Landscape
| Product Code: ETC4576199 | Publication Date: Jul 2023 | Updated Date: Mar 2026 | Product Type: Report | |
| Publisher: 6Wresearch | Author: Ravi Bhandari | No. of Pages: 85 | No. of Figures: 45 | No. of Tables: 25 |
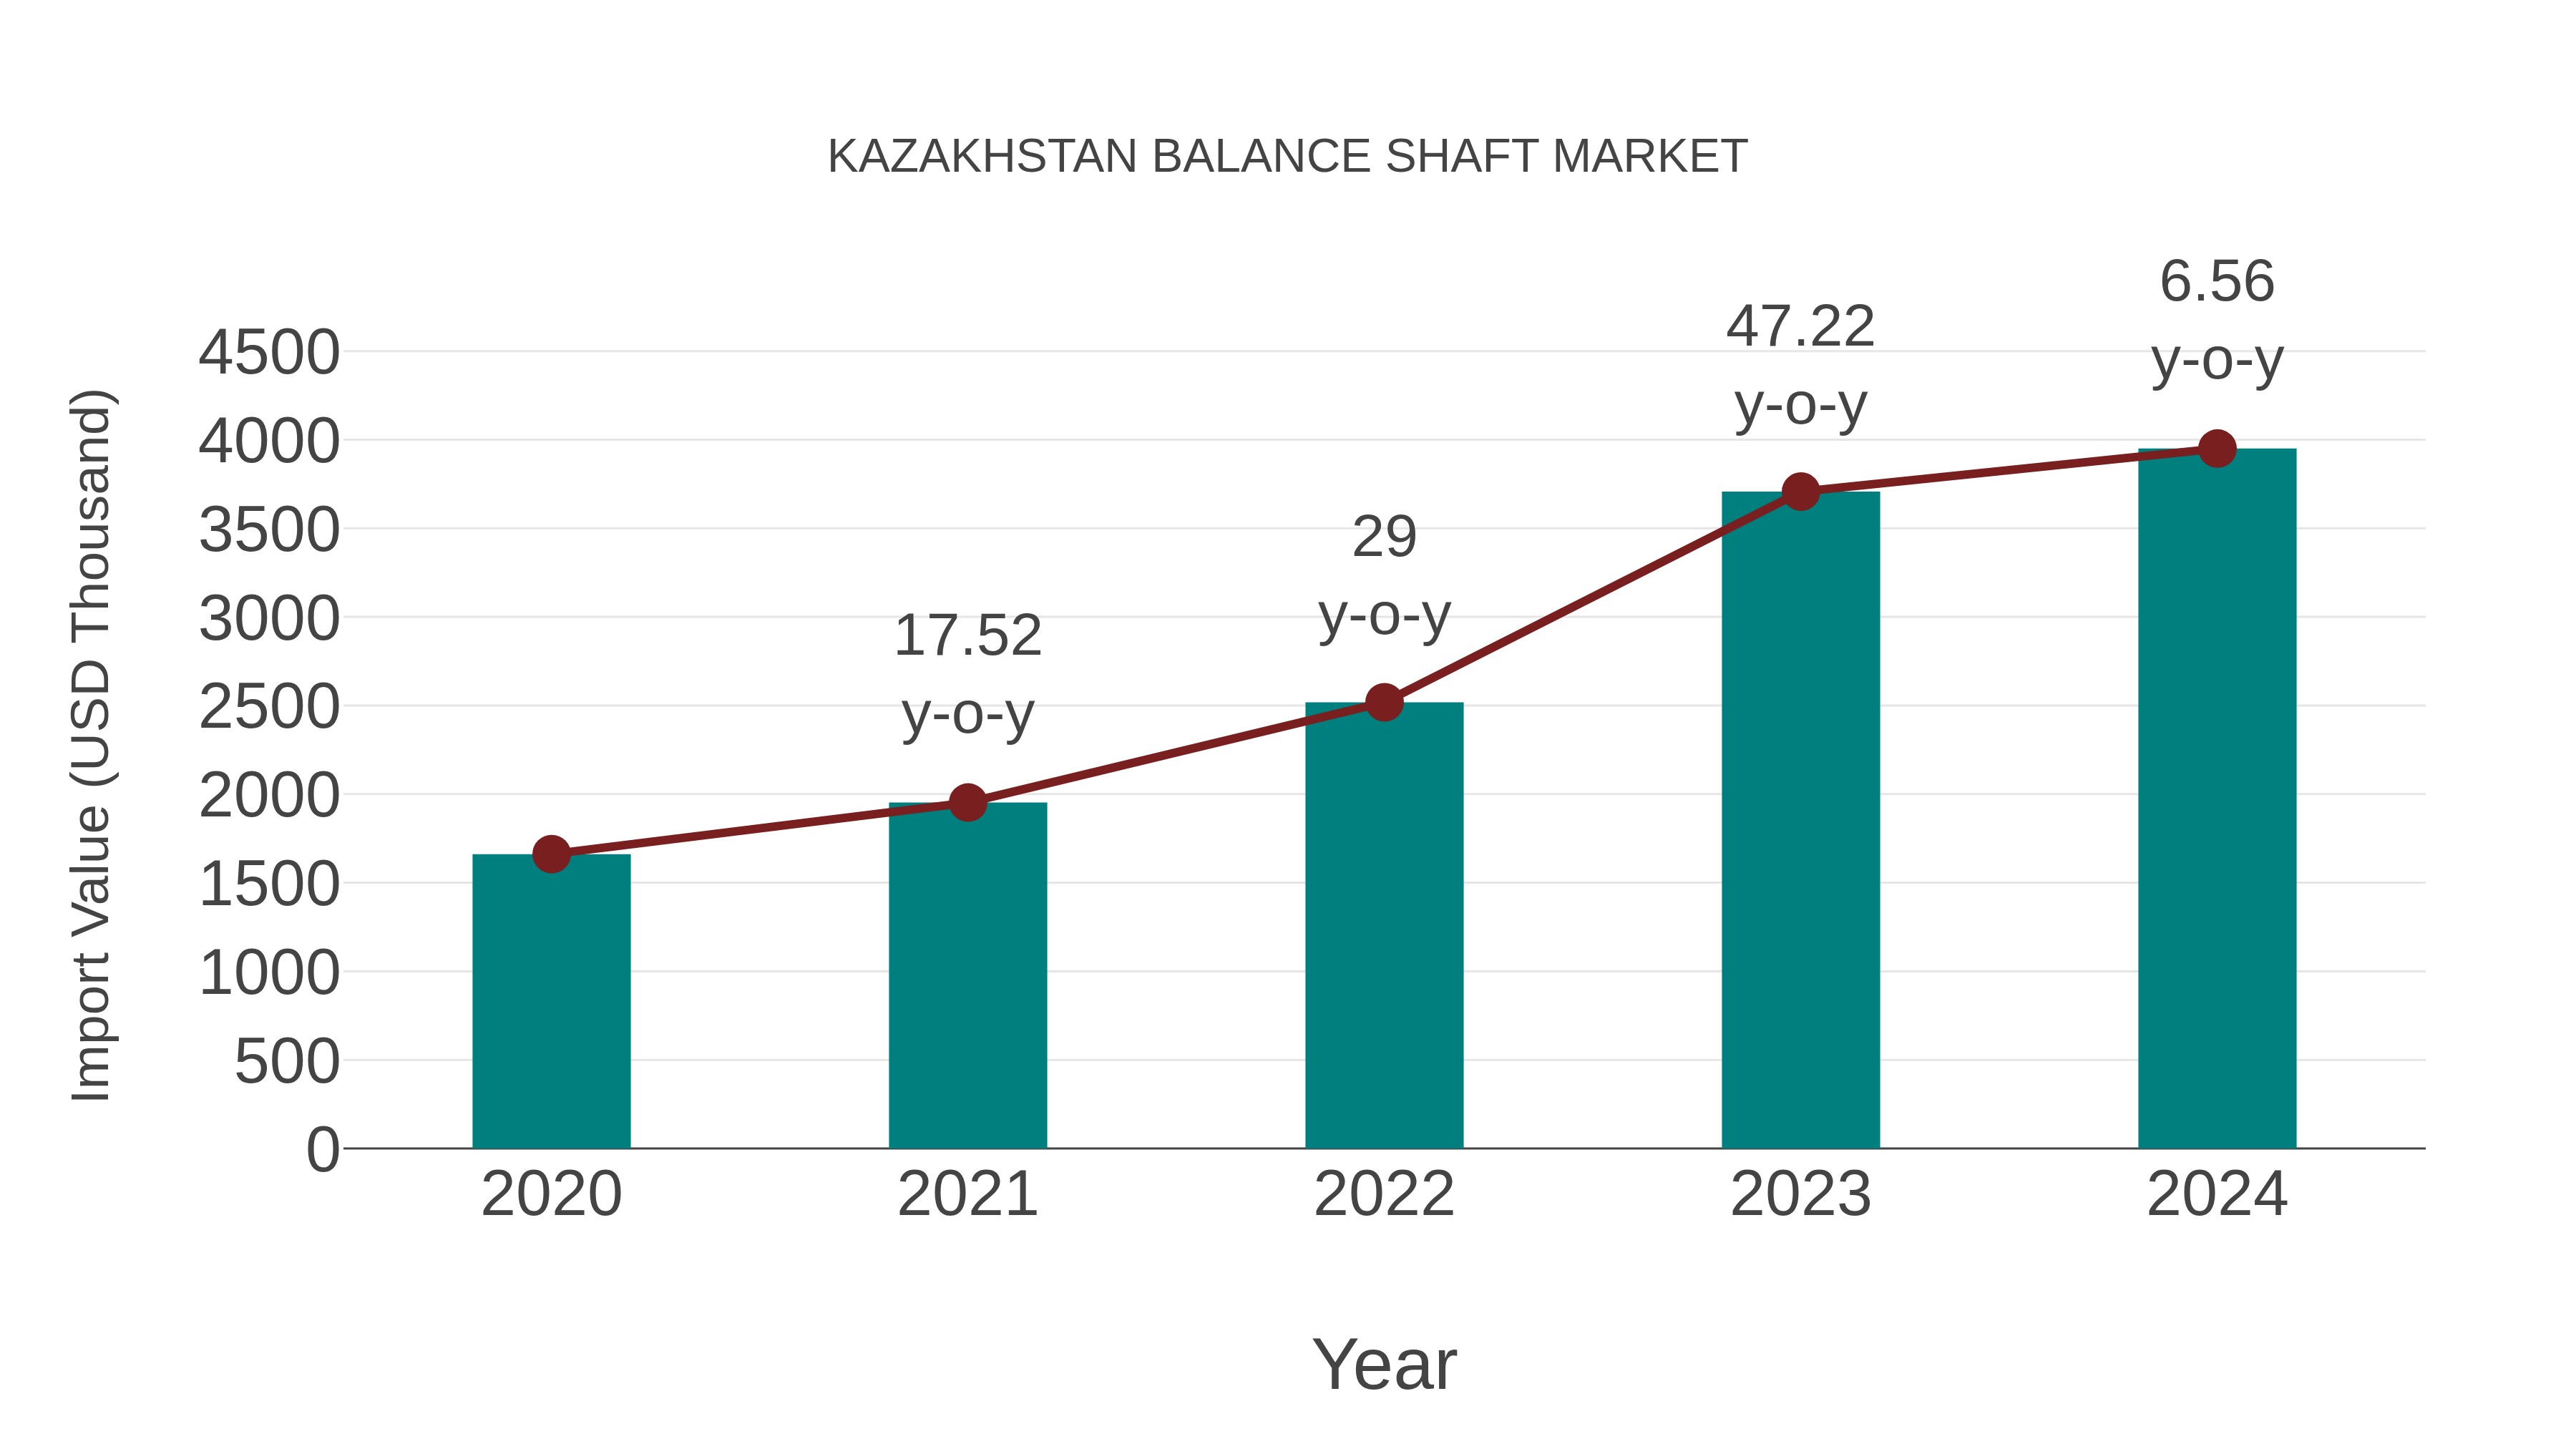
Kazakhstan Balance Shaft Market: Import Trend Analysis
In the Kazakhstan balance shaft market, import trends showed a notable growth rate of 6.56% from 2023 to 2024, with a compound annual growth rate (CAGR) of 24.18% for the period 2020-2024. This import momentum can be attributed to increasing demand for automotive components in the region, indicating a strengthening market stability.
Key Highlights of the Report:
- Kazakhstan Balance Shaft Market Outlook
- Market Size of Kazakhstan Balance Shaft Market, 2024
- Forecast of Kazakhstan Balance Shaft Market, 2031
- Historical Data and Forecast of Kazakhstan Balance Shaft Revenues & Volume for the Period 2021 - 2031
- Kazakhstan Balance Shaft Market Trend Evolution
- Kazakhstan Balance Shaft Market Drivers and Challenges
- Kazakhstan Balance Shaft Price Trends
- Kazakhstan Balance Shaft Porter's Five Forces
- Kazakhstan Balance Shaft Industry Life Cycle
- Historical Data and Forecast of Kazakhstan Balance Shaft Market Revenues & Volume By Engine Type for the Period 2021 - 2031
- Historical Data and Forecast of Kazakhstan Balance Shaft Market Revenues & Volume By Inline-3 Cylinder for the Period 2021 - 2031
- Historical Data and Forecast of Kazakhstan Balance Shaft Market Revenues & Volume By Inline-4 Cylinder for the Period 2021 - 2031
- Historical Data and Forecast of Kazakhstan Balance Shaft Market Revenues & Volume By Inline-5 Cylinder for the Period 2021 - 2031
- Historical Data and Forecast of Kazakhstan Balance Shaft Market Revenues & Volume By V-6 Cylinder for the Period 2021 - 2031
- Historical Data and Forecast of Kazakhstan Balance Shaft Market Revenues & Volume By Manufacturing Process for the Period 2021 - 2031
- Historical Data and Forecast of Kazakhstan Balance Shaft Market Revenues & Volume By Forged for the Period 2021 - 2031
- Historical Data and Forecast of Kazakhstan Balance Shaft Market Revenues & Volume By Cast Balance Shaft for the Period 2021 - 2031
- Kazakhstan Balance Shaft Import Export Trade Statistics
- Market Opportunity Assessment By Engine Type
- Market Opportunity Assessment By Manufacturing Process
- Kazakhstan Balance Shaft Top Companies Market Share
- Kazakhstan Balance Shaft Competitive Benchmarking By Technical and Operational Parameters
- Kazakhstan Balance Shaft Company Profiles
- Kazakhstan Balance Shaft Key Strategic Recommendations
Kazakhstan Balance Shaft Market (2025-2031): FAQs
The growing automotive industry in Kazakhstan, such as the emergence of local brands like Saryarka Motors, is driving the demand for balance shafts. Additionally, the adoption of advanced technologies by major players like Kazzinc Engineering is fueling market growth.
The long-term outlook for the Kazakhstan balance shaft market is positive due to the increasing demand for automotive components driven by the growth of companies like Toyota and Renault in the region. Emerging technologies such as lightweight and durable composite materials are also expected to shape the future direction of the market.
The Kazakhstan balance shaft market is expected to witness steady growth in the coming years, driven by factors such as increasing demand for automotive components from major players like Toyota, Volkswagen, and Renault operating in the region. Additionally, advancements in technologies related to balance shaft manufacturing and rising investments in the automotive sector in Kazakhstan are likely to contribute to the market's positive outlook.
There are several opportunities for businesses looking to invest in the Kazakhstan balance shaft market. Companies like Toyota, Ford, and BMW are increasingly sourcing balance shafts from Kazakhstan due to the country's competitive manufacturing costs and skilled workforce. By entering this market, businesses can benefit from partnerships with local manufacturers such as Asia Auto, a leading supplier of automotive components in Kazakhstan, to expand their product offerings and reach a broader customer base in the region.
6Wresearch actively monitors the Kazakhstan Balance Shaft Market and publishes its comprehensive annual report, highlighting emerging trends, growth drivers, revenue analysis, and forecast outlook. Our insights help businesses to make data-backed strategic decisions with ongoing market dynamics. Our analysts track relevent industries related to the Kazakhstan Balance Shaft Market, allowing our clients with actionable intelligence and reliable forecasts tailored to emerging regional needs.
Yes, we provide customisation as per your requirements. To learn more, feel free to contact us on sales@6wresearch.com
1 Executive Summary |
2 Introduction |
2.1 Key Highlights of the Report |
2.2 Report Description |
2.3 Market Scope & Segmentation |
2.4 Research Methodology |
2.5 Assumptions |
3 Kazakhstan Balance Shaft Market Overview |
3.1 Kazakhstan Country Macro Economic Indicators |
3.2 Kazakhstan Balance Shaft Market Revenues & Volume, 2021 & 2031F |
3.3 Kazakhstan Balance Shaft Market - Industry Life Cycle |
3.4 Kazakhstan Balance Shaft Market - Porter's Five Forces |
3.5 Kazakhstan Balance Shaft Market Revenues & Volume Share, By Engine Type, 2021 & 2031F |
3.6 Kazakhstan Balance Shaft Market Revenues & Volume Share, By Manufacturing Process, 2021 & 2031F |
4 Kazakhstan Balance Shaft Market Dynamics |
4.1 Impact Analysis |
4.2 Market Drivers |
4.2.1 Increasing demand for fuel-efficient vehicles in Kazakhstan |
4.2.2 Growth in automotive production and sales in the region |
4.2.3 Technological advancements leading to the adoption of advanced balance shafts in vehicles |
4.3 Market Restraints |
4.3.1 Fluctuating raw material prices impacting manufacturing costs |
4.3.2 Intense market competition from international balance shaft manufacturers |
4.3.3 Regulatory challenges related to environmental standards and emissions control in vehicles |
5 Kazakhstan Balance Shaft Market Trends |
6 Kazakhstan Balance Shaft Market, By Types |
6.1 Kazakhstan Balance Shaft Market, By Engine Type |
6.1.1 Overview and Analysis |
6.1.2 Kazakhstan Balance Shaft Market Revenues & Volume, By Engine Type, 2021 - 2031F |
6.1.3 Kazakhstan Balance Shaft Market Revenues & Volume, By Inline-3 Cylinder, 2021 - 2031F |
6.1.4 Kazakhstan Balance Shaft Market Revenues & Volume, By Inline-4 Cylinder, 2021 - 2031F |
6.1.5 Kazakhstan Balance Shaft Market Revenues & Volume, By Inline-5 Cylinder, 2021 - 2031F |
6.1.6 Kazakhstan Balance Shaft Market Revenues & Volume, By V-6 Cylinder, 2021 - 2031F |
6.2 Kazakhstan Balance Shaft Market, By Manufacturing Process |
6.2.1 Overview and Analysis |
6.2.2 Kazakhstan Balance Shaft Market Revenues & Volume, By Forged , 2021 - 2031F |
6.2.3 Kazakhstan Balance Shaft Market Revenues & Volume, By Cast Balance Shaft, 2021 - 2031F |
7 Kazakhstan Balance Shaft Market Import-Export Trade Statistics |
7.1 Kazakhstan Balance Shaft Market Export to Major Countries |
7.2 Kazakhstan Balance Shaft Market Imports from Major Countries |
8 Kazakhstan Balance Shaft Market Key Performance Indicators |
8.1 Adoption rate of advanced balance shaft technologies in the automotive sector |
8.2 Number of new product launches by balance shaft manufacturers in Kazakhstan |
8.3 Investment in research and development for balance shaft innovation |
8.4 Supplier diversity and supply chain resilience in the balance shaft market |
9 Kazakhstan Balance Shaft Market - Opportunity Assessment |
9.1 Kazakhstan Balance Shaft Market Opportunity Assessment, By Engine Type, 2021 & 2031F |
9.2 Kazakhstan Balance Shaft Market Opportunity Assessment, By Manufacturing Process, 2021 & 2031F |
10 Kazakhstan Balance Shaft Market - Competitive Landscape |
10.1 Kazakhstan Balance Shaft Market Revenue Share, By Companies, 2024 |
10.2 Kazakhstan Balance Shaft Market Competitive Benchmarking, By Operating and Technical Parameters |
11 Company Profiles |
12 Recommendations |
13 Disclaimer |
Global Go To Market Strategy - 2030
Export potential enables firms to identify high-growth global markets with greater confidence by combining advanced trade intelligence with a structured quantitative methodology. The framework analyzes emerging demand trends and country-level import patterns while integrating macroeconomic and trade datasets such as GDP and population forecasts, bilateral import–export flows, tariff structures, elasticity differentials between developed and developing economies, geographic distance, and import demand projections. Using weighted trade values from 2020–2024 as the base period to project country-to-country export potential for 2030, these inputs are operationalized through calculated drivers such as gravity model parameters, tariff impact factors, and projected GDP per-capita growth. Through an analysis of hidden potentials, demand hotspots, and market conditions that are most favorable to success, this method enables firms to focus on target countries, maximize returns, and global expansion with data, backed by accuracy.
By factoring in the projected importer demand gap that is currently unmet and could be potential opportunity, it identifies the potential for the Exporter (Country) among 190 countries, against the general trade analysis, which identifies the biggest importer or exporter.
To discover high-growth global markets and optimize your business strategy:
Click Here
Pricing
- Single User License$ 1,995
- Department License$ 2,400
- Site License$ 3,120
- Global License$ 3,795

Leadership Perspectives from Industry Events
Search
Thought Leadership and Analyst Meet


Our Clients
6WResearch In News
- India Export Attractiveness Tracker 2026
- India Air Conditioner Market Set for Strong Rebound in 2026 After Weather-Led Correction and GST-Driven Recovery: 6Wresearch
- ADAS in India: How Automatic Emergency Braking, Blind Spot Detection & Driver Monitoring are Transforming Road Safety
- Doha a strategic location for EV manufacturing hub: IPA Qatar
- Demand for luxury TVs surging in the GCC, says Samsung
- Empowering Growth: The Thriving Journey of Bangladesh’s Cable Industry
Latest Reports
- Qatar Access and Home Network Market (2026-2032)
- Nicaragua RPG Gaming Market (2026-2032)
- New Zealand RPG Gaming Market (2026-2032)
- Netherlands RPG Gaming Market (2026-2032)
- Nauru RPG Gaming Market (2026-2032)
- Namibia RPG Gaming Market (2026-2032)
- Mozambique RPG Gaming Market (2026-2032)
- Montenegro RPG Gaming Market (2026-2032)
- Mongolia RPG Gaming Market (2026-2032)
- Monaco RPG Gaming Market (2026-2032)
Industry Events and Analyst Meet

EV India Expo 2026

HIMTEX 2026

India Refining Summit 2026

India EV Show 2026

EV tech India Expo 2026
Whitepaper
- Middle East & Africa Commercial Security Market Click here to view more.
- Middle East & Africa Fire Safety Systems & Equipment Market Click here to view more.
- GCC Drone Market Click here to view more.
- Middle East Lighting Fixture Market Click here to view more.
- GCC Physical & Perimeter Security Market Click here to view more.