Kenya Cast & Forged Market (2026-2032) | Revenue, Share, Companies, Analysis, COVID-19 IMPACT, Trends, Outlook, Forecast, Growth, Value, Industry & Size
Market Forecast By Product Types (Light Alloys, Copper Alloys, Iron Casting, Steel Casting, Miscellaneous), By Activity Types (Closed Die Forging, Open Die Forging, Rolled Ring Forging, Cold Forging, Non-ferrous Closed Die Forging), By Applications (Automotive, Aerospace, Oil & Gas, Construction, Agriculture, Industrial, Others) And Competitive Landscape
| Product Code: ETC004194 | Publication Date: Sep 2020 | Product Type: Report | ||
| Publisher: 6Wresearch | Author: Ravi Bhandari | No. of Pages: 70 | No. of Figures: 35 | No. of Tables: 5 |
Kenya Cast & Forged Market Summary
The kenya cast & forged market was estimated at USD 929 Million in 2025 and is projected to reach USD 1326 Million by 2032, growing at a CAGR of 6.2% from 2026 to 2032.
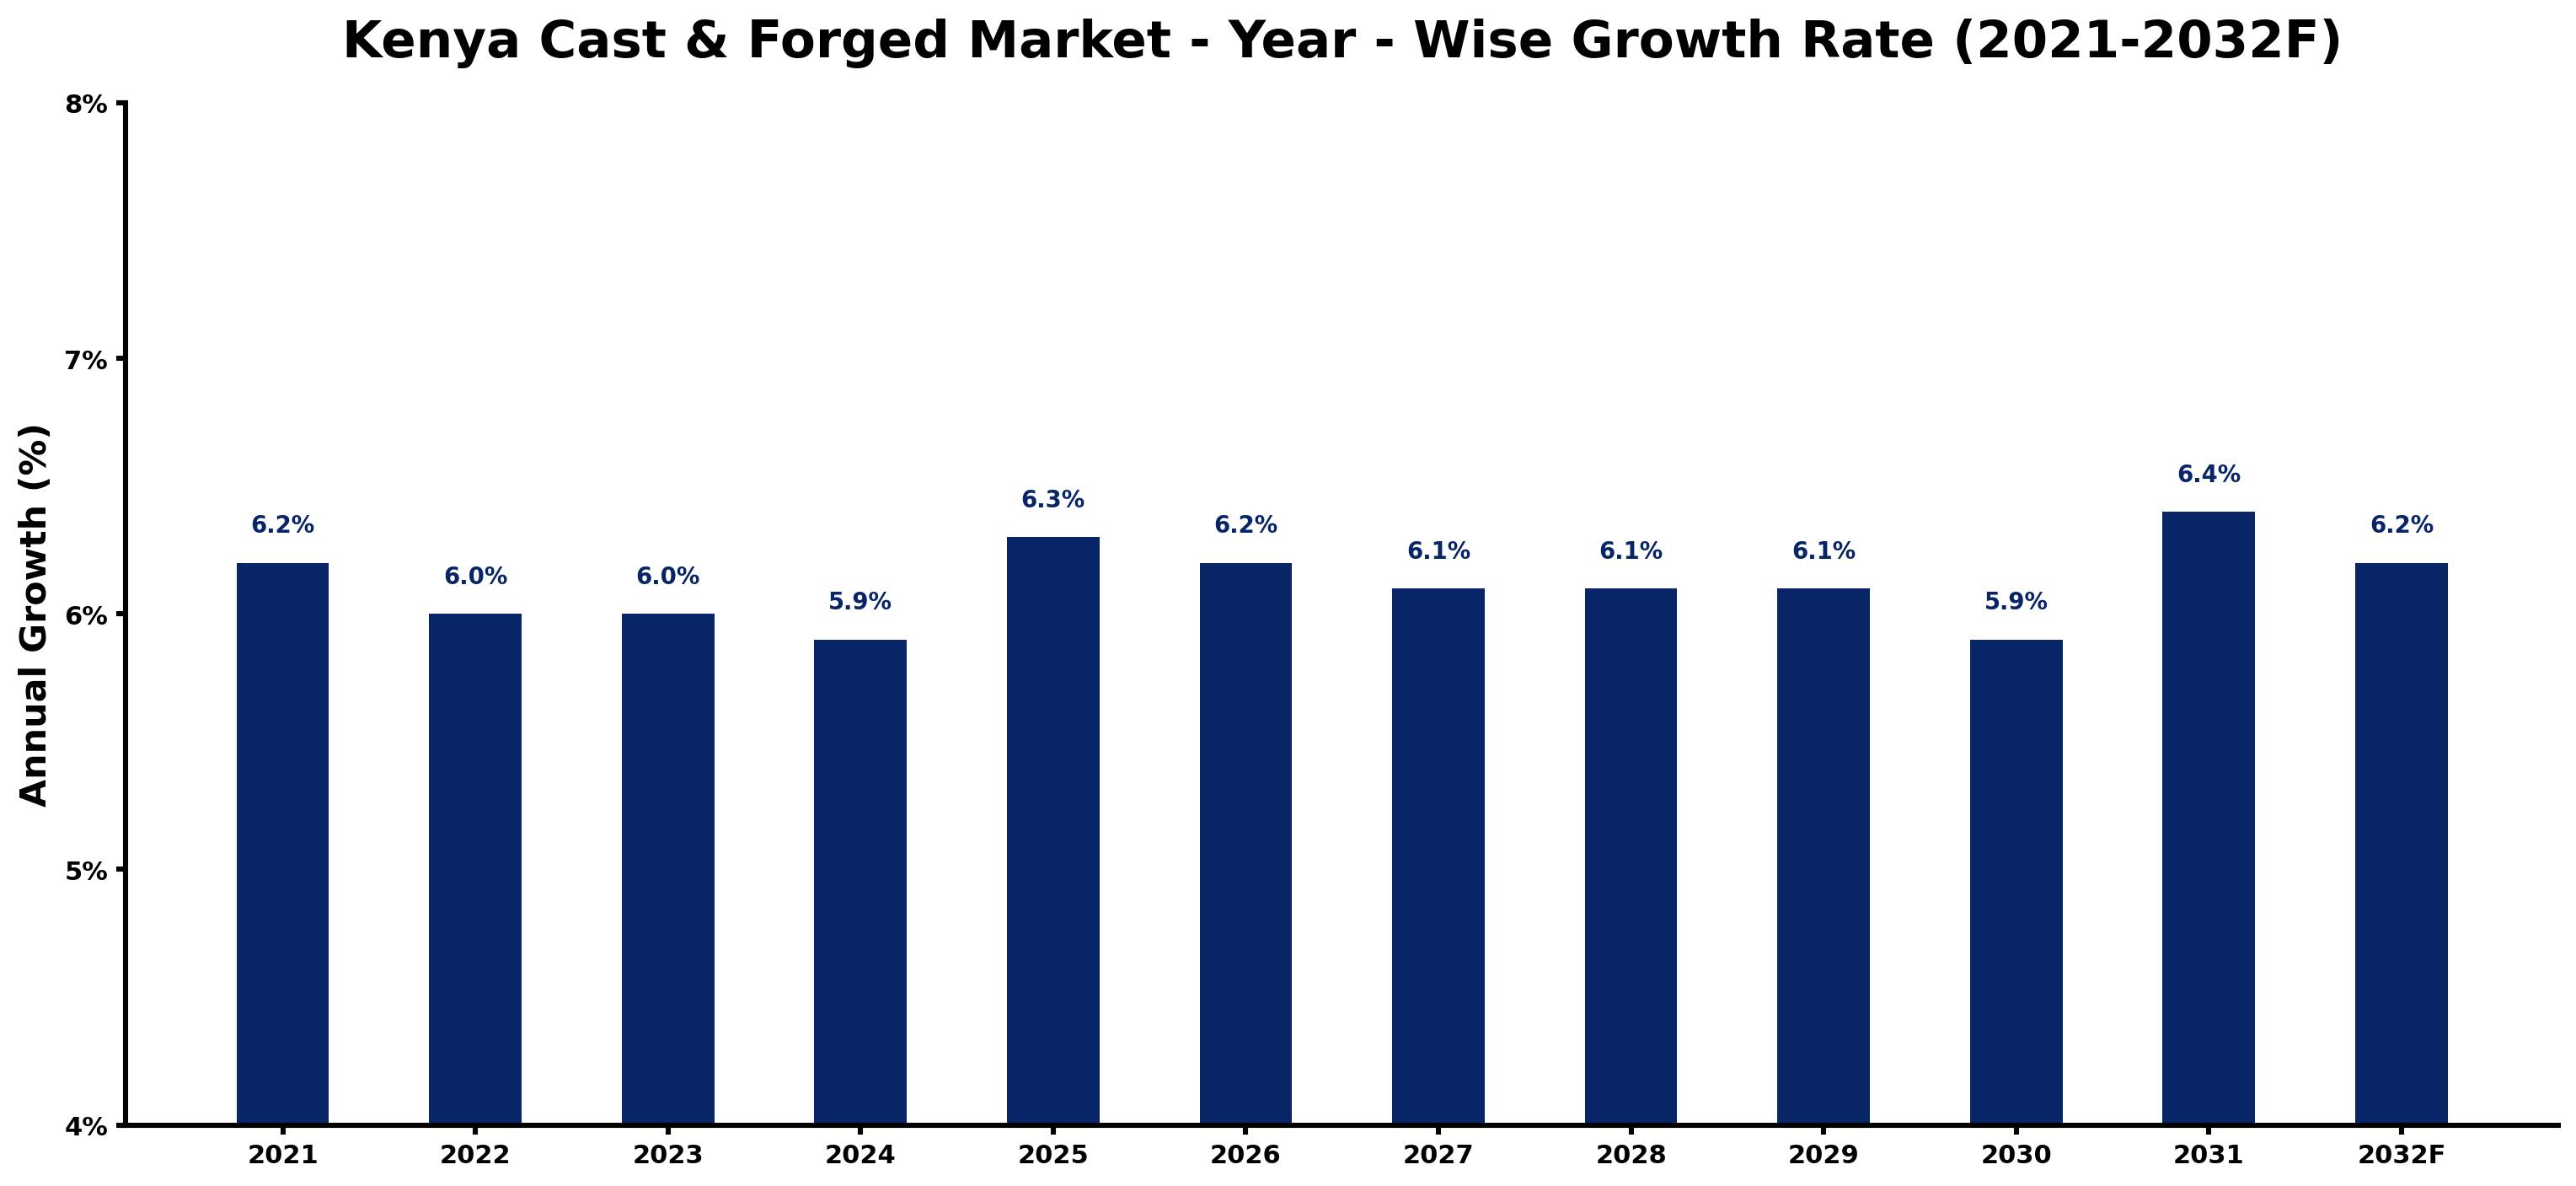
Kenya Cast & Forged Market Growth Rate Analysis (2021-2032)
The Kenya cast and forged market is experiencing stable growth, highlighted by a projected 6.2% increase in 2021, slowing slightly to 6.0% in 2022 and 2023. This stability can be attributed to robust infrastructure development and rising demand from the construction and manufacturing sectors, fueled by increasing investments in energy transition projects. Notably, a slight decline to 5.9% in 2024 reflects temporary market adjustments amid global supply chain disruptions. However, as investments ramp up again post-2024, growth is anticipated to recover to 6.3% in 2025 and maintain an upward trend, with consumer demand and technological advancements playing pivotal roles in this trajectory.
Kenya Cast & Forged Market Year-wise Growth Rate and Key Drivers
This graph highlights how the Kenya Cast & Forged Market has steadily grown over the past five years, supported by major growth factors.
The table below presents the year wise growth rates along with the key drivers influencing the market
| Year | Growth Rate | Major Drivers |
| 2021 | 6.2% | Post-pandemic recovery spurred infrastructure projects across urban and rural areas. |
| 2022 | 6.0% | Local manufacturers increasingly capture market share due to reduced import reliance. |
| 2023 | 6.0% | Innovations in metallurgy enhance product quality, attracting diverse industrial applications. |
| 2024 | 5.9% | Investment in renewable energy sectors creates new opportunities for cast and forged components. |
| 2025 | 6.3% | Regional construction booms necessitate robust materials, fueling demand for forged products. |
| 2026 | 6.2% | Emerging tech companies require specialized components, shaping market dynamics significantly. |
| 2027 | 6.1% | Collaborations between local firms and international players boost production capacities noticeably. |
| 2028 | 6.1% | Sustainability trends encourage adoption of eco-friendly materials in manufacturing processes. |
| 2029 | 6.1% | E commerce platforms make it easier for local suppliers to reach broader markets. |
| 2030 | 5.9% | Education and training programs bridge skills gaps, elevating workforce capabilities substantially. |
| 2031 | 6.4% | Changes in consumer preferences favor locally produced goods, enhancing market growth prospects. |
| 2032 | 6.2% | Long-term economic stability supports investments in infrastructure, sustaining industry growth momentum. |
Note - Market size estimations and growth projections presented in this report are based on 6Wresearch's advanced forecasting approach, validated with industry datasets as of June 2026.
Key Highlights of the Report:
- Kenya Cast & Forged Market Overview
- Kenya Cast & Forged Market Outlook
- Market Size of Kenya Cast & Forged Market, 2025
- Forecast of Kenya Cast & Forged Market, 2032F
- Historical Data and Forecast of Kenya Cast & Forged Revenues & Volume for the Period 2022-2032F
- Kenya Cast & Forged Market Trend Evolution
- Kenya Cast & Forged Market Drivers and Challenges
- Kenya Cast & Forged Price Trends
- Kenya Cast & Forged Porter's Five Forces
- Kenya Cast & Forged Industry Life Cycle
- Historical Data and Forecast of Kenya Cast & Forged Market Revenues & Volume By Product Types for the Period 2022-2032F
- Historical Data and Forecast of Kenya Cast & Forged Market Revenues & Volume By Light Alloys for the Period 2022-2032F
- Historical Data and Forecast of Kenya Cast & Forged Market Revenues & Volume By Copper Alloys for the Period 2022-2032F
- Historical Data and Forecast of Kenya Cast & Forged Market Revenues & Volume By Iron Casting for the Period 2022-2032F
- Historical Data and Forecast of Kenya Cast & Forged Market Revenues & Volume By Steel Casting for the Period 2022-2032F
- Historical Data and Forecast of Kenya Cast & Forged Market Revenues & Volume By Miscellaneous for the Period 2022-2032F
- Historical Data and Forecast of Kenya Cast & Forged Market Revenues & Volume By Activity Types for the Period 2022-2032F
- Historical Data and Forecast of Kenya Cast & Forged Market Revenues & Volume By Closed Die Forging for the Period 2022-2032F
- Historical Data and Forecast of Kenya Cast & Forged Market Revenues & Volume By Open Die Forging for the Period 2022-2032F
- Historical Data and Forecast of Kenya Cast & Forged Market Revenues & Volume By Rolled Ring Forging for the Period 2022-2032F
- Historical Data and Forecast of Kenya Cast & Forged Market Revenues & Volume By Cold Forging for the Period 2022-2032F
- Historical Data and Forecast of Kenya Cast & Forged Market Revenues & Volume By Non-ferrous Closed Die Forging for the Period 2022-2032F
- Historical Data and Forecast of Kenya Cast & Forged Market Revenues & Volume By Applications for the Period 2022-2032F
- Historical Data and Forecast of Kenya Cast & Forged Market Revenues & Volume By Automotive for the Period 2022-2032F
- Historical Data and Forecast of Kenya Cast & Forged Market Revenues & Volume By Aerospace for the Period 2022-2032F
- Historical Data and Forecast of Kenya Cast & Forged Market Revenues & Volume By Oil & Gas for the Period 2022-2032F
- Historical Data and Forecast of Kenya Cast & Forged Market Revenues & Volume By Construction for the Period 2022-2032F
- Historical Data and Forecast of Kenya Cast & Forged Market Revenues & Volume By Agriculture for the Period 2022-2032F
- Historical Data and Forecast of Kenya Cast & Forged Market Revenues & Volume By Industrial for the Period 2022-2032F
- Historical Data and Forecast of Kenya Cast & Forged Market Revenues & Volume By Others for the Period 2022-2032F
- Kenya Cast & Forged Import Export Trade Statistics
- Market Opportunity Assessment By Product Types
- Market Opportunity Assessment By Activity Types
- Market Opportunity Assessment By Applications
- Kenya Cast & Forged Top Companies Market Share
- Kenya Cast & Forged Competitive Benchmarking By Technical and Operational Parameters
- Kenya Cast & Forged Company Profiles
- Kenya Cast & Forged Key Strategic Recommendations
Frequently Asked Questions About the Market Study (FAQs):
6Wresearch actively monitors the Kenya Cast & Forged Market and publishes its comprehensive annual report, highlighting emerging trends, growth drivers, revenue analysis, and forecast outlook. Our insights help businesses to make data-backed strategic decisions with ongoing market dynamics. Our analysts track relevent industries related to the Kenya Cast & Forged Market, allowing our clients with actionable intelligence and reliable forecasts tailored to emerging regional needs.
Yes, we provide customisation as per your requirements. To learn more, feel free to contact us on sales@6wresearch.com
| Table of Contents |
| 1. Executive Summary |
| 2. Introduction |
| 2.1. Key Highlights of the Report |
| 2.2. Report Description |
| 2.3. Market Scope & Segmentation |
| 2.4. Research Methodology |
| 2.5. Assumptions |
| 3. Kenya Cast & Forged Market Overview |
| 3.1. Kenya Country Macro Economic Indicators |
| 3.2. Kenya Cast & Forged Market Revenues & Volume, 2022 & 2032F |
| 3.3. Kenya Cast & Forged Market - Industry Life Cycle |
| 3.4. Kenya Cast & Forged Market - Porter's Five Forces |
| 3.5. Kenya Cast & Forged Market Revenues & Volume Share, By Product Types, 2022 & 2032F |
| 3.6. Kenya Cast & Forged Market Revenues & Volume Share, By Activity Types, 2022 & 2032F |
| 3.7. Kenya Cast & Forged Market Revenues & Volume Share, By Applications, 2022 & 2032F |
| 4. Kenya Cast & Forged Market Dynamics |
| 4.1. Impact Analysis |
| 4.2. Market Drivers |
| 4.3. Market Restraints |
| 5. Kenya Cast & Forged Market Trends |
| 6. Kenya Cast & Forged Market, By Types |
| 6.1. Kenya Cast & Forged Market, By Product Types |
| 6.1.1 Overview and Analysis |
| 6.1.2. Kenya Cast & Forged Market Revenues & Volume, By Product Types, 2022-2032F |
| 6.1.3. Kenya Cast & Forged Market Revenues & Volume, By Light Alloys, 2022-2032F |
| 6.1.4. Kenya Cast & Forged Market Revenues & Volume, By Copper Alloys, 2022-2032F |
| 6.1.5. Kenya Cast & Forged Market Revenues & Volume, By Iron Casting, 2022-2032F |
| 6.1.6. Kenya Cast & Forged Market Revenues & Volume, By Steel Casting, 2022-2032F |
| 6.1.7. Kenya Cast & Forged Market Revenues & Volume, By Miscellaneous, 2022-2032F |
| 6.2. Kenya Cast & Forged Market, By Activity Types |
| 6.2.1. Overview and Analysis |
| 6.2.2. Kenya Cast & Forged Market Revenues & Volume, By Closed Die Forging, 2022-2032F |
| 6.2.3. Kenya Cast & Forged Market Revenues & Volume, By Open Die Forging, 2022-2032F |
| 6.2.4. Kenya Cast & Forged Market Revenues & Volume, By Rolled Ring Forging, 2022-2032F |
| 6.2.5. Kenya Cast & Forged Market Revenues & Volume, By Cold Forging, 2022-2032F |
| 6.2.6. Kenya Cast & Forged Market Revenues & Volume, By Non-ferrous Closed Die Forging, 2022-2032F |
| 6.3. Kenya Cast & Forged Market, By Applications |
| 6.3.1. Overview and Analysis |
| 6.3.2. Kenya Cast & Forged Market Revenues & Volume, By Automotive, 2022-2032F |
| 6.3.3 Kenya Cast & Forged Market Revenues & Volume, By Aerospace, 2022-2032F |
| 6.3.4. Kenya Cast & Forged Market Revenues & Volume, By Oil & Gas, 2022-2032F |
| 6.3.5. Kenya Cast & Forged Market Revenues & Volume, By Construction, 2022-2032F |
| 6.3.6. Kenya Cast & Forged Market Revenues & Volume, By Agriculture, 2022-2032F |
| 6.3.7. Kenya Cast & Forged Market Revenues & Volume, By Industrial, 2022-2032F |
| 7. Kenya Cast & Forged Market Import-Export Trade Statistics |
| 7.1. Kenya Cast & Forged Market Export to Major Countries |
| 7.2. Kenya Cast & Forged Market Imports from Major Countries |
| 8. Kenya Cast & Forged Market Key Performance Indicators |
| 9. Kenya Cast & Forged Market - Opportunity Assessment |
| 9.1. Kenya Cast & Forged Market Opportunity Assessment, By Product Types, 2022 & 2032F |
| 9.2. Kenya Cast & Forged Market Opportunity Assessment, By Activity Types, 2022 & 2032F |
| 9.3. Kenya Cast & Forged Market Opportunity Assessment, By Applications, 2022 & 2032F |
| 10. Kenya Cast & Forged Market - Competitive Landscape |
| 10.1. Kenya Cast & Forged Market Revenue Share, By Companies, 2025 |
| 10.2. Kenya Cast & Forged Market Competitive Benchmarking, By Operating and Technical Parameters |
| 11. Company Profiles |
| 12. Recommendations |
| 13. Disclaimer |
Global Go To Market Strategy - 2030
Export potential enables firms to identify high-growth global markets with greater confidence by combining advanced trade intelligence with a structured quantitative methodology. The framework analyzes emerging demand trends and country-level import patterns while integrating macroeconomic and trade datasets such as GDP and population forecasts, bilateral import–export flows, tariff structures, elasticity differentials between developed and developing economies, geographic distance, and import demand projections. Using weighted trade values from 2020–2024 as the base period to project country-to-country export potential for 2030, these inputs are operationalized through calculated drivers such as gravity model parameters, tariff impact factors, and projected GDP per-capita growth. Through an analysis of hidden potentials, demand hotspots, and market conditions that are most favorable to success, this method enables firms to focus on target countries, maximize returns, and global expansion with data, backed by accuracy.
By factoring in the projected importer demand gap that is currently unmet and could be potential opportunity, it identifies the potential for the Exporter (Country) among 190 countries, against the general trade analysis, which identifies the biggest importer or exporter.
To discover high-growth global markets and optimize your business strategy:
Click Here
Pricing
- Single User License$ 1,995
- Department License$ 2,400
- Site License$ 3,120
- Global License$ 3,795

Leadership Perspectives from Industry Events
Search
Thought Leadership and Analyst Meet


Our Clients
6WResearch In News
- India Air Conditioner Market Set for Strong Rebound in 2026 After Weather-Led Correction and GST-Driven Recovery: 6Wresearch
- ADAS in India: How Automatic Emergency Braking, Blind Spot Detection & Driver Monitoring are Transforming Road Safety
- Doha a strategic location for EV manufacturing hub: IPA Qatar
- Demand for luxury TVs surging in the GCC, says Samsung
- Empowering Growth: The Thriving Journey of Bangladesh’s Cable Industry
- Demand for luxury TVs surging in the GCC, says Samsung
Latest Reports
- Poland Fire Protection Systems Market (2026-2032)
- Cape Verde Portable Hand-Thrown Extinguisher Market (2026-2032)
- Canada Portable Hand-Thrown Extinguisher Market (2026-2032)
- Cameroon Portable Hand-Thrown Extinguisher Market (2026-2032)
- Burundi Portable Hand-Thrown Extinguisher Market (2026-2032)
- Burkina Faso Portable Hand-Thrown Extinguisher Market (2026-2032)
- Bulgaria Portable Hand-Thrown Extinguisher Market (2026-2032)
- Brunei Portable Hand-Thrown Extinguisher Market (2026-2032)
- Botswana Portable Hand-Thrown Extinguisher Market (2026-2032)
- Bosnia and Herzegovina Portable Hand-Thrown Extinguisher Market (2026-2032)
Industry Events and Analyst Meet

HIMTEX 2026

India Refining Summit 2026

India EV Show 2026

EV tech India Expo 2026

Auto Tech Asia 2026
Whitepaper
- Middle East & Africa Commercial Security Market Click here to view more.
- Middle East & Africa Fire Safety Systems & Equipment Market Click here to view more.
- GCC Drone Market Click here to view more.
- Middle East Lighting Fixture Market Click here to view more.
- GCC Physical & Perimeter Security Market Click here to view more.