Kenya Chlor Alkali Market (2026-2032) Outlook | Size, Revenue, Industry, Forecast, Value, Growth, Trends, Share, Analysis & Companies
Market Forecast By Product (Caustic Soda, Chlorine, Soda Ash), By Production Process (Membrane Cell, Diaphragm Cell, Other Production Processes), By Application (Pulp and Paper, Organic Chemical, Inorganic Chemical, Soap and Detergent, Alumina, Textile, Other ) And Competitive Landscape
| Product Code: ETC193022 | Publication Date: May 2022 | Updated Date: Jun 2026 | Product Type: Market Research Report | |
| Publisher: 6Wresearch | Author: Ravi Bhandari | No. of Pages: 60 | No. of Figures: 40 | No. of Tables: 7 |
Kenya Chlor Alkali Market Size, Share & Growth Rate
The Kenya Chlor Alkali Market was estimated at USD 241 Million in 2025 and is projected to reach USD 326 Million by 2032, growing at a CAGR of 4.4% from 2026 to 2032. This growth trajectory is fueled by escalating industrial activities across the country, particularly in water treatment and textiles, where the demand for chlorine and caustic soda is surging. The market is also benefiting from increased awareness surrounding the importance of sustainable practices, prompting more industries to adopt these essential chemicals.
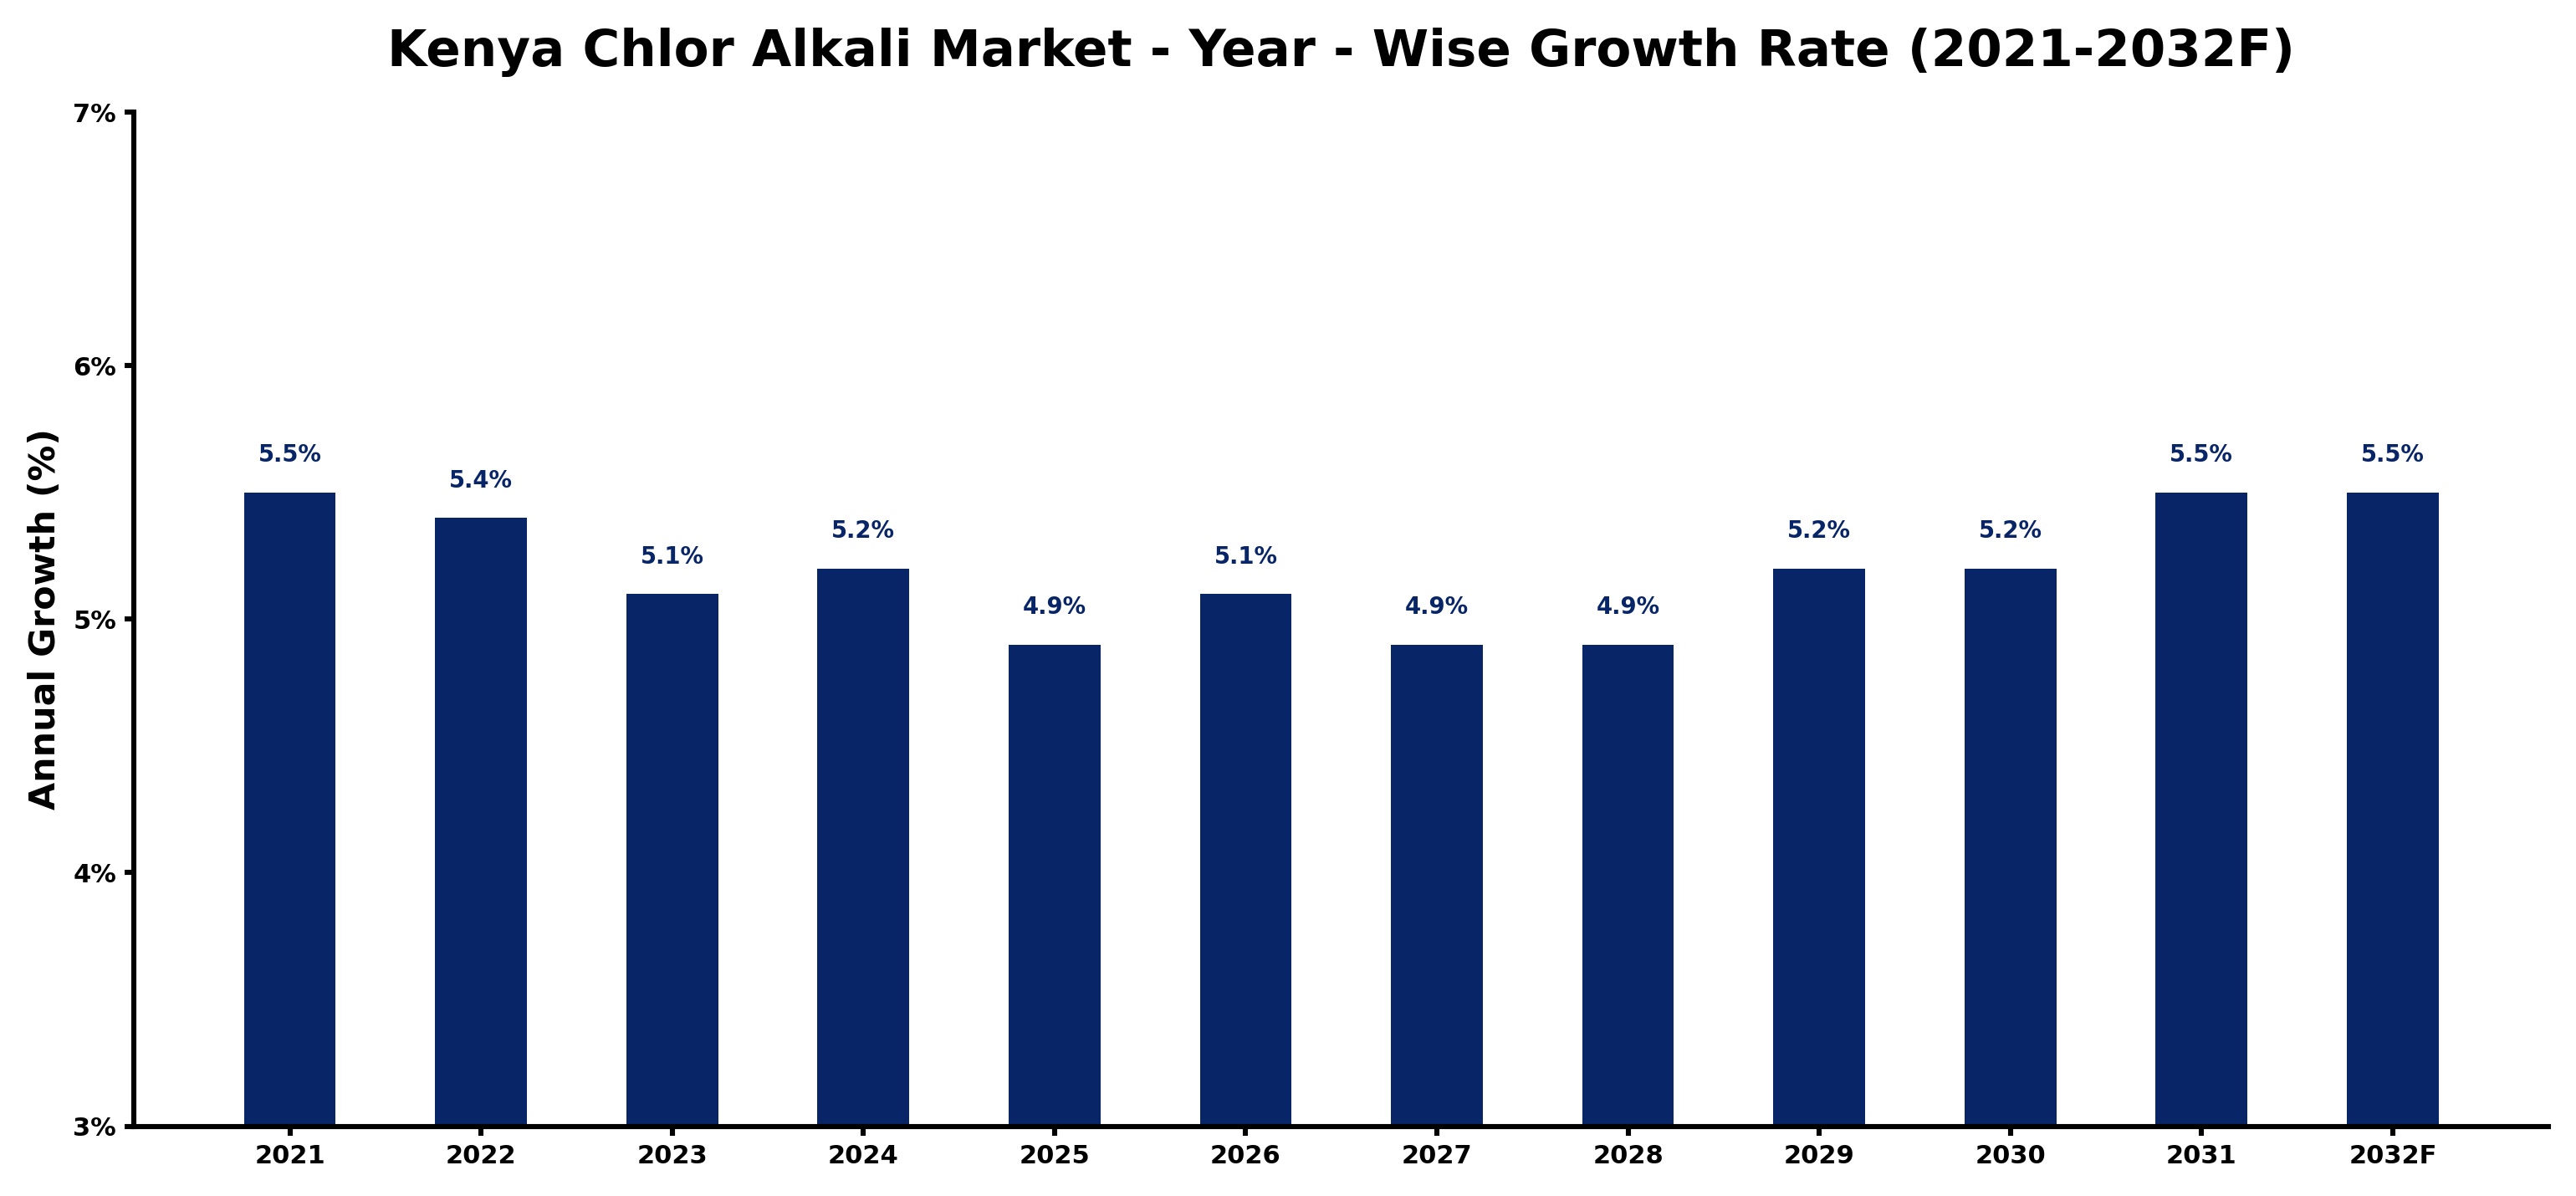
Kenya Chlor Alkali Market Growth Rate Analysis (2021-2032)
The Kenya Chlor Alkali market has been exhibiting stable growth, with a notable increase of 5.5% in 2021, followed by a slight dip to 5.4% in 2022. This trend reflects a robust demand driven by industrial applications, particularly in manufacturing and water treatment, alongside ongoing investments in local infrastructure. The growth rate continued to moderate, hitting 5.1% in 2023 and fluctuating between 4.9% and 5.2% through 2028. However, a resurgence to 5.5% is anticipated in both 2031 and 2032, as energy transition policies and technological advancements foster an environment ripe for expansion. Increasing consumer demand and regulatory support further underpin the sector's potential, making it a pivotal area for stakeholders.
Kenya Chlor Alkali Market Year-wise Growth Rate and Key Drivers
This graph highlights how the Kenya Chlor Alkali Market has steadily grown over the past five years, supported by major growth factors.
The table below presents the year‑wise growth rates along with the key drivers influencing the market
| Year | Growth Rate | Major Drivers |
| 2021 | 5.5% | Increased demand for chlorine products |
| 2022 | 5.4% | Expansion of industrial applications growth |
| 2023 | 5.1% | Rising construction activities driving demand |
| 2024 | 5.2% | Water treatment initiatives enhanced usage |
| 2025 | 4.9% | Emerging markets expanding product reach |
| 2026 | 5.1% | Technological advancements improved efficiency |
| 2027 | 4.9% | Growing healthcare sector increased consumption |
| 2028 | 4.9% | Sustainability initiatives boosted market growth |
| 2029 | 5.2% | Regulatory support enhanced industry stability |
| 2030 | 5.2% | Innovative product offerings attracted customers |
| 2031 | 5.5% | Export opportunities expanded market access |
| 2032 | 5.5% | Rising consumer awareness drove sales |
Note - Market size estimations and growth projections presented in this report are based on 6Wresearch’s advanced forecasting approach, validated with industry datasets as of June 2026.
Kenya Chlor Alkali Market Synopsis
In Kenya, the chlor alkali market is characterized by a growing need for water purification and sanitation solutions, significantly propelling demand for chlorine. This chemical plays a crucial role in water treatment processes, ensuring safe drinking water for the population. Furthermore, the rising textile industry is driving the usage of caustic soda, which is vital in fabric processing and dyeing.
The market's expansion is underpinned by local production initiatives that aim to reduce reliance on imported chemicals. Investments in production facilities and technological advancements are key to improving efficiency and meeting the increasing domestic demand for chlor alkali products. As industries evolve and diversify, the market landscape is becoming more competitive, requiring a focus on innovation and sustainability.
Kenya Chlor Alkali Market Key Takeaways
- The market is driven by robust demand from water treatment and textile manufacturing sectors.
- Local production initiatives are gaining momentum, reducing dependency on imports.
- Sustainability and eco-friendly practices are becoming central to industry development.
- Technological advancements are enhancing production efficiency and product quality.
- Government policies are supportive of local manufacturers, fostering a conducive business environment.
Evaluation of Restraints in Kenya Chlor Alkali Market
Despite its growth potential, the Kenya chlor alkali market faces significant challenges that could restrain its expansion. High energy costs remain a major concern, as they directly affect the production expenses of chlorine and caustic soda. Furthermore, strict environmental regulations may impose limitations on production processes, necessitating compliance investments that can burden manufacturers. Additionally, the volatility of raw material prices complicates financial forecasting for companies, potentially hindering long-term investment decisions.
Kenya Chlor Alkali Market Trends
Currently, there is a noticeable shift towards sustainable chemical production methods within the Kenyan chlor alkali market. Manufacturers are increasingly adopting eco-friendly practices, such as using renewable energy sources and minimizing waste during production. Additionally, the rising trend of circular economy principles is encouraging companies to focus on recycling and reusing resources. These trends not only enhance sustainability but also align with global initiatives aimed at reducing environmental footprints.
Kenya Chlor Alkali Market Opportunities
The Kenya chlor alkali market presents numerous growth opportunities, particularly in the realm of innovative applications. With the burgeoning interest in biodegradable and eco-friendly materials, there is potential for the development of new product lines utilizing chlor alkali derivatives. Additionally, investment in research and development can lead to breakthroughs in production technologies, further positioning local manufacturers as leaders in sustainable chemical production. Expanding into neighboring markets also offers avenues for growth and diversification.
Government Initiatives in the Kenya Chlor Alkali Market
The Kenyan government is actively working to bolster the chlor alkali market through various initiatives and policies aimed at enhancing industrial growth. This includes providing incentives for local producers, such as tax breaks and subsidies, to encourage domestic production of chlor alkali products. Additionally, efforts are being made to reduce import tariffs on raw materials, making it more feasible for manufacturers to acquire necessary components. The government is also investing in research programs focused on sustainable production methods to ensure compliance with environmental standards.
Future Insights of the Kenya Chlor Alkali Market
Looking ahead to 2026-2032, the Kenya chlor alkali market is poised for considerable growth. As industries continue to adapt to environmental challenges, the demand for sustainable and efficient chemical solutions will rise. The market will likely see increased investments in technology that enhance production capabilities and reduce environmental impact. Furthermore, as government initiatives support local manufacturing, the competitive landscape will evolve, potentially leading to consolidation among companies that prioritize innovation and sustainability.
Kenya Chlor Alkali Market Latest Developments (May 2025 - June 2026)
In recent months, the Kenya chlor alkali market has witnessed a surge in local investments aimed at expanding production capacities. Companies are exploring innovative extraction and purification technologies to improve the efficiency and quality of their products. Furthermore, industry collaborations are emerging, focusing on research and development projects that emphasize sustainability and eco-friendly production practices. This collaborative approach signals a shift towards a more integrated and responsible market ecosystem.
Kenya Chlor Alkali Market - Key Attractiveness of the Report
- 10 Years of Market Numbers
- Historical Data Starting from 2022 to 2025
- Base Year: 2025
- Forecast Data until 2032
- Key Performance Indicators Impacting the Market
- Major Upcoming Developments and Projects
Key Highlights of the Report:
- Kenya Chlor Alkali Market Outlook
- Market Size of Kenya Chlor Alkali Market, 2025
- Forecast of Kenya Chlor Alkali Market, 2032
- Historical Data and Forecast of Kenya Chlor Alkali Revenues & Volume for the Period 2022-2032F
- Kenya Chlor Alkali Market Trend Evolution
- Kenya Chlor Alkali Market Drivers and Challenges
- Kenya Chlor Alkali Price Trends
- Kenya Chlor Alkali Porter's Five Forces
- Kenya Chlor Alkali Industry Life Cycle
- Historical Data and Forecast of Kenya Chlor Alkali Market Revenues & Volume By Product for the Period 2022-2032F
- Historical Data and Forecast of Kenya Chlor Alkali Market Revenues & Volume By Caustic Soda for the Period 2022-2032F
- Historical Data and Forecast of Kenya Chlor Alkali Market Revenues & Volume By Chlorine for the Period 2022-2032F
- Historical Data and Forecast of Kenya Chlor Alkali Market Revenues & Volume By Soda Ash for the Period 2022-2032F
- Historical Data and Forecast of Kenya Chlor Alkali Market Revenues & Volume By Production Process for the Period 2022-2032F
- Historical Data and Forecast of Kenya Chlor Alkali Market Revenues & Volume By Membrane Cell for the Period 2022-2032F
- Historical Data and Forecast of Kenya Chlor Alkali Market Revenues & Volume By Diaphragm Cell for the Period 2022-2032F
- Historical Data and Forecast of Kenya Chlor Alkali Market Revenues & Volume By Other Production Processes for the Period 2022-2032F
- Historical Data and Forecast of Kenya Chlor Alkali Market Revenues & Volume By Application for the Period 2022-2032F
- Historical Data and Forecast of Kenya Chlor Alkali Market Revenues & Volume By Pulp and Paper for the Period 2022-2032F
- Historical Data and Forecast of Kenya Chlor Alkali Market Revenues & Volume By Organic Chemical for the Period 2022-2032F
- Historical Data and Forecast of Kenya Chlor Alkali Market Revenues & Volume By Inorganic Chemical for the Period 2022-2032F
- Historical Data and Forecast of Kenya Chlor Alkali Market Revenues & Volume By Soap and Detergent for the Period 2022-2032F
- Historical Data and Forecast of Kenya Chlor Alkali Market Revenues & Volume By Alumina for the Period 2022-2032F
- Historical Data and Forecast of Kenya Chlor Alkali Market Revenues & Volume By Textile for the Period 2022-2032F
- Historical Data and Forecast of Kenya Chlor Alkali Market Revenues & Volume By Other for the Period 2022-2032F
- Kenya Chlor Alkali Import Export Trade Statistics
- Market Opportunity Assessment By Product
- Market Opportunity Assessment By Production Process
- Market Opportunity Assessment By Application
- Kenya Chlor Alkali Top Companies Market Share
- Kenya Chlor Alkali Competitive Benchmarking By Technical and Operational Parameters
- Kenya Chlor Alkali Company Profiles
- Kenya Chlor Alkali Key Strategic Recommendations
Kenya Chlor Alkali Market - Frequently Asked Questions
Increasing industrial activities in sectors such as water treatment and textiles, along with a focus on sustainability, are key drivers of market growth.
The market is expected to reach USD 326 Million by 2032, growing from an estimated USD 241 Million in 2025, which translates to a CAGR of 4.4% from 2026 to 2032.
The Kenyan government is implementing policies that incentivize local production and reduce import tariffs, as well as investing in research for eco-friendly production methods.
Current trends include a shift towards sustainable production practices, increased emphasis on innovation, and a rising interest in eco-friendly chemical applications.
The market grapples with high energy costs, regulatory compliance pressures, and competition from imported products, which can affect profitability and market dynamics.
6Wresearch actively monitors the Kenya Chlor Alkali Market and publishes its comprehensive annual report, highlighting emerging trends, growth drivers, revenue analysis, and forecast outlook. Our insights help businesses to make data-backed strategic decisions with ongoing market dynamics. Our analysts track relevent industries related to the Kenya Chlor Alkali Market, allowing our clients with actionable intelligence and reliable forecasts tailored to emerging regional needs.
Yes, we provide customisation as per your requirements. To learn more, feel free to contact us on sales@6wresearch.com
1 Executive Summary |
2 Introduction |
2.1 Key Highlights of the Report |
2.2 Report Description |
2.3 Market Scope & Segmentation |
2.4 Research Methodology |
2.5 Assumptions |
3 Kenya Chlor Alkali Market Overview |
3.1 Kenya Country Macro Economic Indicators |
3.2 Kenya Chlor Alkali Market Revenues & Volume, 2022 & 2032F |
3.3 Kenya Chlor Alkali Market - Industry Life Cycle |
3.4 Kenya Chlor Alkali Market - Porter's Five Forces |
3.5 Kenya Chlor Alkali Market Revenues & Volume Share, By Product, 2022 & 2032F |
3.6 Kenya Chlor Alkali Market Revenues & Volume Share, By Production Process, 2022 & 2032F |
3.7 Kenya Chlor Alkali Market Revenues & Volume Share, By Application, 2022 & 2032F |
4 Kenya Chlor Alkali Market Dynamics |
4.1 Impact Analysis |
4.2 Market Drivers |
4.2.1 Increasing demand for chlor alkali products in industries such as water treatment, chemicals, and textiles. |
4.2.2 Growing population and urbanization leading to higher consumption of products that require chlor alkali. |
4.2.3 Government initiatives promoting industrial growth and infrastructure development. |
4.3 Market Restraints |
4.3.1 Fluctuating prices of raw materials such as salt and electricity affecting production costs. |
4.3.2 Environmental regulations and sustainability concerns impacting production processes. |
4.3.3 Competition from imported chlor alkali products affecting domestic market share. |
5 Kenya Chlor Alkali Market Trends |
6 Kenya Chlor Alkali Market, By Types |
6.1 Kenya Chlor Alkali Market, By Product |
6.1.1 Overview and Analysis |
6.1.2 Kenya Chlor Alkali Market Revenues & Volume, By Product, 2022-2032F |
6.1.3 Kenya Chlor Alkali Market Revenues & Volume, By Caustic Soda, 2022-2032F |
6.1.4 Kenya Chlor Alkali Market Revenues & Volume, By Chlorine, 2022-2032F |
6.1.5 Kenya Chlor Alkali Market Revenues & Volume, By Soda Ash, 2022-2032F |
6.2 Kenya Chlor Alkali Market, By Production Process |
6.2.1 Overview and Analysis |
6.2.2 Kenya Chlor Alkali Market Revenues & Volume, By Membrane Cell, 2022-2032F |
6.2.3 Kenya Chlor Alkali Market Revenues & Volume, By Diaphragm Cell, 2022-2032F |
6.2.4 Kenya Chlor Alkali Market Revenues & Volume, By Other Production Processes, 2022-2032F |
6.3 Kenya Chlor Alkali Market, By Application |
6.3.1 Overview and Analysis |
6.3.2 Kenya Chlor Alkali Market Revenues & Volume, By Pulp and Paper, 2022-2032F |
6.3.3 Kenya Chlor Alkali Market Revenues & Volume, By Organic Chemical, 2022-2032F |
6.3.4 Kenya Chlor Alkali Market Revenues & Volume, By Inorganic Chemical, 2022-2032F |
6.3.5 Kenya Chlor Alkali Market Revenues & Volume, By Soap and Detergent, 2022-2032F |
6.3.6 Kenya Chlor Alkali Market Revenues & Volume, By Alumina, 2022-2032F |
6.3.7 Kenya Chlor Alkali Market Revenues & Volume, By Textile, 2022-2032F |
7 Kenya Chlor Alkali Market Import-Export Trade Statistics |
7.1 Kenya Chlor Alkali Market Export to Major Countries |
7.2 Kenya Chlor Alkali Market Imports from Major Countries |
8 Kenya Chlor Alkali Market Key Performance Indicators |
8.1 Energy efficiency of chlor alkali production processes. |
8.2 Percentage of market penetration in key industries. |
8.3 Level of investment in research and development for product innovation. |
8.4 Compliance with environmental regulations and sustainability practices. |
8.5 Customer satisfaction and retention rates. |
9 Kenya Chlor Alkali Market - Opportunity Assessment |
9.1 Kenya Chlor Alkali Market Opportunity Assessment, By Product, 2022 & 2032F |
9.2 Kenya Chlor Alkali Market Opportunity Assessment, By Production Process, 2022 & 2032F |
9.3 Kenya Chlor Alkali Market Opportunity Assessment, By Application, 2022 & 2032F |
10 Kenya Chlor Alkali Market - Competitive Landscape |
10.1 Kenya Chlor Alkali Market Revenue Share, By Companies, 2025 |
10.2 Kenya Chlor Alkali Market Competitive Benchmarking, By Operating and Technical Parameters |
11 Company Profiles |
12 Recommendations |
13 Disclaimer |
Global Go To Market Strategy - 2030
Export potential enables firms to identify high-growth global markets with greater confidence by combining advanced trade intelligence with a structured quantitative methodology. The framework analyzes emerging demand trends and country-level import patterns while integrating macroeconomic and trade datasets such as GDP and population forecasts, bilateral import–export flows, tariff structures, elasticity differentials between developed and developing economies, geographic distance, and import demand projections. Using weighted trade values from 2020–2024 as the base period to project country-to-country export potential for 2030, these inputs are operationalized through calculated drivers such as gravity model parameters, tariff impact factors, and projected GDP per-capita growth. Through an analysis of hidden potentials, demand hotspots, and market conditions that are most favorable to success, this method enables firms to focus on target countries, maximize returns, and global expansion with data, backed by accuracy.
By factoring in the projected importer demand gap that is currently unmet and could be potential opportunity, it identifies the potential for the Exporter (Country) among 190 countries, against the general trade analysis, which identifies the biggest importer or exporter.
To discover high-growth global markets and optimize your business strategy:
Click Here
Pricing
- Single User License$ 1,995
- Department License$ 2,400
- Site License$ 3,120
- Global License$ 3,795

Leadership Perspectives from Industry Events
Search
Thought Leadership and Analyst Meet


Our Clients
6WResearch In News
- India Air Conditioner Market Set for Strong Rebound in 2026 After Weather-Led Correction and GST-Driven Recovery: 6Wresearch
- ADAS in India: How Automatic Emergency Braking, Blind Spot Detection & Driver Monitoring are Transforming Road Safety
- Doha a strategic location for EV manufacturing hub: IPA Qatar
- Demand for luxury TVs surging in the GCC, says Samsung
- Empowering Growth: The Thriving Journey of Bangladesh’s Cable Industry
- Demand for luxury TVs surging in the GCC, says Samsung
Latest Reports
- Poland Fire Protection Systems Market (2026-2032)
- Cape Verde Portable Hand-Thrown Extinguisher Market (2026-2032)
- Canada Portable Hand-Thrown Extinguisher Market (2026-2032)
- Cameroon Portable Hand-Thrown Extinguisher Market (2026-2032)
- Burundi Portable Hand-Thrown Extinguisher Market (2026-2032)
- Burkina Faso Portable Hand-Thrown Extinguisher Market (2026-2032)
- Bulgaria Portable Hand-Thrown Extinguisher Market (2026-2032)
- Brunei Portable Hand-Thrown Extinguisher Market (2026-2032)
- Botswana Portable Hand-Thrown Extinguisher Market (2026-2032)
- Bosnia and Herzegovina Portable Hand-Thrown Extinguisher Market (2026-2032)
Industry Events and Analyst Meet

HIMTEX 2026

India Refining Summit 2026

India EV Show 2026

EV tech India Expo 2026

Auto Tech Asia 2026
Whitepaper
- Middle East & Africa Commercial Security Market Click here to view more.
- Middle East & Africa Fire Safety Systems & Equipment Market Click here to view more.
- GCC Drone Market Click here to view more.
- Middle East Lighting Fixture Market Click here to view more.
- GCC Physical & Perimeter Security Market Click here to view more.