Kenya Chromium Oxide Market (2026-2032) Outlook | Size, Revenue, Share, Analysis, Industry, Trends, Forecast, Companies, Growth & Value
Market Forecast By Form (Powder, Pellets, Pieces, Others), By Grade (Pigment grade, Refractory grade, Metallurgy grade, Abrasive grade, Others), By Application (Glass, Inks, Paints and coatings, Others) And Competitive Landscape
| Product Code: ETC087729 | Publication Date: Jun 2021 | Updated Date: Jun 2026 | Product Type: Report | |
| Publisher: 6Wresearch | Author: Sachin Kumar Rai | No. of Pages: 70 | No. of Figures: 35 | No. of Tables: 5 |
Kenya Chromium Oxide Market Size, Share & Growth Rate
The Kenya Chromium Oxide Market was estimated at USD 429 Million in 2025 and is projected to reach USD 626 Million by 2032, growing at a CAGR of 5.5% from 2026 to 2032. This growth trajectory is significantly influenced by the rising demand for chromium oxide across diverse industries, notably in paints, coatings, and ceramics. As construction activities ramp up, chromium oxide has become an essential component for producing durable materials, particularly in infrastructural developments.
Kenya Chromium Oxide Market Growth Rate Analysis (2021-2032)
The Kenya Chromium Oxide market has demonstrated stable growth, with rates fluctuating between 6.2% and 6.8% from 2021 to 2032. Factors driving this growth include significant investments in infrastructure and an expanding industrial base, particularly in stainless steel production and ceramics. In 2022, a notable 6.8% increase can be attributed to rising consumer demand for high-quality coatings and pigments, alongside technological advancements that enhance production efficiency. A slight dip to 6.2% in 2028 reflects temporary market pressures, likely due to global supply chain disruptions. However, by 2029, the market rebounces to 6.8%, underscoring a resilient recovery fueled by sustained investments in energy transition and digitalization initiatives.
Kenya Chromium Oxide Market Year-wise Growth Rate and Key Drivers
This graph highlights how the Kenya Chromium Oxide Market has steadily grown over the past five years, supported by major growth factors.
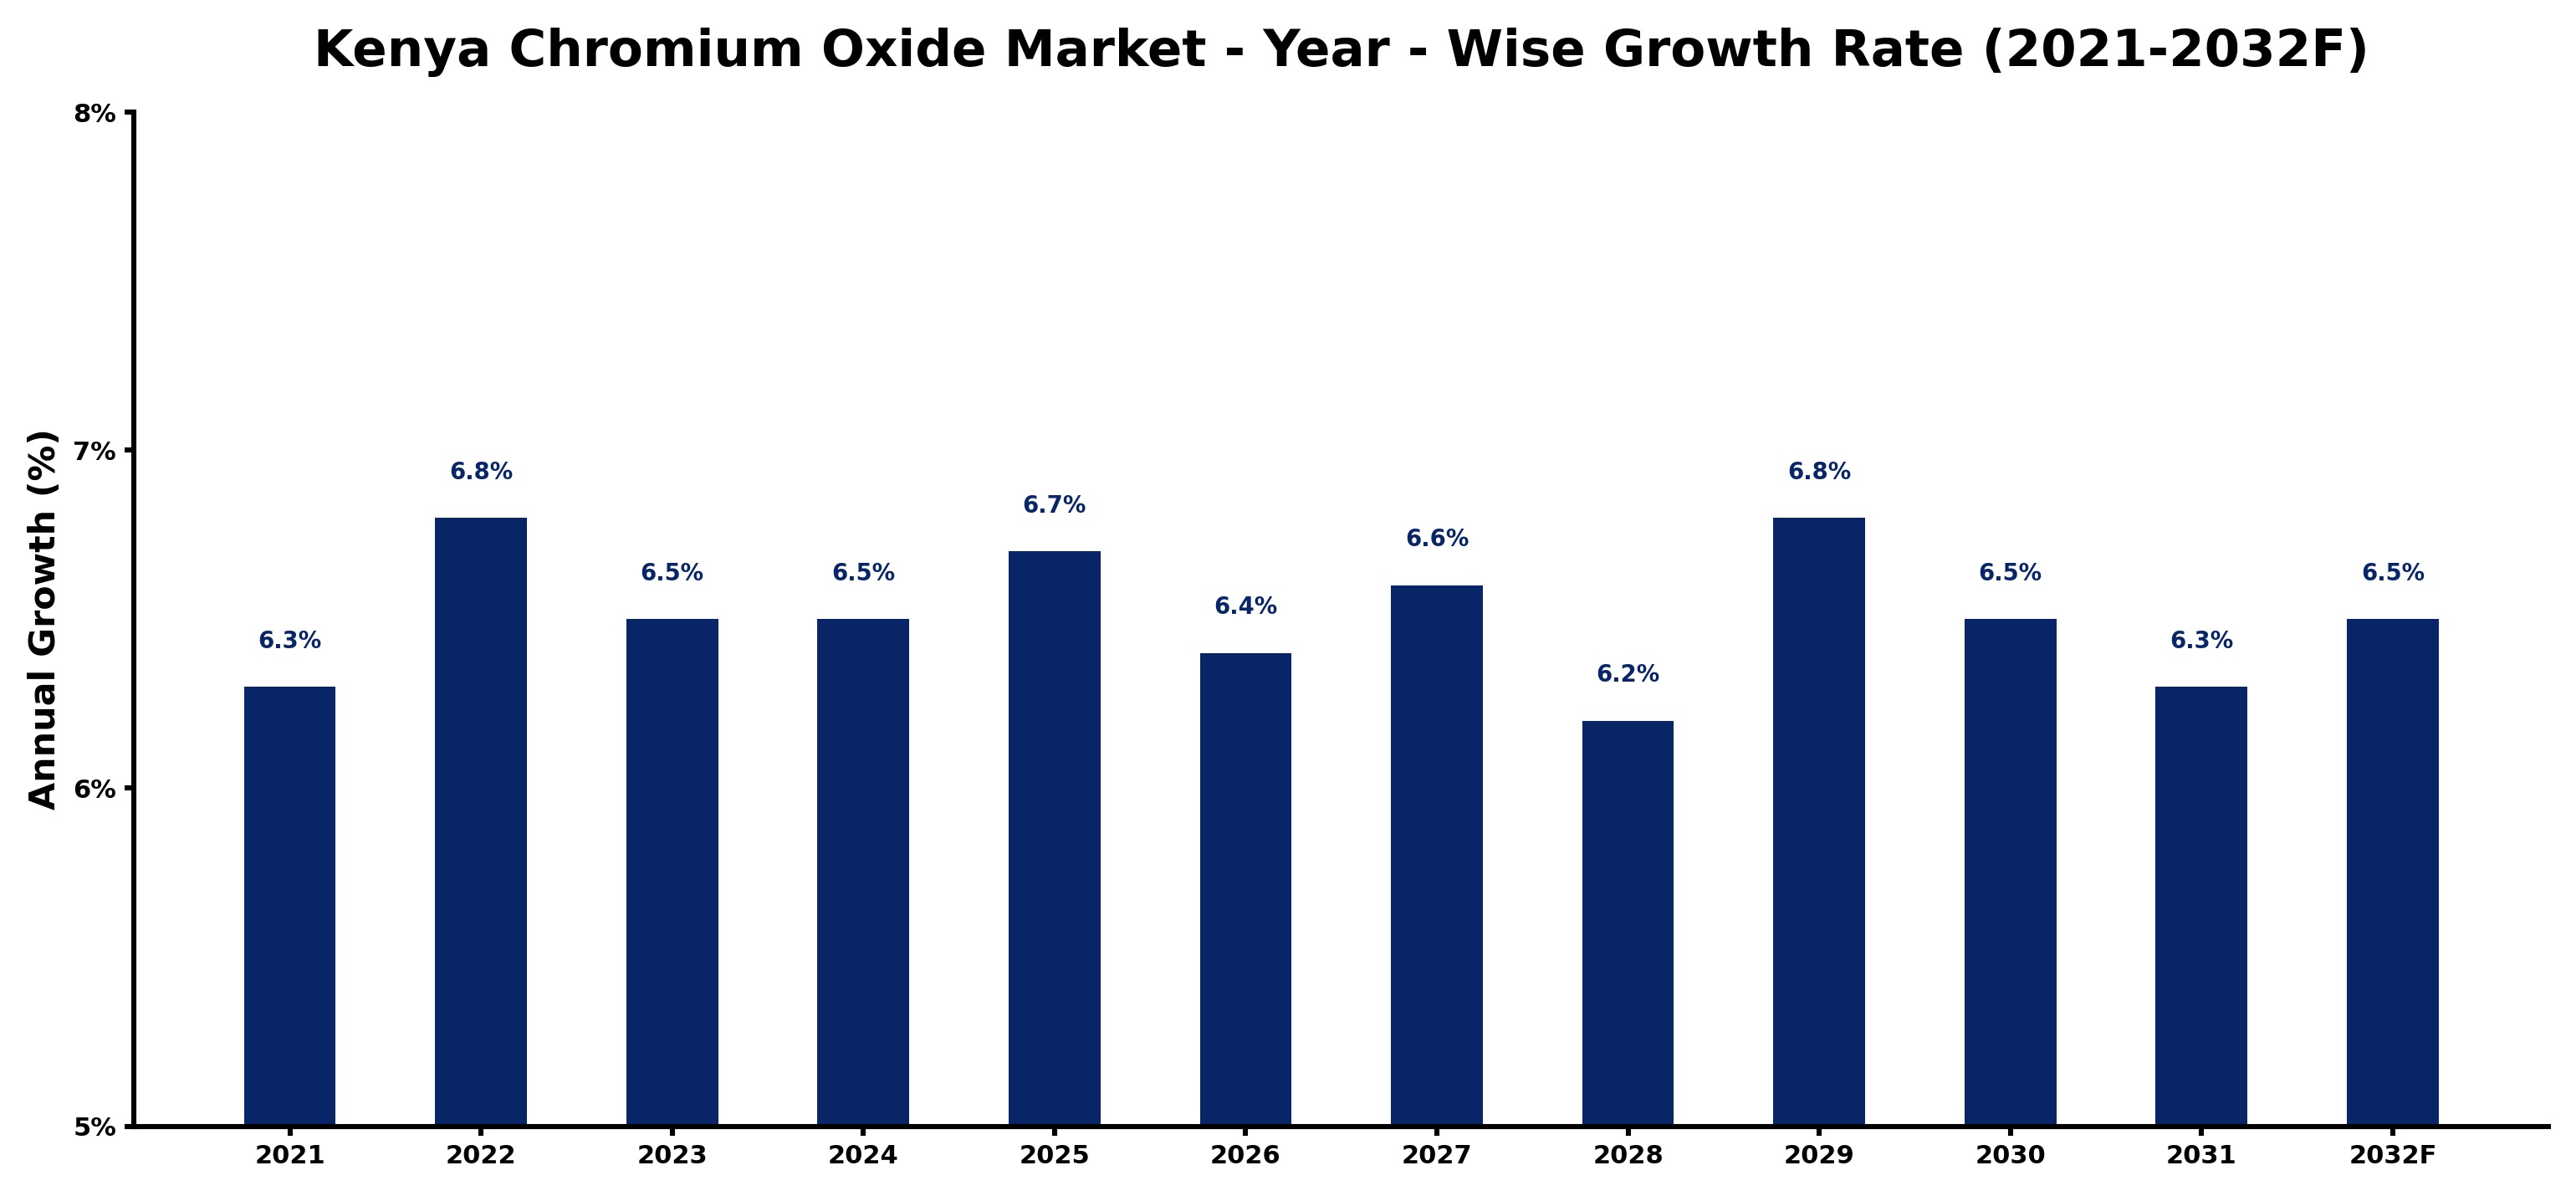
The table below presents the year‑wise growth rates along with the key drivers influencing the market
| Year | Growth Rate | Major Drivers |
| 2021 | 6.3% | Growing renewable energy integration projects |
| 2022 | 6.8% | Rapid growth in telecom and data center sectors |
| 2023 | 6.5% | Expansion of commercial construction activities |
| 2024 | 6.5% | Increasing smart city development projects |
| 2025 | 6.7% | Increasing smart city development projects |
| 2026 | 6.4% | Increasing smart city development projects |
| 2027 | 6.6% | Rapid growth in telecom and data center sectors |
| 2028 | 6.2% | Rapid growth in telecom and data center sectors |
| 2029 | 6.8% | Increasing industrial automation investments |
| 2030 | 6.5% | Growing urbanization and commercial development |
| 2031 | 6.3% | Expansion of transportation and logistics networks |
| 2032 | 6.5% | Increasing smart city development projects |
Note - Market size estimations and growth projections presented in this report are based on 6Wresearch’s advanced forecasting approach, validated with industry datasets as of June 2026.
Kenya Chromium Oxide Market Synopsis
The Kenya Chromium Oxide market is currently experiencing robust growth, propelled by an increasing focus on environmentally friendly products. Local manufacturers and international players alike are tapping into the market potential, driven by the expanding automotive and construction sectors. The compound’s unique properties, particularly its corrosion resistance and durability, make it increasingly valuable in the region.
Moreover, the shift towards sustainable manufacturing practices is creating fresh opportunities for chromium oxide, particularly in pigment production. This growing awareness among consumers about the benefits of non-toxic and sustainable materials is shaping a more dynamic landscape for the market, setting the stage for future growth.
Kenya Chromium Oxide Market Key Takeaways
- Increasing demand from the automotive, ceramics, and paints industries is driving market growth.
- The construction sector is a major consumer of chromium oxide, significantly impacting its demand.
- There is a noticeable trend towards sustainable and non-toxic chromium oxide pigments.
- Challenges such as fluctuating raw material prices and competition from imports persist.
- Government policies are focused on environmental sustainability and promoting local production.
Evaluation of Restraints in Kenya Chromium Oxide Market
Despite its growth potential, the Kenya Chromium Oxide market faces several significant challenges. Limited access to local raw materials constrains production capabilities, pushing manufacturers towards dependency on imports, which can be unreliable and influenced by global market fluctuations. Additionally, the volatility of chromium ore prices can affect the overall production costs, further complicating market stability. These factors create a challenging landscape for local producers, who must continuously adapt to remain competitive.
Kenya Chromium Oxide Market Trends
A growing trend within the Kenya Chromium Oxide market is the focus on eco-friendly and sustainable products. Manufacturers are increasingly prioritizing innovation in product formulations to align with global standards for environmental safety. Additionally, advancements in technology are driving efficiency in production processes, enabling better quality control and reduced waste. This dynamic is enhancing the attractiveness of chromium oxide as a raw material across various applications.
Kenya Chromium Oxide Market Opportunities
The Kenya Chromium Oxide market offers substantial investment opportunities, particularly for entities looking to establish production facilities locally. Given the country's status as a leading producer of chromium ore, there is potential for domestic manufacturers to increase their output and cater to both local and export markets. Furthermore, the surge in construction activity presents avenues for innovative applications of chromium oxide, especially in producing weather-resistant materials and colorants.
Government Initiatives in the Kenya Chromium Oxide Market
The Kenyan government has been proactive in implementing regulations and policies aimed at fostering a sustainable chromium oxide market. The Kenya Environmental Management and Coordination Act mandates environmental impact assessments for mining activities, ensuring that operations do not harm natural resources. Additionally, policies promoting local beneficiation encourage value addition within the country, bolstering economic development and creating job opportunities in the sector.
Future Insights of the Kenya Chromium Oxide Market
Looking ahead to 2026-2032, the outlook for the Kenya Chromium Oxide market remains positive. The anticipated growth in construction and automotive sectors will continue to drive demand, particularly for applications involving pigments and durable materials. Furthermore, the increasing emphasis on environmentally friendly manufacturing practices is expected to open new avenues for growth, encouraging strategic partnerships and investments in research and development to innovate and diversify product offerings.
Kenya Chromium Oxide Market Latest Developments (May 2025 - June 2026)
Recent developments within the Kenya Chromium Oxide market indicate a strong push towards enhancing local production capabilities. Various stakeholders are exploring collaborative ventures aimed at boosting manufacturing efficiencies and reducing dependency on imports. Innovations in product applications are also gaining traction, with ongoing research focused on expanding the use of chromium oxide in new sectors, further diversifying its market presence.
Kenya Chromium Oxide Market - Key Attractiveness of the Report
- 10 Years of Market Numbers
- Historical Data Starting from 2022 to 2025
- Base Year: 2025
- Forecast Data until 2032
- Key Performance Indicators Impacting the Market
- Major Upcoming Developments and Projects
Key Highlights of the Report:
- Kenya Chromium Oxide Market Outlook
- Market Size of Kenya Chromium Oxide Market, 2025
- Forecast of Kenya Chromium Oxide Market, 2032
- Historical Data and Forecast of Kenya Chromium Oxide Revenues & Volume for the Period 2022-2032F
- Kenya Chromium Oxide Market Trend Evolution
- Kenya Chromium Oxide Market Drivers and Challenges
- Kenya Chromium Oxide Price Trends
- Kenya Chromium Oxide Porter's Five Forces
- Kenya Chromium Oxide Industry Life Cycle
- Historical Data and Forecast of Kenya Chromium Oxide Market Revenues & Volume By Form for the Period 2022-2032F
- Historical Data and Forecast of Kenya Chromium Oxide Market Revenues & Volume By Powder for the Period 2022-2032F
- Historical Data and Forecast of Kenya Chromium Oxide Market Revenues & Volume By Pellets for the Period 2022-2032F
- Historical Data and Forecast of Kenya Chromium Oxide Market Revenues & Volume By Pieces for the Period 2022-2032F
- Historical Data and Forecast of Kenya Chromium Oxide Market Revenues & Volume By Others for the Period 2022-2032F
- Historical Data and Forecast of Kenya Chromium Oxide Market Revenues & Volume By Grade for the Period 2022-2032F
- Historical Data and Forecast of Kenya Chromium Oxide Market Revenues & Volume By Pigment grade for the Period 2022-2032F
- Historical Data and Forecast of Kenya Chromium Oxide Market Revenues & Volume By Refractory grade for the Period 2022-2032F
- Historical Data and Forecast of Kenya Chromium Oxide Market Revenues & Volume By Metallurgy grade for the Period 2022-2032F
- Historical Data and Forecast of Kenya Chromium Oxide Market Revenues & Volume By Abrasive grade for the Period 2022-2032F
- Historical Data and Forecast of Kenya Chromium Oxide Market Revenues & Volume By Others for the Period 2022-2032F
- Historical Data and Forecast of Kenya Chromium Oxide Market Revenues & Volume By Application for the Period 2022-2032F
- Historical Data and Forecast of Kenya Chromium Oxide Market Revenues & Volume By Glass for the Period 2022-2032F
- Historical Data and Forecast of Kenya Chromium Oxide Market Revenues & Volume By Inks for the Period 2022-2032F
- Historical Data and Forecast of Kenya Chromium Oxide Market Revenues & Volume By Paints and coatings for the Period 2022-2032F
- Historical Data and Forecast of Kenya Chromium Oxide Market Revenues & Volume By Others for the Period 2022-2032F
- Kenya Chromium Oxide Import Export Trade Statistics
- Market Opportunity Assessment By Form
- Market Opportunity Assessment By Grade
- Market Opportunity Assessment By Application
- Kenya Chromium Oxide Top Companies Market Share
- Kenya Chromium Oxide Competitive Benchmarking By Technical and Operational Parameters
- Kenya Chromium Oxide Company Profiles
- Kenya Chromium Oxide Key Strategic Recommendations
Kenya Chromium Oxide Market - Frequently Asked Questions
The automotive, paints and coatings, ceramics, and textiles industries are the main drivers of demand for chromium oxide in Kenya.
The growth of the construction sector significantly boosts the demand for chromium oxide, as it is used in applications such as concrete coloring and surface treatments.
The Kenya Chromium Oxide Market was estimated at USD 429 Million in 2025, and it is projected to reach USD 626 Million by 2032, growing at a CAGR of 5.5% from 2026 to 2032.
Yes, the Kenyan government has implemented policies promoting environmental sustainability and local beneficiation, encouraging responsible extraction and processing of chromium oxide.
Local manufacturers struggle with limited availability of raw materials, volatile chromium ore prices, and competition from imported products that may be perceived as higher quality.
6Wresearch actively monitors the Kenya Chromium Oxide Market and publishes its comprehensive annual report, highlighting emerging trends, growth drivers, revenue analysis, and forecast outlook. Our insights help businesses to make data-backed strategic decisions with ongoing market dynamics. Our analysts track relevent industries related to the Kenya Chromium Oxide Market, allowing our clients with actionable intelligence and reliable forecasts tailored to emerging regional needs.
Yes, we provide customisation as per your requirements. To learn more, feel free to contact us on sales@6wresearch.com
1 Executive Summary |
2 Introduction |
2.1 Key Highlights of the Report |
2.2 Report Description |
2.3 Market Scope & Segmentation |
2.4 Research Methodology |
2.5 Assumptions |
3 Kenya Chromium Oxide Market Overview |
3.1 Kenya Country Macro Economic Indicators |
3.2 Kenya Chromium Oxide Market Revenues & Volume, 2022 & 2032F |
3.3 Kenya Chromium Oxide Market - Industry Life Cycle |
3.4 Kenya Chromium Oxide Market - Porter's Five Forces |
3.5 Kenya Chromium Oxide Market Revenues & Volume Share, By Form, 2022 & 2032F |
3.6 Kenya Chromium Oxide Market Revenues & Volume Share, By Grade, 2022 & 2032F |
3.7 Kenya Chromium Oxide Market Revenues & Volume Share, By Form, 2022 & 2032F |
4 Kenya Chromium Oxide Market Dynamics |
4.1 Impact Analysis |
4.2 Market Drivers |
4.3 Market Restraints |
5 Kenya Chromium Oxide Market Trends |
6 Kenya Chromium Oxide Market, By Types |
6.1 Kenya Chromium Oxide Market, By Form |
6.1.1 Overview and Analysis |
6.1.2 Kenya Chromium Oxide Market Revenues & Volume, By Form, 2022-2032F |
6.1.3 Kenya Chromium Oxide Market Revenues & Volume, By Powder, 2022-2032F |
6.1.4 Kenya Chromium Oxide Market Revenues & Volume, By Pellets, 2022-2032F |
6.1.5 Kenya Chromium Oxide Market Revenues & Volume, By Pieces, 2022-2032F |
6.1.6 Kenya Chromium Oxide Market Revenues & Volume, By Others, 2022-2032F |
6.2 Kenya Chromium Oxide Market, By Grade |
6.2.1 Overview and Analysis |
6.2.2 Kenya Chromium Oxide Market Revenues & Volume, By Pigment grade, 2022-2032F |
6.2.3 Kenya Chromium Oxide Market Revenues & Volume, By Refractory grade, 2022-2032F |
6.2.4 Kenya Chromium Oxide Market Revenues & Volume, By Metallurgy grade, 2022-2032F |
6.2.5 Kenya Chromium Oxide Market Revenues & Volume, By Abrasive grade, 2022-2032F |
6.2.6 Kenya Chromium Oxide Market Revenues & Volume, By Others, 2022-2032F |
6.3 Kenya Chromium Oxide Market, By Application |
6.3.1 Overview and Analysis |
6.3.2 Kenya Chromium Oxide Market Revenues & Volume, By Glass, 2022-2032F |
6.3.3 Kenya Chromium Oxide Market Revenues & Volume, By Inks, 2022-2032F |
6.3.4 Kenya Chromium Oxide Market Revenues & Volume, By Paints and coatings, 2022-2032F |
6.3.5 Kenya Chromium Oxide Market Revenues & Volume, By Others, 2022-2032F |
7 Kenya Chromium Oxide Market Import-Export Trade Statistics |
7.1 Kenya Chromium Oxide Market Export to Major Countries |
7.2 Kenya Chromium Oxide Market Imports from Major Countries |
8 Kenya Chromium Oxide Market Key Performance Indicators |
9 Kenya Chromium Oxide Market - Opportunity Assessment |
9.1 Kenya Chromium Oxide Market Opportunity Assessment, By Form, 2022 & 2032F |
9.2 Kenya Chromium Oxide Market Opportunity Assessment, By Grade, 2022 & 2032F |
9.3 Kenya Chromium Oxide Market Opportunity Assessment, By Application, 2022 & 2032F |
10 Kenya Chromium Oxide Market - Competitive Landscape |
10.1 Kenya Chromium Oxide Market Revenue Share, By Companies, 2025 |
10.2 Kenya Chromium Oxide Market Competitive Benchmarking, By Operating and Technical Parameters |
11 Company Profiles |
12 Recommendations |
13 Disclaimer |
Global Go To Market Strategy - 2030
Export potential enables firms to identify high-growth global markets with greater confidence by combining advanced trade intelligence with a structured quantitative methodology. The framework analyzes emerging demand trends and country-level import patterns while integrating macroeconomic and trade datasets such as GDP and population forecasts, bilateral import–export flows, tariff structures, elasticity differentials between developed and developing economies, geographic distance, and import demand projections. Using weighted trade values from 2020–2024 as the base period to project country-to-country export potential for 2030, these inputs are operationalized through calculated drivers such as gravity model parameters, tariff impact factors, and projected GDP per-capita growth. Through an analysis of hidden potentials, demand hotspots, and market conditions that are most favorable to success, this method enables firms to focus on target countries, maximize returns, and global expansion with data, backed by accuracy.
By factoring in the projected importer demand gap that is currently unmet and could be potential opportunity, it identifies the potential for the Exporter (Country) among 190 countries, against the general trade analysis, which identifies the biggest importer or exporter.
To discover high-growth global markets and optimize your business strategy:
Click Here
Pricing
- Single User License$ 1,995
- Department License$ 2,400
- Site License$ 3,120
- Global License$ 3,795

Leadership Perspectives from Industry Events
Search
Thought Leadership and Analyst Meet


Our Clients
6WResearch In News
- India Air Conditioner Market Set for Strong Rebound in 2026 After Weather-Led Correction and GST-Driven Recovery: 6Wresearch
- ADAS in India: How Automatic Emergency Braking, Blind Spot Detection & Driver Monitoring are Transforming Road Safety
- Doha a strategic location for EV manufacturing hub: IPA Qatar
- Demand for luxury TVs surging in the GCC, says Samsung
- Empowering Growth: The Thriving Journey of Bangladesh’s Cable Industry
- Demand for luxury TVs surging in the GCC, says Samsung
Latest Reports
- Poland Fire Protection Systems Market (2026-2032)
- Cape Verde Portable Hand-Thrown Extinguisher Market (2026-2032)
- Canada Portable Hand-Thrown Extinguisher Market (2026-2032)
- Cameroon Portable Hand-Thrown Extinguisher Market (2026-2032)
- Burundi Portable Hand-Thrown Extinguisher Market (2026-2032)
- Burkina Faso Portable Hand-Thrown Extinguisher Market (2026-2032)
- Bulgaria Portable Hand-Thrown Extinguisher Market (2026-2032)
- Brunei Portable Hand-Thrown Extinguisher Market (2026-2032)
- Botswana Portable Hand-Thrown Extinguisher Market (2026-2032)
- Bosnia and Herzegovina Portable Hand-Thrown Extinguisher Market (2026-2032)
Industry Events and Analyst Meet

HIMTEX 2026

India Refining Summit 2026

India EV Show 2026

EV tech India Expo 2026

Auto Tech Asia 2026
Whitepaper
- Middle East & Africa Commercial Security Market Click here to view more.
- Middle East & Africa Fire Safety Systems & Equipment Market Click here to view more.
- GCC Drone Market Click here to view more.
- Middle East Lighting Fixture Market Click here to view more.
- GCC Physical & Perimeter Security Market Click here to view more.