Kenya Drive Shaft Market (2026-2032) | Industry, Revenue, Analysis, Share, Trends, Value, Growth, Outlook, Companies, Size & Forecast
Market Forecast By Shaft Type (Torque Tube Drive Shaft, Flexible Drive Shaft, Hotchkiss Drive Shaft), By Material Types (Steel, Aluminum, Other), By Design Type (Hollow Drive Shafts, Solid Drive Shafts), By Position (Rear Wheel Drive Shaft, Front Wheel Drive Shaft), By Vehicle Type (Light Commercial Vehicle, Passenger Cars, Heavy Commercial Vehicles) And Competitive Landscape
| Product Code: ETC046950 | Publication Date: Jan 2021 | Updated Date: Jun 2026 | Product Type: Report | |
| Publisher: 6Wresearch | Author: Dhaval Chaurasia | No. of Pages: 70 | No. of Figures: 35 | No. of Tables: 5 |
Kenya Drive Shaft Market Size, Share & Growth Rate
The Kenya Drive Shaft Market was estimated at USD 867 Million in 2025 and is projected to reach USD 1239 Million by 2032, growing at a CAGR of 5.2% from 2026 to 2032. This growth is largely attributed to the robust expansion of the automotive industry in Kenya, driven by rising vehicle sales and infrastructure development. Additionally, the increasing preference for off-road vehicles and the growing construction and mining sectors are significant factors contributing to this positive market trajectory.
Kenya Drive Shaft Market Growth Rate Analysis (2021-2032)
The Kenya Drive Shaft market is anticipated to experience steady growth, highlighted by a 6.5% increase in 2023, following a 6.1% growth in 2022. This continuous rise can be attributed to expanding industrial activity and increased demand from the automotive sector, driven by investments in local manufacturing capacities. The growth trajectory remains robust, with projected rates around 6.0% to 6.4% from 2024 to 2028, reflecting a stable business environment supported by favorable policies and infrastructure developments. However, a slight dip to 5.8% in 2026 suggests potential market saturation, with consumer demand stabilizing. Overall, the outlook remains optimistic, fueled by ongoing energy transition initiatives and digitalization in manufacturing processes.
Kenya Drive Shaft Market Year-wise Growth Rate and Key Drivers
This graph highlights how the Kenya Drive Shaft Market has steadily grown over the past five years, supported by major growth factors.
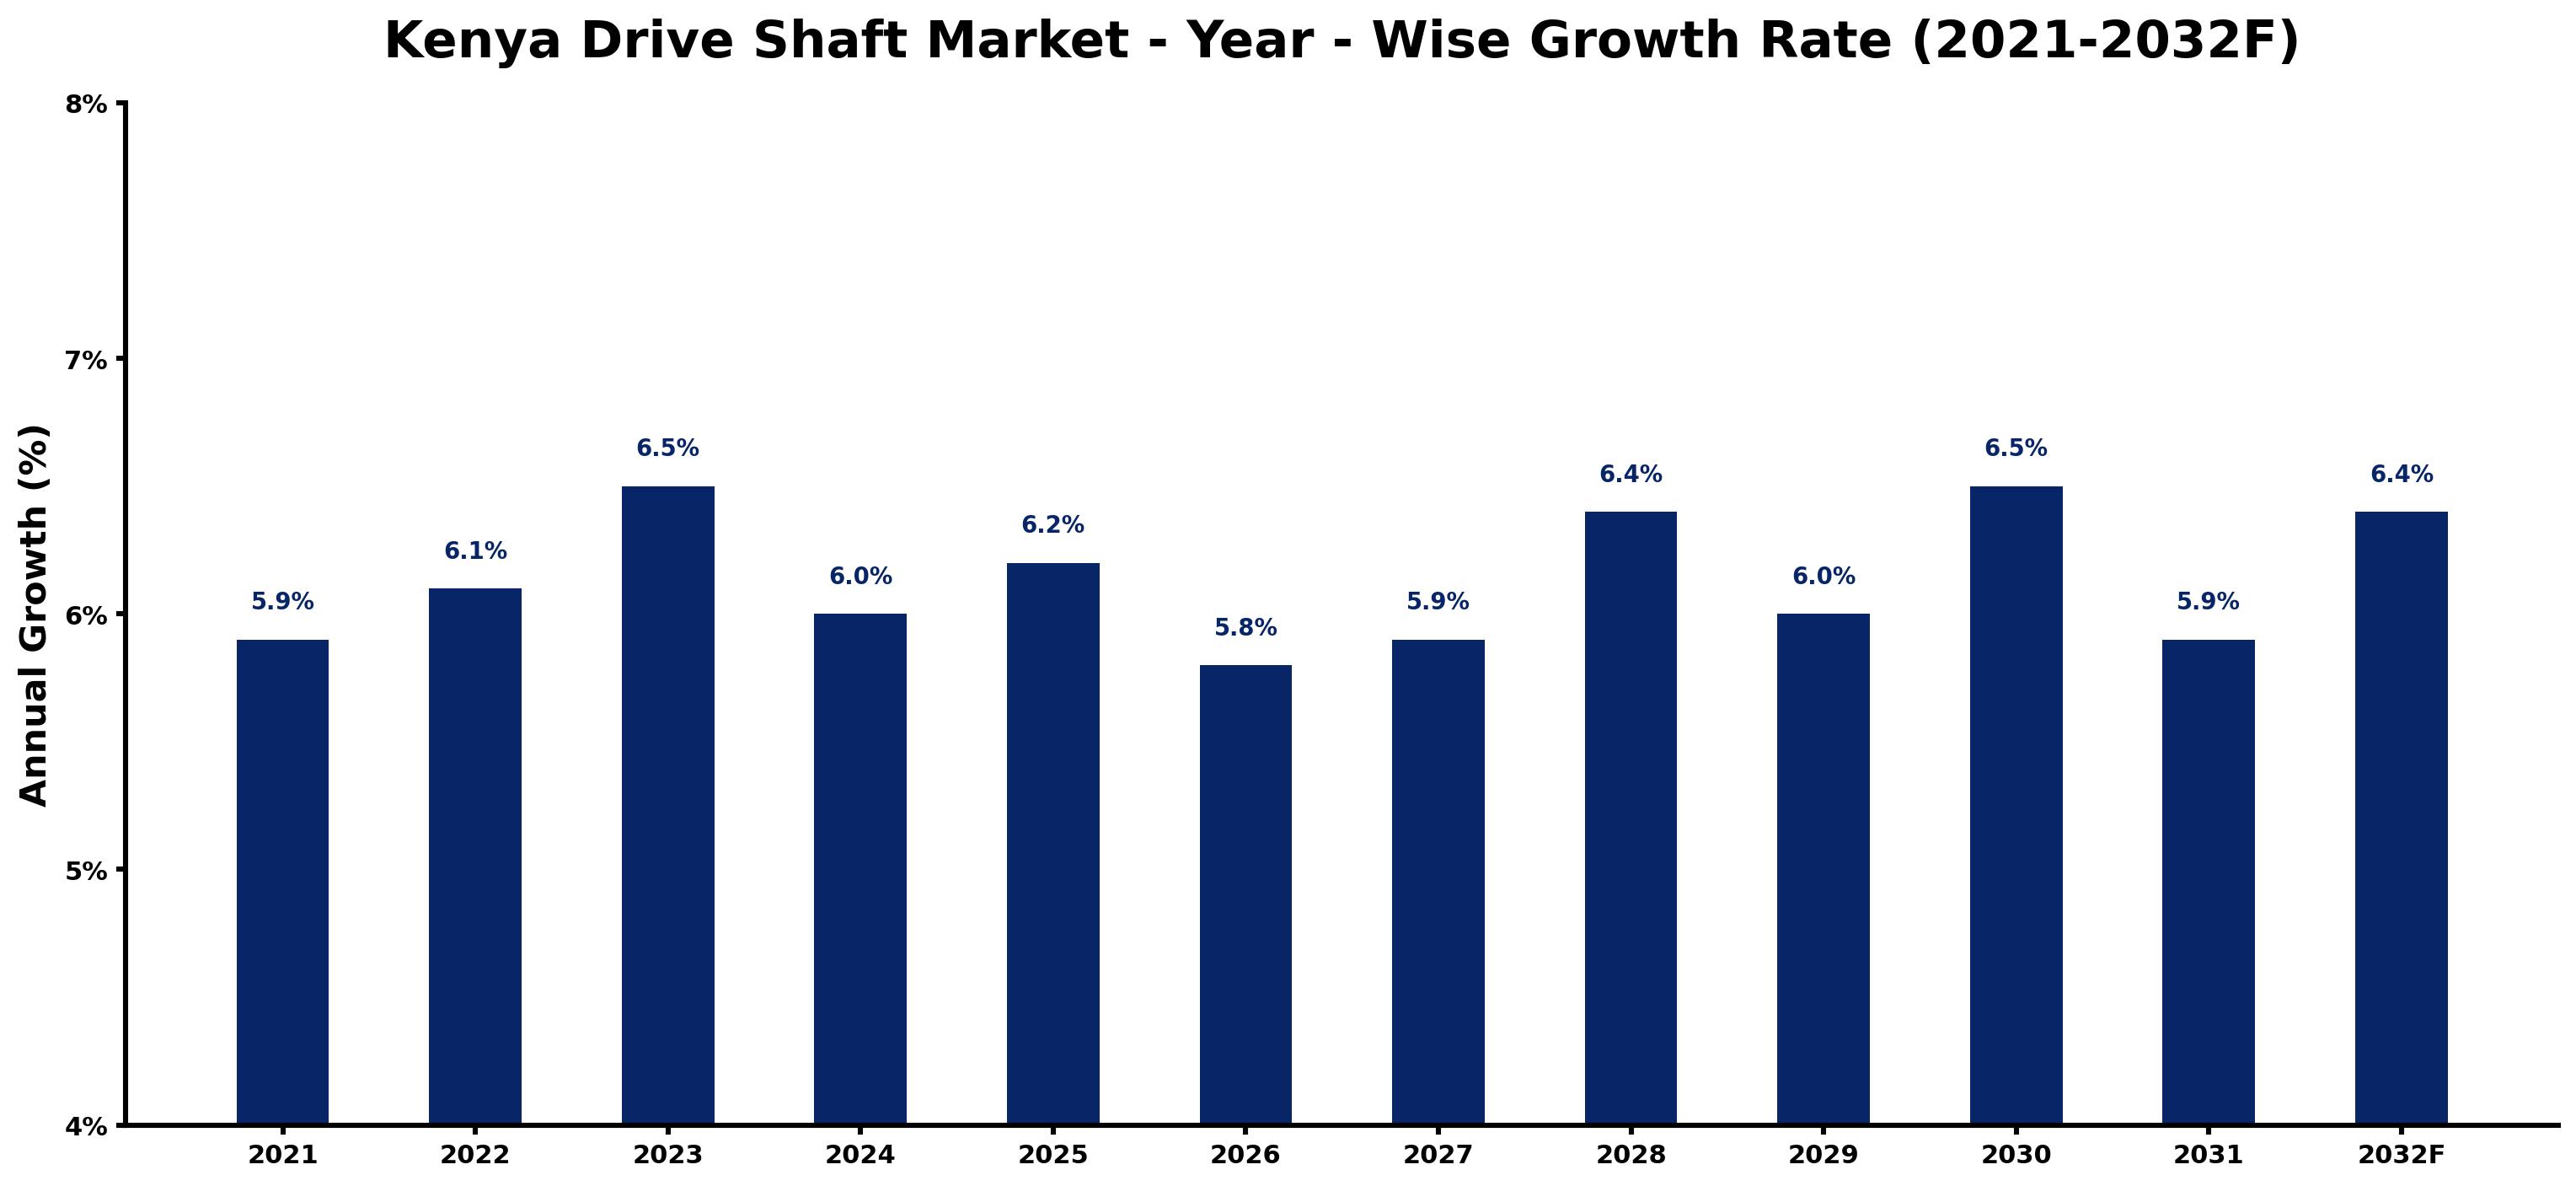
The table below presents the year‑wise growth rates along with the key drivers influencing the market
| Year | Growth Rate | Major Drivers |
| 2021 | 5.9% | Increasing smart city development projects |
| 2022 | 6.1% | Expansion of transportation and logistics networks |
| 2023 | 6.5% | Expansion of commercial construction activities |
| 2024 | 6.0% | Growing urbanization and commercial development |
| 2025 | 6.2% | Increasing adoption of advanced technologies |
| 2026 | 5.8% | Expansion of manufacturing activities |
| 2027 | 5.9% | Government infrastructure modernization initiatives |
| 2028 | 6.4% | Rising electricity demand across industries |
| 2029 | 6.0% | Government infrastructure modernization initiatives |
| 2030 | 6.5% | Increasing smart city development projects |
| 2031 | 5.9% | Rising electricity demand across industries |
| 2032 | 6.4% | Expansion of transportation and logistics networks |
Note - Market size estimations and growth projections presented in this report are based on 6Wresearch’s advanced forecasting approach, validated with industry datasets as of June 2026.
Kenya Drive Shaft Market Synopsis
In recent years, the Kenya drive shaft market has experienced substantial momentum, fueled by a rising middle class and improved transportation networks. This growth is expected to continue as local manufacturing capabilities expand and investments in the automotive sector increase.
Looking ahead, the market is poised for further growth as the government emphasizes industrialization and manufacturing. However, the influx of counterfeit products and inconsistent quality standards may present hurdles that require strategic interventions.
Kenya Drive Shaft Market Key Takeaways
- Growing automotive sector spurs demand for drive shafts, both for passenger and commercial vehicles.
- Emerging trends in lightweight materials and advanced manufacturing techniques are shaping product development.
- Government initiatives support local manufacturing, enhancing market growth potential.
- Investment opportunities are ripe, particularly in the construction and mining sectors.
- Challenges from fluctuating raw material prices and competition from global players persist.
Evaluation of Restraints in Kenya Drive Shaft Market
The Kenya drive shaft market faces several substantial restraints that could impede its growth trajectory. Notably, the lack of standardized regulations and quality control measures creates inconsistencies in product quality, which can erode consumer trust. Furthermore, counterfeit products proliferate in the market, posing risks not just to consumers, but also to legitimate businesses striving to maintain high standards. Additionally, access to advanced manufacturing technologies remains limited, and skills shortages in the workforce further complicate the operational landscape. These factors, combined with the volatility in raw material prices and foreign exchange rates, create a challenging environment that necessitates strategic focus for manufacturers aiming to thrive.
Kenya Drive Shaft Market Trends
Several key trends are emerging within the Kenya drive shaft market. Manufacturers are increasingly focused on the development of lightweight and durable materials, such as carbon fiber, to enhance fuel efficiency and minimize emissions. This shift toward sustainable practices is also mirrored in a growing emphasis on the use of eco-friendly materials throughout the production process. Additionally, the expansion of transportation networks is further driving the demand for advanced drive shaft technologies, catering to an evolving automotive landscape that increasingly prioritizes efficiency and sustainability.
Kenya Drive Shaft Market Opportunities
The Kenya drive shaft market presents numerous investment opportunities as the country’s automotive industry continues to flourish. With an expanding middle class and government backing for local manufacturing, there is a heightened demand for commercial vehicles and passenger cars. Potential investors can capitalize on this trend by engaging with drive shaft manufacturing enterprises or forging partnerships with local automotive producers. Furthermore, the construction and mining sectors, which require a substantial number of vehicles equipped with drive shafts, offer additional avenues for investment and expansion.
Government Initiatives in the Kenya Drive Shaft Market
The Kenya Drive Shaft Market operates within a framework of supportive government policies aimed at regulating production standards and fostering local industry growth. The Kenya Bureau of Standards (KEBS) plays a pivotal role in certifying drive shafts, ensuring adherence to quality and safety standards. Moreover, various incentives are in place to encourage local production, such as preferential procurement policies for domestically manufactured products. Trade policies designed to shield local industries from international competition further contribute to a conducive environment for market expansion.
Future Insights of the Kenya Drive Shaft Market
Looking ahead to 2026-2032, the Kenya drive shaft market is poised for continued growth, bolstered by an anticipated increase in automotive production and sales. The expansion of transportation infrastructure and government initiatives promoting local manufacturing will further stimulate demand. A growing preference for off-road vehicles is likely to create additional market opportunities. However, the market must navigate challenges related to raw material price fluctuations and competition from international players to fully leverage its growth potential.
Kenya Drive Shaft Market Latest Developments (May 2025 - June 2026)
Recent industry developments indicate a focused push towards technological advancements in drive shaft production. Manufacturers are investing in R&D to explore innovative materials and production methods that align with sustainability goals. Moreover, strategic collaborations among local players are emerging as a trend, aimed at enhancing market competitiveness and product offerings. As the automotive industry adapts to shifting consumer preferences, particularly towards eco-friendly options, these developments signal a progressive shift within the Kenya drive shaft market.
Kenya Drive Shaft Market - Key Attractiveness of the Report
- 10 Years of Market Numbers
- Historical Data Starting from 2022 to 2025
- Base Year: 2025
- Forecast Data until 2032
- Key Performance Indicators Impacting the Market
- Major Upcoming Developments and Projects
Key Highlights of the Report:
- Kenya Drive Shaft Market Outlook
- Market Size of Kenya Drive Shaft Market, 2025
- Forecast of Kenya Drive Shaft Market, 2032
- Historical Data and Forecast of Kenya Drive Shaft Revenues & Volume for the Period 2022-2032F
- Kenya Drive Shaft Market Trend Evolution
- Kenya Drive Shaft Market Drivers and Challenges
- Kenya Drive Shaft Price Trends
- Kenya Drive Shaft Porter's Five Forces
- Kenya Drive Shaft Industry Life Cycle
- Historical Data and Forecast of Kenya Drive Shaft Market Revenues & Volume By Shaft Type for the Period 2022-2032F
- Historical Data and Forecast of Kenya Drive Shaft Market Revenues & Volume By Torque Tube Drive Shaft for the Period 2022-2032F
- Historical Data and Forecast of Kenya Drive Shaft Market Revenues & Volume By Flexible Drive Shaft for the Period 2022-2032F
- Historical Data and Forecast of Kenya Drive Shaft Market Revenues & Volume By Hotchkiss Drive Shaft for the Period 2022-2032F
- Historical Data and Forecast of Kenya Drive Shaft Market Revenues & Volume By Material Types for the Period 2022-2032F
- Historical Data and Forecast of Kenya Drive Shaft Market Revenues & Volume By Steel for the Period 2022-2032F
- Historical Data and Forecast of Kenya Drive Shaft Market Revenues & Volume By Aluminum for the Period 2022-2032F
- Historical Data and Forecast of Kenya Drive Shaft Market Revenues & Volume By Other for the Period 2022-2032F
- Historical Data and Forecast of Kenya Drive Shaft Market Revenues & Volume By Design Type for the Period 2022-2032F
- Historical Data and Forecast of Kenya Drive Shaft Market Revenues & Volume By Hollow Drive Shafts for the Period 2022-2032F
- Historical Data and Forecast of Kenya Drive Shaft Market Revenues & Volume By Solid Drive Shafts for the Period 2022-2032F
- Historical Data and Forecast of Kenya Drive Shaft Market Revenues & Volume By Position for the Period 2022-2032F
- Historical Data and Forecast of Kenya Drive Shaft Market Revenues & Volume By Rear Wheel Drive Shaft for the Period 2022-2032F
- Historical Data and Forecast of Kenya Drive Shaft Market Revenues & Volume By Front Wheel Drive Shaft for the Period 2022-2032F
- Historical Data and Forecast of Kenya Drive Shaft Market Revenues & Volume By Vehicle Type for the Period 2022-2032F
- Historical Data and Forecast of Kenya Drive Shaft Market Revenues & Volume By Light Commercial Vehicle for the Period 2022-2032F
- Historical Data and Forecast of Kenya Drive Shaft Market Revenues & Volume By Passenger Cars for the Period 2022-2032F
- Historical Data and Forecast of Kenya Drive Shaft Market Revenues & Volume By Heavy Commercial Vehicles for the Period 2022-2032F
- Kenya Drive Shaft Import Export Trade Statistics
- Market Opportunity Assessment By Shaft Type
- Market Opportunity Assessment By Material Types
- Market Opportunity Assessment By Design Type
- Market Opportunity Assessment By Position
- Market Opportunity Assessment By Vehicle Type
- Kenya Drive Shaft Top Companies Market Share
- Kenya Drive Shaft Competitive Benchmarking By Technical and Operational Parameters
- Kenya Drive Shaft Company Profiles
- Kenya Drive Shaft Key Strategic Recommendations
Kenya Drive Shaft Market - Frequently Asked Questions
The Kenya Drive Shaft Market was estimated at USD 867 Million in 2025 and is projected to reach USD 1239 Million by 2032, growing at a CAGR of 5.2% from 2026 to 2032.
Government policies promoting local production are creating a favorable environment for manufacturers, as they encourage quality standards and reduce reliance on imports, thus boosting market growth.
Current trends include the focus on lightweight and durable materials, the integration of eco-friendly practices, and the adoption of advanced technologies like carbon fiber to enhance performance and sustainability.
Key challenges include the prevalence of counterfeit products, fluctuating raw material prices, and a lack of skilled labor, all of which can affect product quality and market competitiveness.
The surge in vehicle sales, particularly in passenger and commercial segments, is significantly driving the demand for drive shafts, making it a crucial factor for market expansion.
6Wresearch actively monitors the Kenya Drive Shaft Market and publishes its comprehensive annual report, highlighting emerging trends, growth drivers, revenue analysis, and forecast outlook. Our insights help businesses to make data-backed strategic decisions with ongoing market dynamics. Our analysts track relevent industries related to the Kenya Drive Shaft Market, allowing our clients with actionable intelligence and reliable forecasts tailored to emerging regional needs.
Yes, we provide customisation as per your requirements. To learn more, feel free to contact us on sales@6wresearch.com
1 Executive Summary |
2 Introduction |
2.1 Key Highlights of the Report |
2.2 Report Description |
2.3 Market Scope & Segmentation |
2.4 Research Methodology |
2.5 Assumptions |
3 Kenya Drive Shaft Market Overview |
3.1 Kenya Country Macro Economic Indicators |
3.2 Kenya Drive Shaft Market Revenues & Volume, 2022 & 2032F |
3.3 Kenya Drive Shaft Market - Industry Life Cycle |
3.4 Kenya Drive Shaft Market - Porter's Five Forces |
3.5 Kenya Drive Shaft Market Revenues & Volume Share, By Shaft Type, 2022 & 2032F |
3.6 Kenya Drive Shaft Market Revenues & Volume Share, By Material Types, 2022 & 2032F |
3.7 Kenya Drive Shaft Market Revenues & Volume Share, By Design Type, 2022 & 2032F |
3.8 Kenya Drive Shaft Market Revenues & Volume Share, By Position, 2022 & 2032F |
3.9 Kenya Drive Shaft Market Revenues & Volume Share, By Vehicle Type, 2022 & 2032F |
4 Kenya Drive Shaft Market Dynamics |
4.1 Impact Analysis |
4.2 Market Drivers |
4.3 Market Restraints |
5 Kenya Drive Shaft Market Trends |
6 Kenya Drive Shaft Market, By Types |
6.1 Kenya Drive Shaft Market, By Shaft Type |
6.1.1 Overview and Analysis |
6.1.2 Kenya Drive Shaft Market Revenues & Volume, By Shaft Type, 2022-2032F |
6.1.3 Kenya Drive Shaft Market Revenues & Volume, By Torque Tube Drive Shaft, 2022-2032F |
6.1.4 Kenya Drive Shaft Market Revenues & Volume, By Flexible Drive Shaft, 2022-2032F |
6.1.5 Kenya Drive Shaft Market Revenues & Volume, By Hotchkiss Drive Shaft, 2022-2032F |
6.2 Kenya Drive Shaft Market, By Material Types |
6.2.1 Overview and Analysis |
6.2.2 Kenya Drive Shaft Market Revenues & Volume, By Steel, 2022-2032F |
6.2.3 Kenya Drive Shaft Market Revenues & Volume, By Aluminum, 2022-2032F |
6.2.4 Kenya Drive Shaft Market Revenues & Volume, By Other, 2022-2032F |
6.3 Kenya Drive Shaft Market, By Design Type |
6.3.1 Overview and Analysis |
6.3.2 Kenya Drive Shaft Market Revenues & Volume, By Hollow Drive Shafts, 2022-2032F |
6.3.3 Kenya Drive Shaft Market Revenues & Volume, By Solid Drive Shafts, 2022-2032F |
6.4 Kenya Drive Shaft Market, By Position |
6.4.1 Overview and Analysis |
6.4.2 Kenya Drive Shaft Market Revenues & Volume, By Rear Wheel Drive Shaft, 2022-2032F |
6.4.3 Kenya Drive Shaft Market Revenues & Volume, By Front Wheel Drive Shaft, 2022-2032F |
6.5 Kenya Drive Shaft Market, By Vehicle Type |
6.5.1 Overview and Analysis |
6.5.2 Kenya Drive Shaft Market Revenues & Volume, By Light Commercial Vehicle, 2022-2032F |
6.5.3 Kenya Drive Shaft Market Revenues & Volume, By Passenger Cars, 2022-2032F |
6.5.4 Kenya Drive Shaft Market Revenues & Volume, By Heavy Commercial Vehicles, 2022-2032F |
7 Kenya Drive Shaft Market Import-Export Trade Statistics |
7.1 Kenya Drive Shaft Market Export to Major Countries |
7.2 Kenya Drive Shaft Market Imports from Major Countries |
8 Kenya Drive Shaft Market Key Performance Indicators |
9 Kenya Drive Shaft Market - Opportunity Assessment |
9.1 Kenya Drive Shaft Market Opportunity Assessment, By Shaft Type, 2022 & 2032F |
9.2 Kenya Drive Shaft Market Opportunity Assessment, By Material Types, 2022 & 2032F |
9.3 Kenya Drive Shaft Market Opportunity Assessment, By Design Type, 2022 & 2032F |
9.4 Kenya Drive Shaft Market Opportunity Assessment, By Position, 2022 & 2032F |
9.5 Kenya Drive Shaft Market Opportunity Assessment, By Vehicle Type, 2022 & 2032F |
10 Kenya Drive Shaft Market - Competitive Landscape |
10.1 Kenya Drive Shaft Market Revenue Share, By Companies, 2025 |
10.2 Kenya Drive Shaft Market Competitive Benchmarking, By Operating and Technical Parameters |
11 Company Profiles |
12 Recommendations |
13 Disclaimer |
Global Go To Market Strategy - 2030
Export potential enables firms to identify high-growth global markets with greater confidence by combining advanced trade intelligence with a structured quantitative methodology. The framework analyzes emerging demand trends and country-level import patterns while integrating macroeconomic and trade datasets such as GDP and population forecasts, bilateral import–export flows, tariff structures, elasticity differentials between developed and developing economies, geographic distance, and import demand projections. Using weighted trade values from 2020–2024 as the base period to project country-to-country export potential for 2030, these inputs are operationalized through calculated drivers such as gravity model parameters, tariff impact factors, and projected GDP per-capita growth. Through an analysis of hidden potentials, demand hotspots, and market conditions that are most favorable to success, this method enables firms to focus on target countries, maximize returns, and global expansion with data, backed by accuracy.
By factoring in the projected importer demand gap that is currently unmet and could be potential opportunity, it identifies the potential for the Exporter (Country) among 190 countries, against the general trade analysis, which identifies the biggest importer or exporter.
To discover high-growth global markets and optimize your business strategy:
Click Here
Pricing
- Single User License$ 1,995
- Department License$ 2,400
- Site License$ 3,120
- Global License$ 3,795

Leadership Perspectives from Industry Events
Search
Thought Leadership and Analyst Meet


Our Clients
6WResearch In News
- India Air Conditioner Market Set for Strong Rebound in 2026 After Weather-Led Correction and GST-Driven Recovery: 6Wresearch
- ADAS in India: How Automatic Emergency Braking, Blind Spot Detection & Driver Monitoring are Transforming Road Safety
- Doha a strategic location for EV manufacturing hub: IPA Qatar
- Demand for luxury TVs surging in the GCC, says Samsung
- Empowering Growth: The Thriving Journey of Bangladesh’s Cable Industry
- Demand for luxury TVs surging in the GCC, says Samsung
Latest Reports
- Poland Fire Protection Systems Market (2026-2032)
- Cape Verde Portable Hand-Thrown Extinguisher Market (2026-2032)
- Canada Portable Hand-Thrown Extinguisher Market (2026-2032)
- Cameroon Portable Hand-Thrown Extinguisher Market (2026-2032)
- Burundi Portable Hand-Thrown Extinguisher Market (2026-2032)
- Burkina Faso Portable Hand-Thrown Extinguisher Market (2026-2032)
- Bulgaria Portable Hand-Thrown Extinguisher Market (2026-2032)
- Brunei Portable Hand-Thrown Extinguisher Market (2026-2032)
- Botswana Portable Hand-Thrown Extinguisher Market (2026-2032)
- Bosnia and Herzegovina Portable Hand-Thrown Extinguisher Market (2026-2032)
Industry Events and Analyst Meet

HIMTEX 2026

India Refining Summit 2026

India EV Show 2026

EV tech India Expo 2026

Auto Tech Asia 2026
Whitepaper
- Middle East & Africa Commercial Security Market Click here to view more.
- Middle East & Africa Fire Safety Systems & Equipment Market Click here to view more.
- GCC Drone Market Click here to view more.
- Middle East Lighting Fixture Market Click here to view more.
- GCC Physical & Perimeter Security Market Click here to view more.