Kenya Glass Reinforced Plastic Market (2026-2032) Outlook | Size, Value, Growth, Analysis, Companies, Forecast, Industry, Share, Trends & Revenue
Market Forecast By Type (Epoxy, Polyester, Vinyl Ester, Polyurethane, Others), By Method (Moulding Method, Pultrusion Method, Layup, Others), By Application (Pipes and Tanks, Wind Power Turbines, Storage Containers, Roofs, Floor Gratings, Steps and Stairs, Switch Actuators, Others), By End-Use (Building and Construction, Transportation, Electrical and Electronics, Oil and Gas, Mining, Water and Wastewater, Others) And Competitive Landscape
| Product Code: ETC264110 | Publication Date: Aug 2022 | Updated Date: Jul 2026 | Product Type: Market Research Report | |
| Publisher: 6Wresearch | Author: Vasudha | No. of Pages: 75 | No. of Figures: 35 | No. of Tables: 20 |
Kenya Glass Reinforced Plastic Market Size, Share & Growth Rate
The Kenya Glass Reinforced Plastic Market was estimated at USD 388 Million in 2025 and is projected to reach USD 525 Million by 2032, growing at a CAGR of 4.4% from 2026 to 2032. This growth trajectory is largely propelled by the construction sector's increasing reliance on GRP materials for roofing, pipes, and water storage tanks. Additionally, the automotive and aerospace industries are contributing to this demand as they recognize the benefits of lightweight and durable GRP components.
Kenya Glass Reinforced Plastic Market Growth Rate Analysis (2021-2032)
The Kenya Glass Reinforced Plastic market has shown a steady growth pattern, with a notable increase from 4.9% in 2021 to 5.5% in 2023. This growth is attributed to rising consumer demand for durable and lightweight materials across various sectors, including construction and automotive. The investment in infrastructure projects has bolstered this demand, coupled with a gradual shift towards sustainable materials amid the ongoing energy transition. Although projections indicate a slight fluctuation, with growth rates of 5.0% in 2024 and 5.2% in 2025, overall trends remain stable. By 2032, the market is anticipated to maintain a healthy growth rate of 5.1%, driven by technological advancements and increasing market penetration.
Kenya Glass Reinforced Plastic Market Year-wise Growth Rate and Key Drivers
This graph highlights how the Kenya Glass Reinforced Plastic Market has steadily grown over the years, supported by major growth factors.
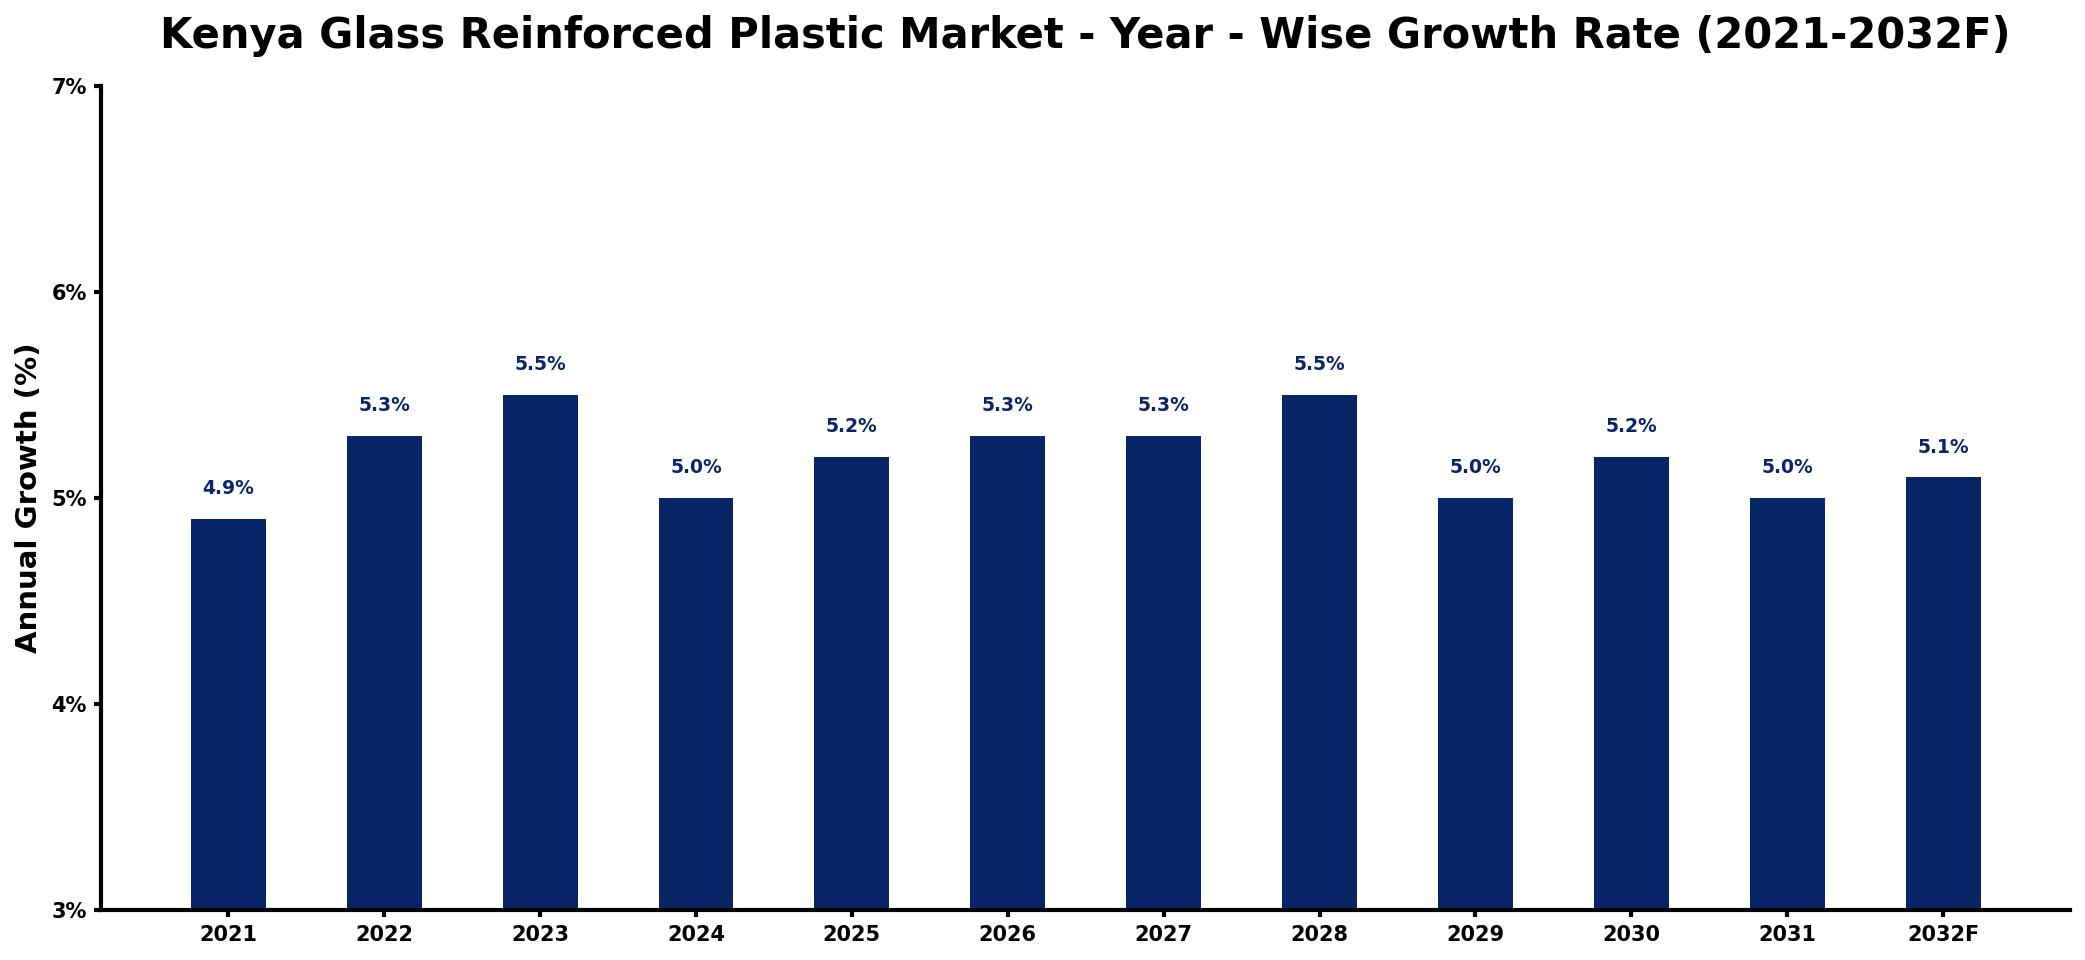
The table below presents the year‑wise growth rates along with the key drivers influencing the market
| Year | Growth Rate | Major Drivers |
| 2021 | 4.9% | Rising construction sector investments |
| 2022 | 5.3% | Growth in renewable energy projects |
| 2023 | 5.5% | Expansion of automotive manufacturing facilities |
| 2024 | 5.0% | Increased demand for infrastructure development |
| 2025 | 5.2% | Surge in marine industry applications |
| 2026 | 5.3% | Technological advancements in production |
| 2027 | 5.3% | Growing popularity of eco-friendly materials |
| 2028 | 5.5% | Increase in transportation sector projects |
| 2029 | 5.0% | rising procurement volume requirements |
| 2030 | 5.2% | Investment in affordable housing initiatives |
| 2031 | 5.0% | Rising demand for consumer goods |
| 2032 | 5.1% | expanding healthcare application demand |
Note: Market size estimations and growth projections presented in this report are based on 6Wresearch's proprietary forecasting methodology, utilizing the latest available industry data, government publications, and primary research inputs.
Kenya Glass Reinforced Plastic Market Synopsis
Recently, the Kenya Glass Reinforced Plastic Market has experienced robust momentum, spurred by rising applications across several industries. However, as the market evolves, anticipated innovations in manufacturing processes and sustainability considerations are set to shape its future, enhancing its appeal in both traditional and emerging applications.
The current landscape reflects a competitive arena where local manufacturers are vying for market share against international entrants. With infrastructure projects on the rise and a growing appreciation for the advantages of GRP, the market is well-positioned for sustained growth, paving the way for both challenges and opportunities ahead.
Kenya Glass Reinforced Plastic Market Key Takeaways
- The market is set to grow steadily due to increasing demand from construction, automotive, and aerospace sectors.
- GRPs lightweight nature, high strength-to-weight ratio, and corrosion resistance make it an attractive choice for various applications.
- Government initiatives supporting local manufacturers foster a favorable business environment.
- Rising awareness regarding sustainability enhances the market's appeal over traditional materials.
- Technological advancements and innovations in manufacturing are crucial for market differentiation.
Evaluation of Restraints in Kenya Glass Reinforced Plastic Market
Despite the promising growth outlook, several limitations impede the Kenya Glass Reinforced Plastic Market. The high costs of raw materials and production processes create a barrier to entry for local manufacturers striving to compete with cheaper imported products. Additionally, there is a notable skills gap in the labor force, which restricts the efficient production of GRP products. Infrastructure inadequacies for transportation and distribution further complicate market dynamics, restricting the flow of goods and knowledge. To cultivate a more competitive landscape, the industry must address these challenges through strategic investments in workforce development and supply chain enhancement.
Kenya Glass Reinforced Plastic Market Trends
Emerging trends are reshaping the Kenya Glass Reinforced Plastic Market, notably an increased focus on sustainability and eco-friendly building materials. As industries shift towards greener practices, GRPs attributes align perfectly with these goals. Furthermore, innovations in manufacturing techniques are facilitating greater design flexibility, allowing customized GRP products that meet specific client needs. The growing demand for resilient and lightweight solutions in construction, along with advancements in product technology, are pivotal in redefining market demand.
Kenya Glass Reinforced Plastic Market Opportunities
The Kenya Glass Reinforced Plastic Market is ripe with investment opportunities, particularly in manufacturing GRP products tailored for the construction sector. Establishing robust distribution networks and offering value-added services such as installation and maintenance can further enhance market penetration. The government's initiatives that prioritize sustainable building materials add another layer of opportunity for investors. By collaborating with local construction firms and leveraging technology, stakeholders can capitalize on the growing demand for innovative GRP solutions.
Government Initiatives in the Kenya Glass Reinforced Plastic Market
The Kenyan government has enacted various policies aimed at bolstering the Glass Reinforced Plastic Market. The Kenya Bureau of Standards (KEBS) has established quality standards for GRP products, ensuring consumer safety and fostering compliance with international benchmarks. Import regulations and tariffs are also in place to shield local manufacturers from unfair competition, while incentives such as tax breaks promote growth within the sector. These initiatives are intended to enhance the competitiveness of local GRP products and encourage environmentally responsible production practices.
Future Insights of the Kenya Glass Reinforced Plastic Market
Looking ahead to 2026-2032, the Kenya Glass Reinforced Plastic Market is anticipated to experience steady expansion. The dual drivers of infrastructural investment and a growing emphasis on renewable energy projects will catalyze further adoption of GRP products. As industries become more cognizant of GRPs benefits, including its lightweight and durable characteristics, the material will increasingly find its place across various applications. This upward trajectory indicates a promising horizon for market players aiming to strengthen their foothold in this evolving sector.
Kenya Glass Reinforced Plastic Market Latest Developments (2025 - 2026)
Recent developments in the Kenya Glass Reinforced Plastic Market highlight a shift towards adopting innovative manufacturing techniques. There has been an uptick in partnerships between local producers and technology firms aimed at enhancing product quality and sustainability. Additionally, heightened public and private investment in infrastructure projects is expected to support the growing demand for GRP products, providing a conducive environment for market growth. As the focus on eco-friendly solutions intensifies, GRP manufacturers are poised to adapt to evolving market needs.
Kenya Glass Reinforced Plastic Market - Key Attractiveness of the Report
- 10 Years of Market Numbers
- Historical Data Starting from 2022 to 2025
- Base Year: 2025
- Forecast Data until 2032
- Key Performance Indicators Impacting the Market
- Major Upcoming Developments and Projects
Key Highlights of the Report:
- Kenya Glass Reinforced Plastic Market Outlook
- Market Size of Kenya Glass Reinforced Plastic Market, 2025
- Forecast of Kenya Glass Reinforced Plastic Market, 2032
- Historical Data and Forecast of Kenya Glass Reinforced Plastic Revenues & Volume for the Period 2022-2032F
- Kenya Glass Reinforced Plastic Market Trend Evolution
- Kenya Glass Reinforced Plastic Market Drivers and Challenges
- Kenya Glass Reinforced Plastic Price Trends
- Kenya Glass Reinforced Plastic Porter's Five Forces
- Kenya Glass Reinforced Plastic Industry Life Cycle
- Historical Data and Forecast of Kenya Glass Reinforced Plastic Market Revenues & Volume By Type for the Period 2022-2032F
- Historical Data and Forecast of Kenya Glass Reinforced Plastic Market Revenues & Volume By Epoxy for the Period 2022-2032F
- Historical Data and Forecast of Kenya Glass Reinforced Plastic Market Revenues & Volume By Polyester for the Period 2022-2032F
- Historical Data and Forecast of Kenya Glass Reinforced Plastic Market Revenues & Volume By Vinyl Ester for the Period 2022-2032F
- Historical Data and Forecast of Kenya Glass Reinforced Plastic Market Revenues & Volume By Polyurethane for the Period 2022-2032F
- Historical Data and Forecast of Kenya Glass Reinforced Plastic Market Revenues & Volume By Others for the Period 2022-2032F
- Historical Data and Forecast of Kenya Glass Reinforced Plastic Market Revenues & Volume By Method for the Period 2022-2032F
- Historical Data and Forecast of Kenya Glass Reinforced Plastic Market Revenues & Volume By Moulding Method for the Period 2022-2032F
- Historical Data and Forecast of Kenya Glass Reinforced Plastic Market Revenues & Volume By Pultrusion Method for the Period 2022-2032F
- Historical Data and Forecast of Kenya Glass Reinforced Plastic Market Revenues & Volume By Layup for the Period 2022-2032F
- Historical Data and Forecast of Kenya Glass Reinforced Plastic Market Revenues & Volume By Others for the Period 2022-2032F
- Historical Data and Forecast of Kenya Glass Reinforced Plastic Market Revenues & Volume By Application for the Period 2022-2032F
- Historical Data and Forecast of Kenya Glass Reinforced Plastic Market Revenues & Volume By Pipes and Tanks for the Period 2022-2032F
- Historical Data and Forecast of Kenya Glass Reinforced Plastic Market Revenues & Volume By Wind Power Turbines for the Period 2022-2032F
- Historical Data and Forecast of Kenya Glass Reinforced Plastic Market Revenues & Volume By Storage Containers for the Period 2022-2032F
- Historical Data and Forecast of Kenya Glass Reinforced Plastic Market Revenues & Volume By Roofs for the Period 2022-2032F
- Historical Data and Forecast of Kenya Glass Reinforced Plastic Market Revenues & Volume By Floor Gratings for the Period 2022-2032F
- Historical Data and Forecast of Kenya Glass Reinforced Plastic Market Revenues & Volume By Steps and Stairs for the Period 2022-2032F
- Historical Data and Forecast of Kenya Glass Reinforced Plastic Market Revenues & Volume By Switch Actuators for the Period 2022-2032F
- Historical Data and Forecast of Kenya Glass Reinforced Plastic Market Revenues & Volume By Others for the Period 2022-2032F
- Historical Data and Forecast of Kenya Glass Reinforced Plastic Market Revenues & Volume By End-Use for the Period 2022-2032F
- Historical Data and Forecast of Kenya Glass Reinforced Plastic Market Revenues & Volume By Building and Construction for the Period 2022-2032F
- Historical Data and Forecast of Kenya Glass Reinforced Plastic Market Revenues & Volume By Transportation for the Period 2022-2032F
- Historical Data and Forecast of Kenya Glass Reinforced Plastic Market Revenues & Volume By Electrical and Electronics for the Period 2022-2032F
- Historical Data and Forecast of Kenya Glass Reinforced Plastic Market Revenues & Volume By Oil and Gas for the Period 2022-2032F
- Historical Data and Forecast of Kenya Glass Reinforced Plastic Market Revenues & Volume By Mining for the Period 2022-2032F
- Historical Data and Forecast of Kenya Glass Reinforced Plastic Market Revenues & Volume By Water and Wastewater for the Period 2022-2032F
- Historical Data and Forecast of Kenya Glass Reinforced Plastic Market Revenues & Volume By Others for the Period 2022-2032F
- Kenya Glass Reinforced Plastic Import Export Trade Statistics
- Market Opportunity Assessment By Type
- Market Opportunity Assessment By Method
- Market Opportunity Assessment By Application
- Market Opportunity Assessment By End-Use
- Kenya Glass Reinforced Plastic Top Companies Market Share
- Kenya Glass Reinforced Plastic Competitive Benchmarking By Technical and Operational Parameters
- Kenya Glass Reinforced Plastic Company Profiles
- Kenya Glass Reinforced Plastic Key Strategic Recommendations
Frequently Asked Questions About the Market Study (FAQs):
The growth is driven primarily by increasing applications in construction, automotive, and aerospace sectors, alongside a heightened focus on sustainability.
The Kenya Glass Reinforced Plastic Market was estimated at USD 388 Million in 2025 and is projected to reach USD 525 Million by 2032, growing at a CAGR of 4.4% from 2026 to 2032.
Local manufacturers confront high production costs, limited skilled labor, and stiff competition from cheaper imports.
Yes, the government offers various incentives, including tax breaks and standards set by KEBS to promote local manufacturing and compliance with quality measures.
The construction sector is the largest consumer, with substantial demand also coming from automotive and aerospace applications.
Innovations in manufacturing techniques, design customization, and sustainable practices are currently shaping the market, enhancing the appeal of GRP products.
6Wresearch actively monitors the Kenya Glass Reinforced Plastic Market and publishes its comprehensive annual report, highlighting emerging trends, growth drivers, revenue analysis, and forecast outlook. Our insights help businesses to make data-backed strategic decisions with ongoing market dynamics. Our analysts track relevent industries related to the Kenya Glass Reinforced Plastic Market, allowing our clients with actionable intelligence and reliable forecasts tailored to emerging regional needs.
Yes, we provide customisation as per your requirements. To learn more, feel free to contact us on sales@6wresearch.com
1 Executive Summary |
2 Introduction |
2.1 Key Highlights of the Report |
2.2 Report Description |
2.3 Market Scope & Segmentation |
2.4 Research Methodology |
2.5 Assumptions |
3 Kenya Glass Reinforced Plastic Market Overview |
3.1 Kenya Country Macro Economic Indicators |
3.2 Kenya Glass Reinforced Plastic Market Revenues & Volume, 2022 & 2032F |
3.3 Kenya Glass Reinforced Plastic Market - Industry Life Cycle |
3.4 Kenya Glass Reinforced Plastic Market - Porter's Five Forces |
3.5 Kenya Glass Reinforced Plastic Market Revenues & Volume Share, By Type, 2022 & 2032F |
3.6 Kenya Glass Reinforced Plastic Market Revenues & Volume Share, By Method, 2022 & 2032F |
3.7 Kenya Glass Reinforced Plastic Market Revenues & Volume Share, By Application, 2022 & 2032F |
3.8 Kenya Glass Reinforced Plastic Market Revenues & Volume Share, By End-Use, 2022 & 2032F |
4 Kenya Glass Reinforced Plastic Market Dynamics |
4.1 Impact Analysis |
4.2 Market Drivers |
4.2.1 Increasing demand for lightweight, durable, and corrosion-resistant materials in various industries such as automotive, construction, and aerospace. |
4.2.2 Growing emphasis on infrastructure development and urbanization projects in Kenya, driving the need for strong and versatile materials like glass reinforced plastic. |
4.2.3 Rising awareness about the benefits of glass reinforced plastic, such as its low maintenance, long lifespan, and cost-effectiveness. |
4.3 Market Restraints |
4.3.1 High initial investment required for setting up manufacturing facilities for glass reinforced plastic products. |
4.3.2 Limited availability of skilled labor with expertise in working with glass reinforced plastic materials in Kenya. |
5 Kenya Glass Reinforced Plastic Market Trends |
6 Kenya Glass Reinforced Plastic Market, By Types |
6.1 Kenya Glass Reinforced Plastic Market, By Type |
6.1.1 Overview and Analysis |
6.1.2 Kenya Glass Reinforced Plastic Market Revenues & Volume, By Type, 2022-2032F |
6.1.3 Kenya Glass Reinforced Plastic Market Revenues & Volume, By Epoxy, 2022-2032F |
6.1.4 Kenya Glass Reinforced Plastic Market Revenues & Volume, By Polyester, 2022-2032F |
6.1.5 Kenya Glass Reinforced Plastic Market Revenues & Volume, By Vinyl Ester, 2022-2032F |
6.1.6 Kenya Glass Reinforced Plastic Market Revenues & Volume, By Polyurethane, 2022-2032F |
6.1.7 Kenya Glass Reinforced Plastic Market Revenues & Volume, By Others, 2022-2032F |
6.2 Kenya Glass Reinforced Plastic Market, By Method |
6.2.1 Overview and Analysis |
6.2.2 Kenya Glass Reinforced Plastic Market Revenues & Volume, By Moulding Method, 2022-2032F |
6.2.3 Kenya Glass Reinforced Plastic Market Revenues & Volume, By Pultrusion Method, 2022-2032F |
6.2.4 Kenya Glass Reinforced Plastic Market Revenues & Volume, By Layup, 2022-2032F |
6.2.5 Kenya Glass Reinforced Plastic Market Revenues & Volume, By Others, 2022-2032F |
6.3 Kenya Glass Reinforced Plastic Market, By Application |
6.3.1 Overview and Analysis |
6.3.2 Kenya Glass Reinforced Plastic Market Revenues & Volume, By Pipes and Tanks, 2022-2032F |
6.3.3 Kenya Glass Reinforced Plastic Market Revenues & Volume, By Wind Power Turbines, 2022-2032F |
6.3.4 Kenya Glass Reinforced Plastic Market Revenues & Volume, By Storage Containers, 2022-2032F |
6.3.5 Kenya Glass Reinforced Plastic Market Revenues & Volume, By Roofs, 2022-2032F |
6.3.6 Kenya Glass Reinforced Plastic Market Revenues & Volume, By Floor Gratings, 2022-2032F |
6.3.7 Kenya Glass Reinforced Plastic Market Revenues & Volume, By Steps and Stairs, 2022-2032F |
6.3.8 Kenya Glass Reinforced Plastic Market Revenues & Volume, By Others, 2022-2032F |
6.3.9 Kenya Glass Reinforced Plastic Market Revenues & Volume, By Others, 2022-2032F |
6.4 Kenya Glass Reinforced Plastic Market, By End-Use |
6.4.1 Overview and Analysis |
6.4.2 Kenya Glass Reinforced Plastic Market Revenues & Volume, By Building and Construction, 2022-2032F |
6.4.3 Kenya Glass Reinforced Plastic Market Revenues & Volume, By Transportation, 2022-2032F |
6.4.4 Kenya Glass Reinforced Plastic Market Revenues & Volume, By Electrical and Electronics, 2022-2032F |
6.4.5 Kenya Glass Reinforced Plastic Market Revenues & Volume, By Oil and Gas, 2022-2032F |
6.4.6 Kenya Glass Reinforced Plastic Market Revenues & Volume, By Mining, 2022-2032F |
6.4.7 Kenya Glass Reinforced Plastic Market Revenues & Volume, By Water and Wastewater, 2022-2032F |
7 Kenya Glass Reinforced Plastic Market Import-Export Trade Statistics |
7.1 Kenya Glass Reinforced Plastic Market Export to Major Countries |
7.2 Kenya Glass Reinforced Plastic Market Imports from Major Countries |
8 Kenya Glass Reinforced Plastic Market Key Performance Indicators |
8.1 Percentage increase in adoption of glass reinforced plastic materials in key industries in Kenya. |
8.2 Number of infrastructure projects utilizing glass reinforced plastic materials. |
8.3 Growth in the number of local manufacturers offering glass reinforced plastic products in Kenya. |
9 Kenya Glass Reinforced Plastic Market - Opportunity Assessment |
9.1 Kenya Glass Reinforced Plastic Market Opportunity Assessment, By Type, 2022 & 2032F |
9.2 Kenya Glass Reinforced Plastic Market Opportunity Assessment, By Method, 2022 & 2032F |
9.3 Kenya Glass Reinforced Plastic Market Opportunity Assessment, By Application, 2022 & 2032F |
9.4 Kenya Glass Reinforced Plastic Market Opportunity Assessment, By End-Use, 2022 & 2032F |
10 Kenya Glass Reinforced Plastic Market - Competitive Landscape |
10.1 Kenya Glass Reinforced Plastic Market Revenue Share, By Companies, 2025 |
10.2 Kenya Glass Reinforced Plastic Market Competitive Benchmarking, By Operating and Technical Parameters |
11 Company Profiles |
12 Recommendations |
13 Disclaimer |
Global Go To Market Strategy - 2030
Export potential enables firms to identify high-growth global markets with greater confidence by combining advanced trade intelligence with a structured quantitative methodology. The framework analyzes emerging demand trends and country-level import patterns while integrating macroeconomic and trade datasets such as GDP and population forecasts, bilateral import–export flows, tariff structures, elasticity differentials between developed and developing economies, geographic distance, and import demand projections. Using weighted trade values from 2020–2024 as the base period to project country-to-country export potential for 2030, these inputs are operationalized through calculated drivers such as gravity model parameters, tariff impact factors, and projected GDP per-capita growth. Through an analysis of hidden potentials, demand hotspots, and market conditions that are most favorable to success, this method enables firms to focus on target countries, maximize returns, and global expansion with data, backed by accuracy.
By factoring in the projected importer demand gap that is currently unmet and could be potential opportunity, it identifies the potential for the Exporter (Country) among 190 countries, against the general trade analysis, which identifies the biggest importer or exporter.
To discover high-growth global markets and optimize your business strategy:
Click Here
Pricing
- Single User License$ 1,995
- Department License$ 2,400
- Site License$ 3,120
- Global License$ 3,795

Leadership Perspectives from Industry Events
Search
Thought Leadership and Analyst Meet


Our Clients
6WResearch In News
- India Air Conditioner Market Set for Strong Rebound in 2026 After Weather-Led Correction and GST-Driven Recovery: 6Wresearch
- ADAS in India: How Automatic Emergency Braking, Blind Spot Detection & Driver Monitoring are Transforming Road Safety
- Doha a strategic location for EV manufacturing hub: IPA Qatar
- Demand for luxury TVs surging in the GCC, says Samsung
- Empowering Growth: The Thriving Journey of Bangladesh’s Cable Industry
- Demand for luxury TVs surging in the GCC, says Samsung
Latest Reports
- Nicaragua RPG Gaming Market (2026-2032)
- New Zealand RPG Gaming Market (2026-2032)
- Netherlands RPG Gaming Market (2026-2032)
- Nauru RPG Gaming Market (2026-2032)
- Namibia RPG Gaming Market (2026-2032)
- Mozambique RPG Gaming Market (2026-2032)
- Montenegro RPG Gaming Market (2026-2032)
- Mongolia RPG Gaming Market (2026-2032)
- Monaco RPG Gaming Market (2026-2032)
- Micronesia RPG Gaming Market (2026-2032)
Industry Events and Analyst Meet

HIMTEX 2026

India Refining Summit 2026

India EV Show 2026

EV tech India Expo 2026

Auto Tech Asia 2026
Whitepaper
- Middle East & Africa Commercial Security Market Click here to view more.
- Middle East & Africa Fire Safety Systems & Equipment Market Click here to view more.
- GCC Drone Market Click here to view more.
- Middle East Lighting Fixture Market Click here to view more.
- GCC Physical & Perimeter Security Market Click here to view more.