Kenya Impregnated Paper Market Outlook | Analysis, Size, Forecast, Revenue, Industry, COVID-19 IMPACT, Value, Trends, Share, Companies & Growth
Market Forecast By Application (Furniture manufacturing, Interior design), By End-use (Industrial, Commercial, Residential), By Type (Phenol, Melamine, Urea) And Competitive Landscape
| Product Code: ETC328970 | Publication Date: Aug 2022 | Updated Date: Jul 2026 | Product Type: Market Research Report | |
| Publisher: 6Wresearch | Author: Ravi Bhandari | No. of Pages: 75 | No. of Figures: 35 | No. of Tables: 20 |
Kenya Impregnated Paper Market Size, Share & Growth Rate
The Kenya Impregnated Paper Market was estimated at USD 406 Million in 2025 and is projected to reach USD 533 Million by 2032, growing at a CAGR of 4.0% from 2026 to 2032. This positive trajectory is driven largely by increasing demand across various sectors, particularly in furniture, construction, and packaging. The rise in urbanization, combined with evolving consumer preferences for durable and aesthetically pleasing materials, plays a significant role in shaping the market landscape.
Kenya Impregnated Paper Market Growth Rate Analysis (2021-2032)
The Kenya impregnated paper market has shown stable growth, with rates fluctuating slightly around the 4.5% mark in recent years. In 2023, it experienced a modest uptick to 5.0%, driven by increased consumer demand particularly in the furniture and construction sectors, which have been bolstered by ongoing infrastructure projects and a growing middle class. While 2024 and 2025 are projected to see a slight decline to 4.7% and 4.5% respectively, this can be attributed to potential supply chain disruptions and inflationary pressures. However, investments in digitalization and sustainable manufacturing practices are expected to catalyze growth, with forecasts suggesting a rebound to 4.8% in 2027, reflecting a resilient market adapting to technological advancements and evolving consumer preferences.
Kenya Impregnated Paper Market Year-wise Growth Rate and Key Drivers
This graph highlights how the Kenya Impregnated Paper Market has steadily grown over the past five years, supported by major growth factors.
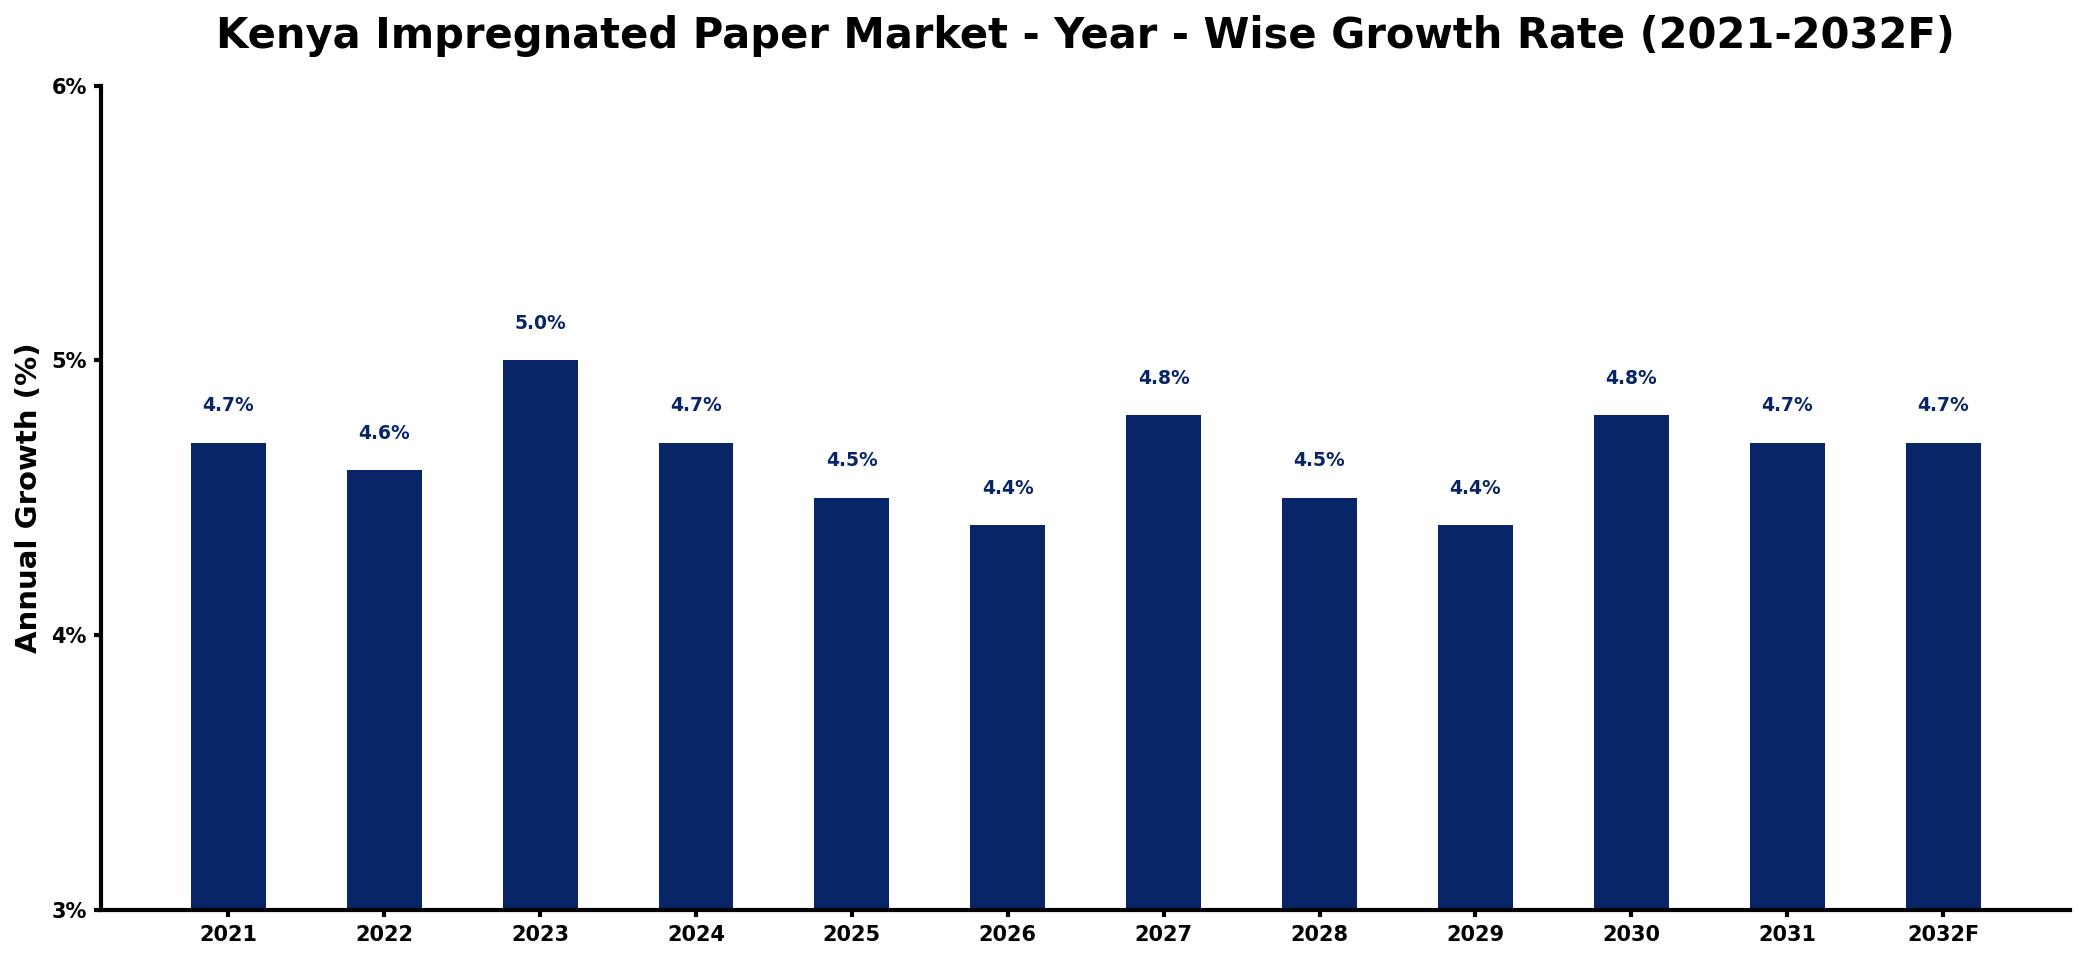
The table below presents the year‑wise growth rates along with the key drivers influencing the market
| Year | Growth Rate | Major Drivers |
| 2021 | 4.7% | Rising demand from construction sector |
| 2022 | 4.6% | Increased investment in manufacturing facilities |
| 2023 | 5.0% | Growing popularity of eco-friendly alternatives |
| 2024 | 4.7% | Expansion of export markets opportunities |
| 2025 | 4.5% | Technological advancements in production processes |
| 2026 | 4.4% | Strengthened distribution network capabilities |
| 2027 | 4.8% | Surge in consumer awareness initiatives |
| 2028 | 4.5% | Enhanced product customization options available |
| 2029 | 4.4% | Emergence of new application sectors |
| 2030 | 4.8% | Growing partnerships with local businesses |
| 2031 | 4.7% | Increased focus on sustainability practices |
| 2032 | 4.7% | Strengthened regulatory support for industry |
Note: Market size estimations and growth projections presented in this report are based on 6Wresearch's proprietary forecasting methodology, utilizing the latest available industry data, government publications, and primary research inputs.
Kenya Impregnated Paper Market Synopsis
A pivotal force currently driving the Kenya Impregnated Paper Market is the growing trend of eco-friendly materials. As sustainability becomes a primary concern for both consumers and manufacturers, impregnated paper products are gaining traction due to their recyclability and reduced environmental footprint. The alignment with global sustainability goals has spurred innovation and product development in this segment.
Additionally, advancements in technology are reshaping production methods, enhancing the quality and application range of impregnated paper. These improvements are making it increasingly feasible for industries to adopt impregnated paper, further embedding it into diverse applications and strengthening market growth.
Kenya Impregnated Paper Market Key Takeaways
- The market is projected to grow steadily, driven by increased demand in construction and furniture industries.
- Eco-friendly trends are significantly influencing consumer choices and manufacturing processes.
- Technological advancements are enhancing product quality and expanding application areas.
- Government initiatives promoting sustainable practices are expected to foster market growth.
- Customization and versatility of impregnated paper make it appealing across various sectors.
Evaluation of Restraints in Kenya Impregnated Paper Market
Despite the optimistic outlook, several constraints hinder the growth of the Kenya Impregnated Paper Market. Fluctuating raw material prices can severely impact production costs, causing instability in pricing structures. Additionally, the limited awareness among small and medium-sized enterprises about the benefits and applications of impregnated paper poses a challenge for broader market adoption. The competitive landscape, dominated by traditional alternatives, also makes it difficult for newer products to gain traction in the market.
Kenya Impregnated Paper Market Trends
Current trends in the Kenya Impregnated Paper Market reflect a pronounced shift towards sustainability and innovation. Manufacturers are increasingly investing in research and development to produce high-performance, environmentally friendly impregnated papers. This includes the incorporation of natural resins and sustainable materials that not only enhance product characteristics but also align with international sustainability standards. The trend of multifunctionality, where impregnated paper is designed for specific applications—such as moisture resistance or enhanced durability—is also gaining momentum.
Kenya Impregnated Paper Market Opportunities
The future holds substantial opportunities for growth within the Kenya Impregnated Paper Market. The rising demand for customizable solutions across various end-use sectors presents avenues for innovative product development. Additionally, as global consumption patterns shift towards sustainable options, companies that can innovate while adhering to eco-friendly practices are well-positioned to capture market share. With urbanization trends continuing to rise, expanding distribution channels and enhancing consumer education around impregnated paper's benefits can further unlock market potential.
Government Initiatives in the Kenya Impregnated Paper Market
The Kenyan government has been proactive in promoting sustainable manufacturing practices, which directly benefits the impregnated paper sector. Initiatives focused on reducing plastic use and encouraging recycling have been implemented, creating an environment conducive to the growth of eco-friendly products, including impregnated paper. Additionally, public spending on infrastructure development provides a boost to the construction sector, thereby indirectly driving demand for impregnated paper products.
Future Insights of the Kenya Impregnated Paper Market
Looking ahead to 2026-2032, the Kenya Impregnated Paper Market is poised for significant evolution. The integration of cutting-edge technology and a shift toward sustainable materials will likely redefine the product offerings. As consumer awareness increases, market players who successfully communicate the benefits of impregnated paper are expected to thrive. Furthermore, partnerships within the supply chain may emerge, enabling companies to enhance their production capabilities and widen their reach in the market.
Kenya Impregnated Paper Market Latest Developments (2025 - 2026)
Recent industry developments indicate a growing emphasis on automation and efficiency in manufacturing processes within the Kenya Impregnated Paper Market. Companies are increasingly adopting smart technologies to optimize production lines and minimize waste. This trend is accompanied by a greater focus on research to develop higher-quality materials that meet diverse customer needs, particularly in environmentally conscious sectors. The collaboration between manufacturers and technology providers is expected to reshape operational frameworks and enhance product offerings.
Kenya Impregnated Paper Market - Key Attractiveness of the Report
- 10 Years of Market Numbers
- Historical Data Starting from 2022 to 2025
- Base Year: 2025
- Forecast Data until 2032
- Key Performance Indicators Impacting the Market
- Major Upcoming Developments and Projects
Key Highlights of the Report:
- Kenya Impregnated Paper Market Outlook
- Market Size of Kenya Impregnated Paper Market, 2025
- Forecast of Kenya Impregnated Paper Market, 2032
- Historical Data and Forecast of Kenya Impregnated Paper Revenues & Volume for the Period 2022-2032F
- Kenya Impregnated Paper Market Trend Evolution
- Kenya Impregnated Paper Market Drivers and Challenges
- Kenya Impregnated Paper Price Trends
- Kenya Impregnated Paper Porter's Five Forces
- Kenya Impregnated Paper Industry Life Cycle
- Historical Data and Forecast of Kenya Impregnated Paper Market Revenues & Volume By Application for the Period 2022-2032F
- Historical Data and Forecast of Kenya Impregnated Paper Market Revenues & Volume By Furniture manufacturing for the Period 2022-2032F
- Historical Data and Forecast of Kenya Impregnated Paper Market Revenues & Volume By Interior design for the Period 2022-2032F
- Historical Data and Forecast of Kenya Impregnated Paper Market Revenues & Volume By End-use for the Period 2022-2032F
- Historical Data and Forecast of Kenya Impregnated Paper Market Revenues & Volume By Industrial for the Period 2022-2032F
- Historical Data and Forecast of Kenya Impregnated Paper Market Revenues & Volume By Commercial for the Period 2022-2032F
- Historical Data and Forecast of Kenya Impregnated Paper Market Revenues & Volume By Residential for the Period 2022-2032F
- Historical Data and Forecast of Kenya Impregnated Paper Market Revenues & Volume By Type for the Period 2022-2032F
- Historical Data and Forecast of Kenya Impregnated Paper Market Revenues & Volume By Phenol for the Period 2022-2032F
- Historical Data and Forecast of Kenya Impregnated Paper Market Revenues & Volume By Melamine for the Period 2022-2032F
- Historical Data and Forecast of Kenya Impregnated Paper Market Revenues & Volume By Urea for the Period 2022-2032F
- Kenya Impregnated Paper Import Export Trade Statistics
- Market Opportunity Assessment By Application
- Market Opportunity Assessment By End-use
- Market Opportunity Assessment By Type
- Kenya Impregnated Paper Top Companies Market Share
- Kenya Impregnated Paper Competitive Benchmarking By Technical and Operational Parameters
- Kenya Impregnated Paper Company Profiles
- Kenya Impregnated Paper Key Strategic Recommendations
Frequently Asked Questions About the Market Study (FAQs):
The growth is primarily fueled by rising demands in construction and furniture, along with increasing consumer preference for sustainable materials.
Yes, the Kenya Impregnated Paper Market is estimated at USD 406 Million in 2025 and is projected to reach USD 533 Million by 2032, growing at a CAGR of 4.0% from 2026 to 2032.
Advancements are driving improvements in quality and expanding applications, making impregnated paper more versatile and appealing across various sectors.
The government supports sustainable practices, creating an enabling environment for the adoption of eco-friendly products, including impregnated paper.
Current trends include a focus on sustainability and multifunctional products that cater to specific consumer needs, driving innovation in this sector.
6Wresearch actively monitors the Kenya Impregnated Paper Market and publishes its comprehensive annual report, highlighting emerging trends, growth drivers, revenue analysis, and forecast outlook. Our insights help businesses to make data-backed strategic decisions with ongoing market dynamics. Our analysts track relevent industries related to the Kenya Impregnated Paper Market, allowing our clients with actionable intelligence and reliable forecasts tailored to emerging regional needs.
Yes, we provide customisation as per your requirements. To learn more, feel free to contact us on sales@6wresearch.com
|
1 Executive Summary |
|
2 Introduction |
|
2.1 Key Highlights of the Report |
|
2.2 Report Description |
|
2.3 Market Scope & Segmentation |
|
2.4 Research Methodology |
|
2.5 Assumptions |
|
3 Kenya Impregnated Paper Market Overview |
|
3.1 Kenya Country Macro Economic Indicators |
|
3.2 Kenya Impregnated Paper Market Revenues & Volume, 2022 & 2032F |
|
3.3 Kenya Impregnated Paper Market - Industry Life Cycle |
|
3.4 Kenya Impregnated Paper Market - Porter's Five Forces |
|
3.5 Kenya Impregnated Paper Market Revenues & Volume Share, By Application, 2022 & 2032F |
|
3.6 Kenya Impregnated Paper Market Revenues & Volume Share, By End-use, 2022 & 2032F |
|
3.7 Kenya Impregnated Paper Market Revenues & Volume Share, By Type, 2022 & 2032F |
|
4 Kenya Impregnated Paper Market Dynamics |
|
4.1 Impact Analysis |
|
4.2 Market Drivers |
|
4.2.1 Growth in the construction industry leading to increased demand for impregnated paper for decorative laminates |
|
4.2.2 Preference for eco-friendly and sustainable materials driving the adoption of impregnated paper in Kenya |
|
4.2.3 Rising disposable income and changing lifestyle trends boosting the demand for high-quality furniture and interior decor products |
|
4.3 Market Restraints |
|
4.3.1 Fluctuations in raw material prices impacting the production cost of impregnated paper |
|
4.3.2 Lack of awareness about the benefits and applications of impregnated paper among consumers in Kenya |
|
4.3.3 Limited availability of advanced manufacturing technologies hindering the production capacity and product innovation in the market |
|
5 Kenya Impregnated Paper Market Trends |
|
6 Kenya Impregnated Paper Market, By Types |
|
6.1 Kenya Impregnated Paper Market, By Application |
|
6.1.1 Overview and Analysis |
|
6.1.2 Kenya Impregnated Paper Market Revenues & Volume, By Application, 2022-2032F |
|
6.1.3 Kenya Impregnated Paper Market Revenues & Volume, By Furniture manufacturing, 2022-2032F |
|
6.1.4 Kenya Impregnated Paper Market Revenues & Volume, By Interior design, 2022-2032F |
|
6.2 Kenya Impregnated Paper Market, By End-use |
|
6.2.1 Overview and Analysis |
|
6.2.2 Kenya Impregnated Paper Market Revenues & Volume, By Industrial, 2022-2032F |
|
6.2.3 Kenya Impregnated Paper Market Revenues & Volume, By Commercial, 2022-2032F |
|
6.2.4 Kenya Impregnated Paper Market Revenues & Volume, By Residential, 2022-2032F |
|
6.3 Kenya Impregnated Paper Market, By Type |
|
6.3.1 Overview and Analysis |
|
6.3.2 Kenya Impregnated Paper Market Revenues & Volume, By Phenol, 2022-2032F |
|
6.3.3 Kenya Impregnated Paper Market Revenues & Volume, By Melamine, 2022-2032F |
|
6.3.4 Kenya Impregnated Paper Market Revenues & Volume, By Urea, 2022-2032F |
|
7 Kenya Impregnated Paper Market Import-Export Trade Statistics |
|
7.1 Kenya Impregnated Paper Market Export to Major Countries |
|
7.2 Kenya Impregnated Paper Market Imports from Major Countries |
|
8 Kenya Impregnated Paper Market Key Performance Indicators |
8.1 Percentage increase in the number of construction projects utilizing impregnated paper in Kenya |
8.2 Growth in the adoption of eco-friendly certifications for impregnated paper manufacturers in the country |
8.3 Number of new product introductions and technological advancements in the impregnated paper market in Kenya |
|
9 Kenya Impregnated Paper Market - Opportunity Assessment |
|
9.1 Kenya Impregnated Paper Market Opportunity Assessment, By Application, 2022 & 2032F |
|
9.2 Kenya Impregnated Paper Market Opportunity Assessment, By End-use, 2022 & 2032F |
|
9.3 Kenya Impregnated Paper Market Opportunity Assessment, By Type, 2022 & 2032F |
|
10 Kenya Impregnated Paper Market - Competitive Landscape |
|
10.1 Kenya Impregnated Paper Market Revenue Share, By Companies, 2025 |
|
10.2 Kenya Impregnated Paper Market Competitive Benchmarking, By Operating and Technical Parameters |
|
11 Company Profiles |
|
12 Recommendations |
|
13 Disclaimer |
Global Go To Market Strategy - 2030
Export potential enables firms to identify high-growth global markets with greater confidence by combining advanced trade intelligence with a structured quantitative methodology. The framework analyzes emerging demand trends and country-level import patterns while integrating macroeconomic and trade datasets such as GDP and population forecasts, bilateral import–export flows, tariff structures, elasticity differentials between developed and developing economies, geographic distance, and import demand projections. Using weighted trade values from 2020–2024 as the base period to project country-to-country export potential for 2030, these inputs are operationalized through calculated drivers such as gravity model parameters, tariff impact factors, and projected GDP per-capita growth. Through an analysis of hidden potentials, demand hotspots, and market conditions that are most favorable to success, this method enables firms to focus on target countries, maximize returns, and global expansion with data, backed by accuracy.
By factoring in the projected importer demand gap that is currently unmet and could be potential opportunity, it identifies the potential for the Exporter (Country) among 190 countries, against the general trade analysis, which identifies the biggest importer or exporter.
To discover high-growth global markets and optimize your business strategy:
Click Here
Pricing
- Single User License$ 1,995
- Department License$ 2,400
- Site License$ 3,120
- Global License$ 3,795

Leadership Perspectives from Industry Events
Search
Thought Leadership and Analyst Meet


Our Clients
6WResearch In News
- India Export Attractiveness Tracker 2026
- India Air Conditioner Market Set for Strong Rebound in 2026 After Weather-Led Correction and GST-Driven Recovery: 6Wresearch
- ADAS in India: How Automatic Emergency Braking, Blind Spot Detection & Driver Monitoring are Transforming Road Safety
- Doha a strategic location for EV manufacturing hub: IPA Qatar
- Demand for luxury TVs surging in the GCC, says Samsung
- Empowering Growth: The Thriving Journey of Bangladesh’s Cable Industry
Latest Reports
- Qatar Access and Home Network Market (2026-2032)
- Nicaragua RPG Gaming Market (2026-2032)
- New Zealand RPG Gaming Market (2026-2032)
- Netherlands RPG Gaming Market (2026-2032)
- Nauru RPG Gaming Market (2026-2032)
- Namibia RPG Gaming Market (2026-2032)
- Mozambique RPG Gaming Market (2026-2032)
- Montenegro RPG Gaming Market (2026-2032)
- Mongolia RPG Gaming Market (2026-2032)
- Monaco RPG Gaming Market (2026-2032)
Industry Events and Analyst Meet

EV India Expo 2026

HIMTEX 2026

India Refining Summit 2026

India EV Show 2026

EV tech India Expo 2026
Whitepaper
- Middle East & Africa Commercial Security Market Click here to view more.
- Middle East & Africa Fire Safety Systems & Equipment Market Click here to view more.
- GCC Drone Market Click here to view more.
- Middle East Lighting Fixture Market Click here to view more.
- GCC Physical & Perimeter Security Market Click here to view more.