Kenya Micro Turbine Market (2026-2032) Outlook | Share, Trends, Companies, Growth, Forecast, Value, Analysis, Industry, Size & Revenue
Market Forecast By Application (Combined Heat & Power (CHP), Standby Power), By Power Rating (12 kW -50 kW, 50 kW-250 kW, 250 kW-500 kW), By End-use (Industrial, Commercial, Residential) And Competitive Landscape
| Product Code: ETC099189 | Publication Date: Jun 2021 | Updated Date: Jun 2026 | Product Type: Report | |
| Publisher: 6Wresearch | Author: Ravi Bhandari | No. of Pages: 70 | No. of Figures: 35 | No. of Tables: 5 |
Kenya Micro Turbine Market Size, Share & Growth Rate
The Kenya Micro Turbine Market was estimated at USD 205 Million in 2025 and is projected to reach USD 268 Million by 2032, growing at a CAGR of 3.9% from 2026 to 2032. This growth trajectory is fueled by the increasing demand for decentralized energy solutions, particularly in rural areas. As industries and communities seek to enhance energy security and integrate renewable energy sources, the market for compact, efficient turbine generators becomes increasingly relevant.
Kenya Micro Turbine Market Growth Rate Analysis (2021-2032)
The Kenya micro turbine market has shown steady growth, with rates fluctuating between 4.3% and 4.9% from 2021 to 2032. In 2021, growth reached 4.6%, driven by heightened energy transition initiatives and increased investments in renewable energy infrastructure. This momentum carried into 2024, where the market is projected to grow by 4.9%, reflecting rising consumer demand for sustainable energy solutions. However, growth cooled slightly to 4.3% in both 2022 and 2023 due to market saturation and supply chain challenges. As we move towards 2032, the average growth rate stabilizes around 4.4%, supported by advancements in technology and favorable government policies encouraging local manufacturing and digital integration within the energy sector.
Kenya Micro Turbine Market Year-wise Growth Rate and Key Drivers
This graph highlights how the Kenya Micro Turbine Market has steadily grown over the past five years, supported by major growth factors.
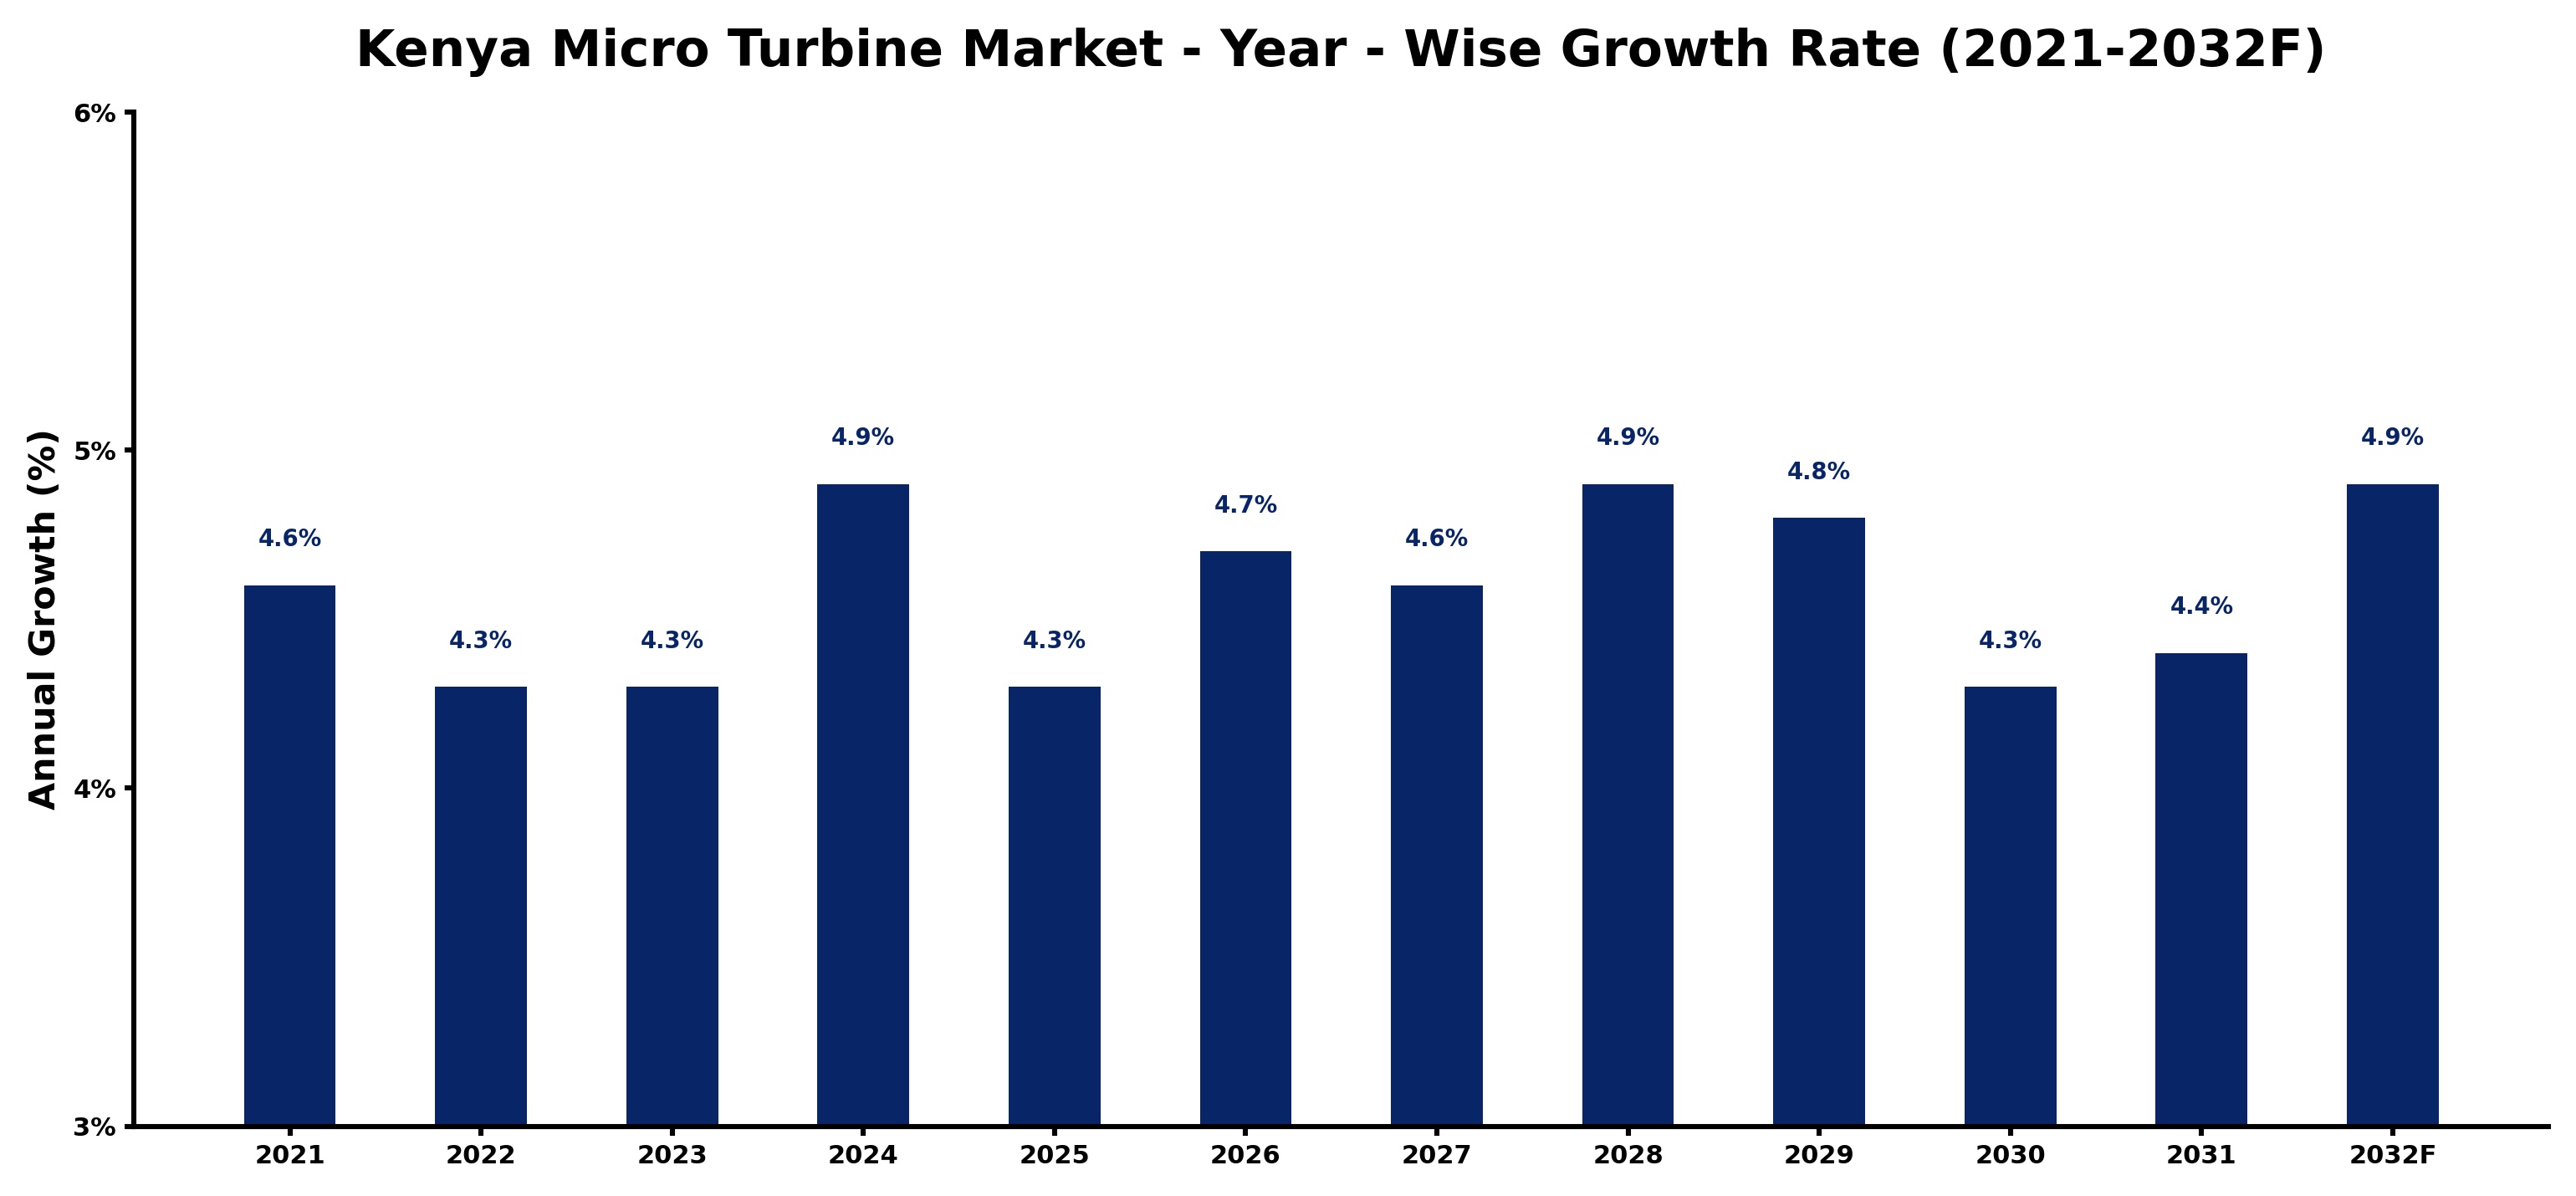
The table below presents the year‑wise growth rates along with the key drivers influencing the market
| Year | Growth Rate | Major Drivers |
| 2021 | 4.6% | Domestic micro turbine adoption boosts localized energy generation investments |
| 2022 | 4.3% | Domestic energy projects boost demand for micro turbine manufacturing |
| 2023 | 4.3% | Micro turbine manufacturing investments boost local renewable energy output |
| 2024 | 4.9% | Export driven turbine demand boosts local assembly plant investments |
| 2025 | 4.3% | Innovative micro turbine solutions drive energy diversification in Kenya |
| 2026 | 4.7% | Power plant upgrades boost demand for micro turbine technologies |
| 2027 | 4.6% | New energy projects boost micro turbine manufacturing capabilities in Kenya |
| 2028 | 4.9% | Foreign direct investments boost micro turbine manufacturing capabilities in Kenya |
| 2029 | 4.8% | Domestic demand for energy efficient turbines drives manufacturing investments |
| 2030 | 4.3% | Micro turbine manufacturing efficiency boosted by local supplier partnerships |
| 2031 | 4.4% | Renewable energy projects boost demand for micro turbine installations |
| 2032 | 4.9% | Micro turbine technology integration enhances energy efficiency in manufacturing |
Note - Market size estimations and growth projections presented in this report are based on 6Wresearch’s advanced forecasting approach, validated with industry datasets as of June 2026.
Kenya Micro Turbine Market Synopsis
The strongest force shaping the Kenya Micro Turbine Market currently is the quest for decentralized energy solutions, which are critical for enhancing energy access across the nation. Micro turbines are emerging as a practical alternative for industries and remote areas that face challenges with conventional power supply.
In addition to their role in distributed power generation, micro turbines are increasingly recognized for their potential in cogeneration and hybrid energy systems. This diversification of applications is attracting both interest and investment, indicating a robust future for micro turbine technology within the Kenyan energy landscape.
Kenya Micro Turbine Market Key Takeaways
- The market is primarily driven by the need for decentralized energy solutions.
- High initial investment costs continue to pose challenges for adoption.
- Government policies are gradually evolving to support renewable energy integration.
- A lack of skilled manpower for operations and maintenance hampers growth.
- Emerging technologies in micro turbines enhance their efficiency and applications.
Evaluation of Restraints in Kenya Micro Turbine Market
Despite the promising potential of the Kenya Micro Turbine Market, several restraints hinder its growth. High initial capital investments deter many businesses from adopting this technology, as financial barriers remain significant. Moreover, regulatory challenges complicate market entry and technology adoption, with many stakeholders facing difficulty navigating the complexities of energy regulations. Compounding these issues is the insufficient grid infrastructure, which limits the integration of turbine-generated power into existing energy systems. Additionally, a shortage of trained personnel for the maintenance and operation of micro turbines further restricts market expansion, making it vital for stakeholders to address these concerns.
Kenya Micro Turbine Market Trends
Several key trends are shaping the Kenya Micro Turbine Market. The integration of renewable energy technologies is becoming increasingly significant, with micro turbines being recognized for their adaptability in hybrid systems. Additionally, innovations in turbine design and efficiency are paving the way for more compact and reliable solutions, attracting interest from various sectors. The growing emphasis on sustainability and energy resilience also propels the demand for distributed energy systems, highlighting a market shift towards environmentally friendly solutions.
Kenya Micro Turbine Market Opportunities
A range of genuine growth opportunities exists within the Kenya Micro Turbine Market. The rising demand for off-grid solutions, particularly in rural areas, presents a unique opportunity for micro turbine providers. As industries increasingly seek to mitigate energy costs and improve efficiency, investing in micro turbines for cogeneration applications can yield substantial returns. Furthermore, partnerships between public and private sectors can drive research and development, facilitating technology adoption and enhancing market awareness.
Government Initiatives in the Kenya Micro Turbine Market
The Kenyan government has begun to recognize the importance of decentralizing energy sources and integrating renewable technologies. Recent initiatives aim to promote investment in renewable energy, including micro turbines, through various public spending programs and incentives. These initiatives are designed to alleviate some of the regulatory hurdles faced by market players, ultimately fostering a more conducive environment for the development and adoption of micro turbine technologies in the nation.
Future Insights of the Kenya Micro Turbine Market
Looking ahead to the period from 2026 to 2032, the Kenya Micro Turbine Market is positioned for steady growth as the country continues to prioritize energy access and sustainability. Technological advancements will play a critical role, with improvements in efficiency and cost-effectiveness likely to enhance the viability of micro turbines. As awareness increases regarding the benefits of decentralized power solutions, more industries and communities are expected to explore the potential of micro turbines, ultimately leading to a more diversified energy landscape.
Kenya Micro Turbine Market Latest Developments (May 2025 - June 2026)
Recent trends indicate a growing inclination toward adopting micro turbine technology across various sectors in Kenya. Companies are increasingly engaging in collaborations aimed at research and development to improve turbine performance and reduce costs. Additionally, there have been discussions surrounding regulatory reforms that may simplify the process for integrating micro turbines into the broader energy system. These movements suggest a dynamic shift towards recognizing the essential role of micro turbines in achieving energy sustainability in Kenya.
Kenya Micro Turbine Market - Key Attractiveness of the Report
- 10 Years of Market Numbers
- Historical Data Starting from 2022 to 2025
- Base Year: 2025
- Forecast Data until 2032
- Key Performance Indicators Impacting the Market
- Major Upcoming Developments and Projects
Key Highlights of the Report:
- Kenya Micro Turbine Market Outlook
- Market Size of Kenya Micro Turbine Market, 2025
- Forecast of Kenya Micro Turbine Market, 2032
- Historical Data and Forecast of Kenya Micro Turbine Revenues & Volume for the Period 2022-2032F
- Kenya Micro Turbine Market Trend Evolution
- Kenya Micro Turbine Market Drivers and Challenges
- Kenya Micro Turbine Price Trends
- Kenya Micro Turbine Porter's Five Forces
- Kenya Micro Turbine Industry Life Cycle
- Historical Data and Forecast of Kenya Micro Turbine Market Revenues & Volume By Application for the Period 2022-2032F
- Historical Data and Forecast of Kenya Micro Turbine Market Revenues & Volume By Combined Heat & Power (CHP) for the Period 2022-2032F
- Historical Data and Forecast of Kenya Micro Turbine Market Revenues & Volume By Standby Power for the Period 2022-2032F
- Historical Data and Forecast of Kenya Micro Turbine Market Revenues & Volume By Power Rating for the Period 2022-2032F
- Historical Data and Forecast of Kenya Micro Turbine Market Revenues & Volume By 12 kW -50 kW for the Period 2022-2032F
- Historical Data and Forecast of Kenya Micro Turbine Market Revenues & Volume By 50 kW-250 kW for the Period 2022-2032F
- Historical Data and Forecast of Kenya Micro Turbine Market Revenues & Volume By 250 kW-500 kW for the Period 2022-2032F
- Historical Data and Forecast of Kenya Micro Turbine Market Revenues & Volume By End-use for the Period 2022-2032F
- Historical Data and Forecast of Kenya Micro Turbine Market Revenues & Volume By Industrial for the Period 2022-2032F
- Historical Data and Forecast of Kenya Micro Turbine Market Revenues & Volume By Commercial for the Period 2022-2032F
- Historical Data and Forecast of Kenya Micro Turbine Market Revenues & Volume By Residential for the Period 2022-2032F
- Kenya Micro Turbine Import Export Trade Statistics
- Market Opportunity Assessment By Application
- Market Opportunity Assessment By Power Rating
- Market Opportunity Assessment By End-use
- Kenya Micro Turbine Top Companies Market Share
- Kenya Micro Turbine Competitive Benchmarking By Technical and Operational Parameters
- Kenya Micro Turbine Company Profiles
- Kenya Micro Turbine Key Strategic Recommendations
Kenya Micro Turbine Market - Frequently Asked Questions
The market is estimated at USD 205 Million in 2025 and is expected to reach USD 268 Million by 2032, reflecting a CAGR of 3.9% from 2026 to 2032.
The integration of renewable energy is crucial as micro turbines are increasingly recognized for their ability to complement solar and wind systems, providing a more stable and decentralized power supply.
Companies often struggle with high initial costs, regulatory complexities, and limited market awareness among potential customers, which can inhibit investments in micro turbine systems.
Government policy is pivotal in shaping the micro turbine market, as it influences investment opportunities, regulatory frameworks, and incentives aimed at fostering renewable energy solutions.
A lack of skilled manpower for maintenance and operation poses significant barriers, as the effectiveness and reliability of micro turbines depend heavily on qualified personnel to manage these systems properly.
6Wresearch actively monitors the Kenya Micro Turbine Market and publishes its comprehensive annual report, highlighting emerging trends, growth drivers, revenue analysis, and forecast outlook. Our insights help businesses to make data-backed strategic decisions with ongoing market dynamics. Our analysts track relevent industries related to the Kenya Micro Turbine Market, allowing our clients with actionable intelligence and reliable forecasts tailored to emerging regional needs.
Yes, we provide customisation as per your requirements. To learn more, feel free to contact us on sales@6wresearch.com
1 Executive Summary |
2 Introduction |
2.1 Key Highlights of the Report |
2.2 Report Description |
2.3 Market Scope & Segmentation |
2.4 Research Methodology |
2.5 Assumptions |
3 Kenya Micro Turbine Market Overview |
3.1 Kenya Country Macro Economic Indicators |
3.2 Kenya Micro Turbine Market Revenues & Volume, 2022 & 2032F |
3.3 Kenya Micro Turbine Market - Industry Life Cycle |
3.4 Kenya Micro Turbine Market - Porter's Five Forces |
3.5 Kenya Micro Turbine Market Revenues & Volume Share, By Form, 2022 & 2032F |
3.6 Kenya Micro Turbine Market Revenues & Volume Share, By Power Rating, 2022 & 2032F |
3.7 Kenya Micro Turbine Market Revenues & Volume Share, By End-use, 2022 & 2032F |
4 Kenya Micro Turbine Market Dynamics |
4.1 Impact Analysis |
4.2 Market Drivers |
4.3 Market Restraints |
5 Kenya Micro Turbine Market Trends |
6 Kenya Micro Turbine Market, By Types |
6.1 Kenya Micro Turbine Market, By Application |
6.1.1 Overview and Analysis |
6.1.2 Kenya Micro Turbine Market Revenues & Volume, By Application, 2022-2032F |
6.1.3 Kenya Micro Turbine Market Revenues & Volume, By Combined Heat & Power (CHP), 2022-2032F |
6.1.4 Kenya Micro Turbine Market Revenues & Volume, By Standby Power, 2022-2032F |
6.2 Kenya Micro Turbine Market, By Power Rating |
6.2.1 Overview and Analysis |
6.2.2 Kenya Micro Turbine Market Revenues & Volume, By 12 kW -50 kW, 2022-2032F |
6.2.3 Kenya Micro Turbine Market Revenues & Volume, By 50 kW-250 kW, 2022-2032F |
6.2.4 Kenya Micro Turbine Market Revenues & Volume, By 250 kW-500 kW, 2022-2032F |
6.3 Kenya Micro Turbine Market, By End-use |
6.3.1 Overview and Analysis |
6.3.2 Kenya Micro Turbine Market Revenues & Volume, By Industrial, 2022-2032F |
6.3.3 Kenya Micro Turbine Market Revenues & Volume, By Commercial, 2022-2032F |
6.3.4 Kenya Micro Turbine Market Revenues & Volume, By Residential, 2022-2032F |
7 Kenya Micro Turbine Market Import-Export Trade Statistics |
7.1 Kenya Micro Turbine Market Export to Major Countries |
7.2 Kenya Micro Turbine Market Imports from Major Countries |
8 Kenya Micro Turbine Market Key Performance Indicators |
9 Kenya Micro Turbine Market - Opportunity Assessment |
9.1 Kenya Micro Turbine Market Opportunity Assessment, By Application, 2022 & 2032F |
9.2 Kenya Micro Turbine Market Opportunity Assessment, By Power Rating, 2022 & 2032F |
9.3 Kenya Micro Turbine Market Opportunity Assessment, By End-use, 2022 & 2032F |
10 Kenya Micro Turbine Market - Competitive Landscape |
10.1 Kenya Micro Turbine Market Revenue Share, By Companies, 2025 |
10.2 Kenya Micro Turbine Market Competitive Benchmarking, By Operating and Technical Parameters |
11 Company Profiles |
12 Recommendations |
13 Disclaimer |
Global Go To Market Strategy - 2030
Export potential enables firms to identify high-growth global markets with greater confidence by combining advanced trade intelligence with a structured quantitative methodology. The framework analyzes emerging demand trends and country-level import patterns while integrating macroeconomic and trade datasets such as GDP and population forecasts, bilateral import–export flows, tariff structures, elasticity differentials between developed and developing economies, geographic distance, and import demand projections. Using weighted trade values from 2020–2024 as the base period to project country-to-country export potential for 2030, these inputs are operationalized through calculated drivers such as gravity model parameters, tariff impact factors, and projected GDP per-capita growth. Through an analysis of hidden potentials, demand hotspots, and market conditions that are most favorable to success, this method enables firms to focus on target countries, maximize returns, and global expansion with data, backed by accuracy.
By factoring in the projected importer demand gap that is currently unmet and could be potential opportunity, it identifies the potential for the Exporter (Country) among 190 countries, against the general trade analysis, which identifies the biggest importer or exporter.
To discover high-growth global markets and optimize your business strategy:
Click Here
Pricing
- Single User License$ 1,995
- Department License$ 2,400
- Site License$ 3,120
- Global License$ 3,795

Leadership Perspectives from Industry Events
Search
Thought Leadership and Analyst Meet


Our Clients
6WResearch In News
- India Air Conditioner Market Set for Strong Rebound in 2026 After Weather-Led Correction and GST-Driven Recovery: 6Wresearch
- ADAS in India: How Automatic Emergency Braking, Blind Spot Detection & Driver Monitoring are Transforming Road Safety
- Doha a strategic location for EV manufacturing hub: IPA Qatar
- Demand for luxury TVs surging in the GCC, says Samsung
- Empowering Growth: The Thriving Journey of Bangladesh’s Cable Industry
- Demand for luxury TVs surging in the GCC, says Samsung
Latest Reports
- Poland Fire Protection Systems Market (2026-2032)
- Cape Verde Portable Hand-Thrown Extinguisher Market (2026-2032)
- Canada Portable Hand-Thrown Extinguisher Market (2026-2032)
- Cameroon Portable Hand-Thrown Extinguisher Market (2026-2032)
- Burundi Portable Hand-Thrown Extinguisher Market (2026-2032)
- Burkina Faso Portable Hand-Thrown Extinguisher Market (2026-2032)
- Bulgaria Portable Hand-Thrown Extinguisher Market (2026-2032)
- Brunei Portable Hand-Thrown Extinguisher Market (2026-2032)
- Botswana Portable Hand-Thrown Extinguisher Market (2026-2032)
- Bosnia and Herzegovina Portable Hand-Thrown Extinguisher Market (2026-2032)
Industry Events and Analyst Meet

HIMTEX 2026

India Refining Summit 2026

India EV Show 2026

EV tech India Expo 2026

Auto Tech Asia 2026
Whitepaper
- Middle East & Africa Commercial Security Market Click here to view more.
- Middle East & Africa Fire Safety Systems & Equipment Market Click here to view more.
- GCC Drone Market Click here to view more.
- Middle East Lighting Fixture Market Click here to view more.
- GCC Physical & Perimeter Security Market Click here to view more.