Kenya Milk Protein Market (2026-2032) Outlook | Value, Trends, Forecast, Size, Analysis, Industry, Companies, Growth, Share & Revenue
Market Forecast By Type (Whey Protein Isolates, Whey Protein Concentrates, Milk Protein Hydrolysates, Milk Protein Isolates, Milk Protein Concentrates, Others), By Form (Liquid, Dry), By Applications (Dairy Products, Sports Nutrition, Infant Formula, Others) And Competitive Landscape
| Product Code: ETC102609 | Publication Date: Jun 2021 | Updated Date: Jun 2026 | Product Type: Report | |
| Publisher: 6Wresearch | Author: Ravi Bhandari | No. of Pages: 70 | No. of Figures: 35 | No. of Tables: 5 |
Kenya Milk Protein Market Size, Share & Growth Rate
The Kenya Milk Protein Market was estimated at USD 376 Million in 2025 and is projected to reach USD 493 Million by 2032, growing at a CAGR of 3.9% from 2026 to 2032. This upward trajectory is primarily fueled by increasing health consciousness among consumers who are actively seeking nutritional supplements and functional food products. The rise of dietary trends focusing on protein-enriched diets, especially among athletes and fitness enthusiasts, is also significantly contributing to this growth.
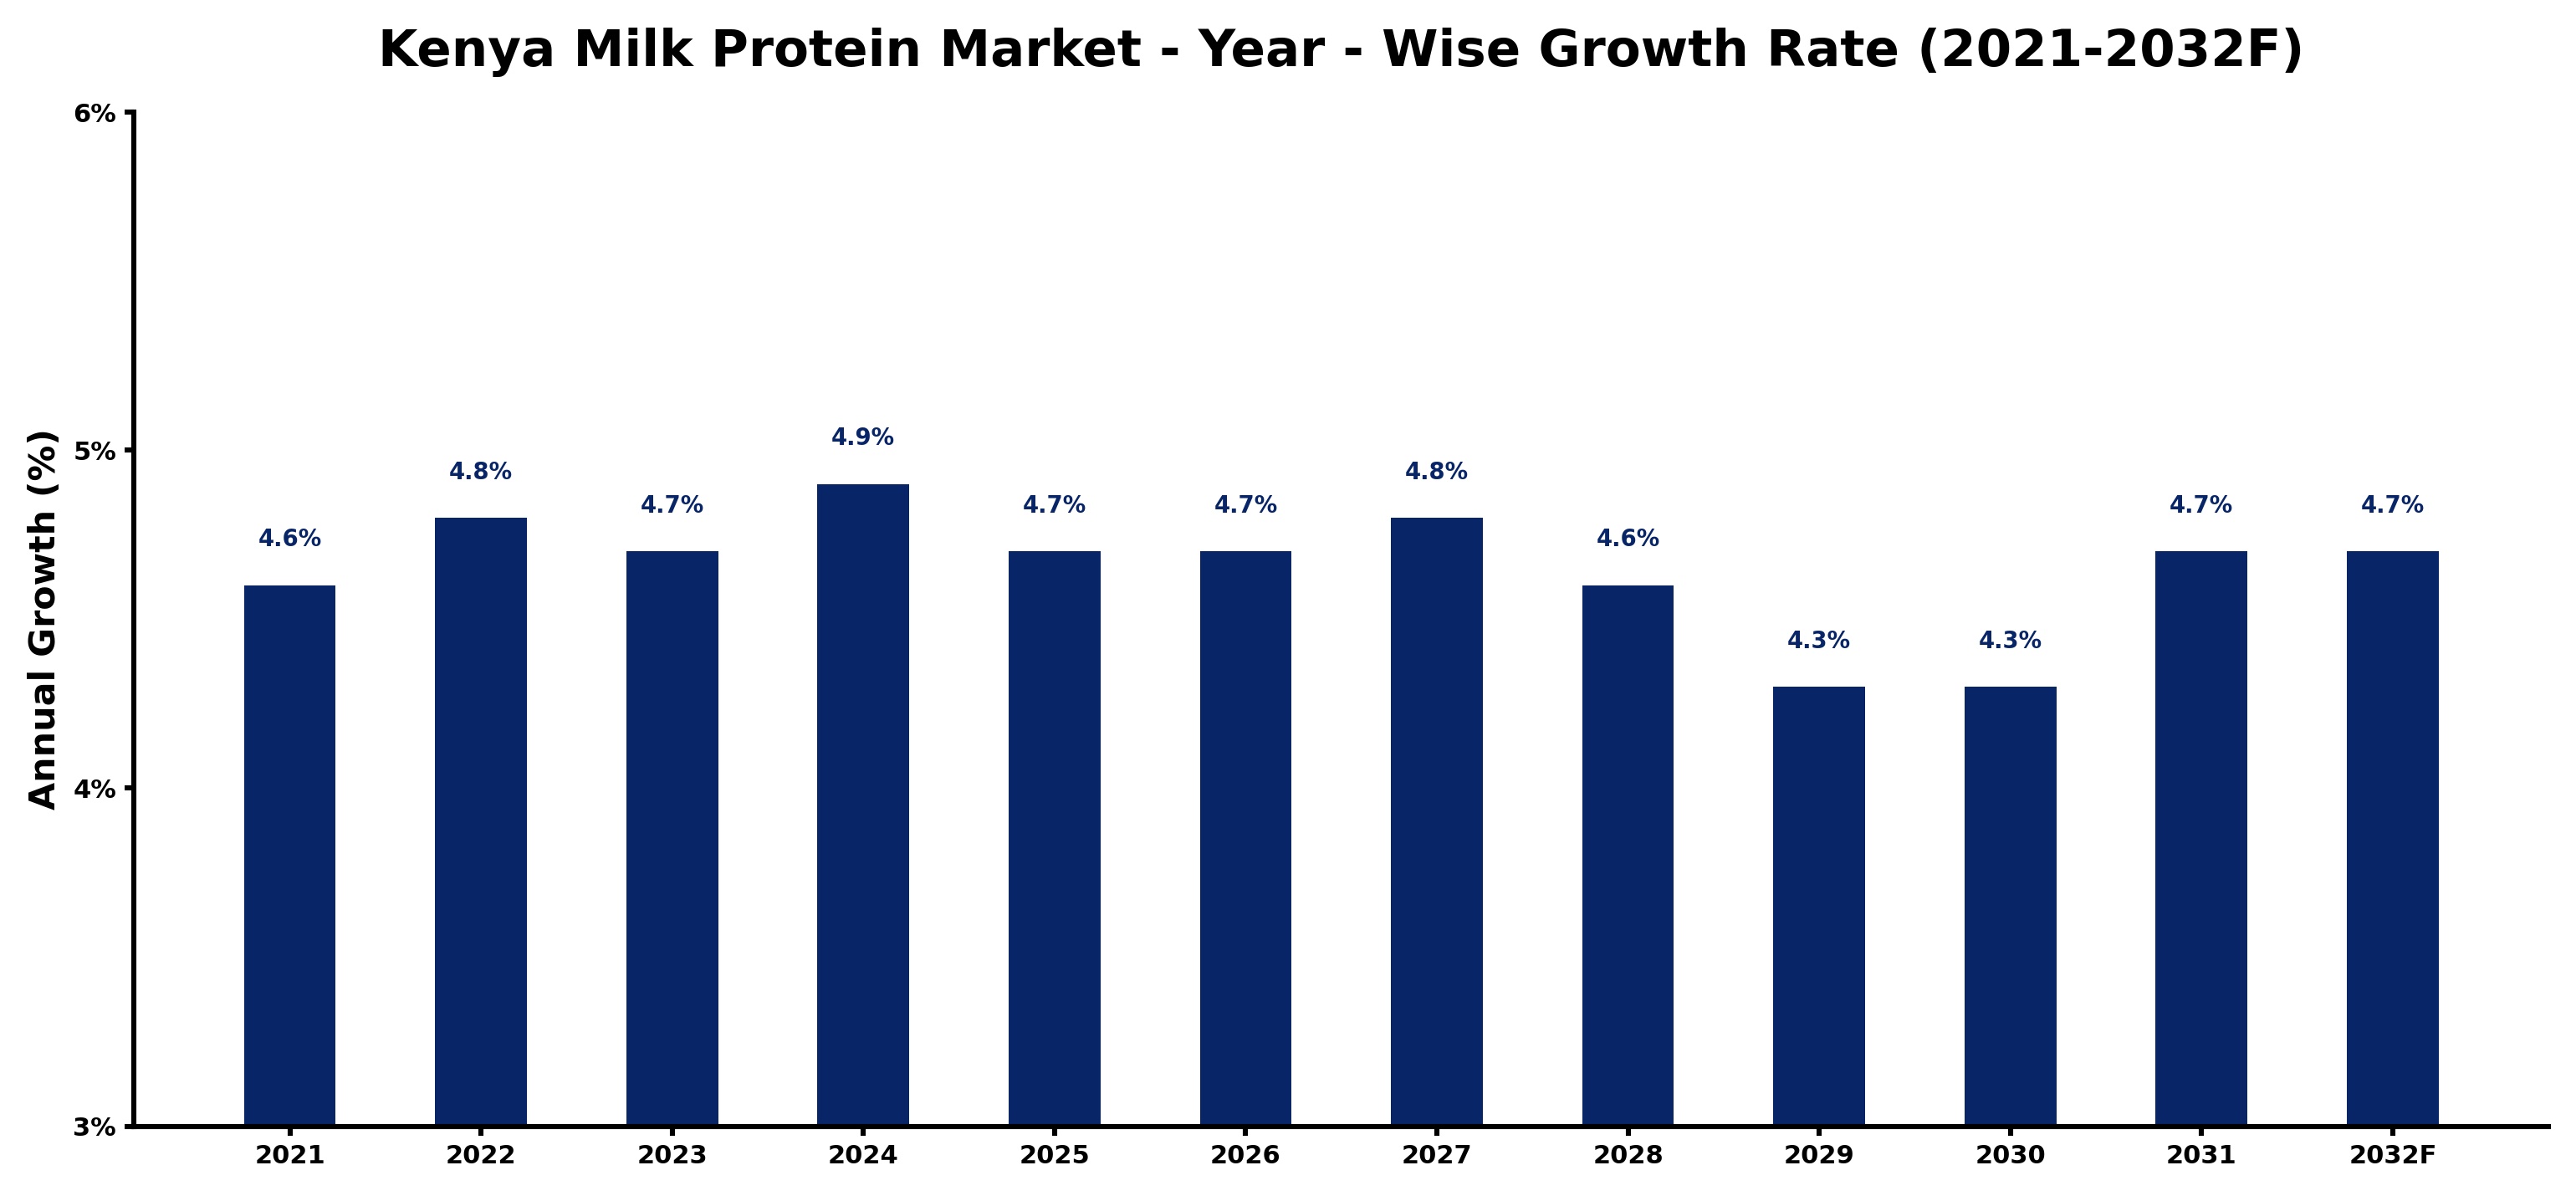
Kenya Milk Protein Market Growth Rate Analysis (2021-2032)
The Kenya Milk Protein market showed a steady upward trajectory, with growth rates fluctuating between 4.6% and 4.9% from 2021 to 2032. In 2021, the market expanded by 4.6%, primarily driven by increasing consumer demand for high-protein diets and a rising health consciousness among Kenyans. Continued investments in dairy infrastructure and technology improvements facilitated incremental growth, with a notable jump to 4.9% in 2024. However, the growth rate dipped slightly to 4.3% in both 2029 and 2030, as global economic pressures and shifting consumer preferences toward plant-based alternatives posed challenges. Overall, the Kenyan government's supportive policies for dairy farmers have fostered resilience, enabling a recovery and return to a stable growth pattern by 2032.
Kenya Milk Protein Market Year-wise Growth Rate and Key Drivers
This graph highlights how the Kenya Milk Protein Market has steadily grown over the past five years, supported by major growth factors.
The table below presents the year‑wise growth rates along with the key drivers influencing the market
| Year | Growth Rate | Major Drivers |
| 2021 | 4.6% | Milk processing facilities upgraded to boost protein extraction efficiency |
| 2022 | 4.8% | Advanced processing technology boosts milk protein production efficiency |
| 2023 | 4.7% | Domestic dairy processing upgrades boosted milk protein production capacity |
| 2024 | 4.9% | Dairy farm consolidation boosts milk protein production efficiency in Kenya |
| 2025 | 4.7% | Dairy sector upgrades boosted protein powder production efficiency |
| 2026 | 4.7% | Local dairy processing upgrades enhanced milk protein extraction efficiency |
| 2027 | 4.8% | Milk processing facility upgrades boosted protein powder production capacity |
| 2028 | 4.6% | Domestic dairy processing plant expansions boost milk protein output |
| 2029 | 4.3% | New processing plants enhance milk protein production capacity efficiency |
| 2030 | 4.3% | Higher dairy processing capacity boosts protein concentrate production efficiency |
| 2031 | 4.7% | Technology integration in processing plants enhanced milk protein yield efficiency |
| 2032 | 4.7% | Reopened cafes boosted demand for locally sourced milk proteins |
Note - Market size estimations and growth projections presented in this report are based on 6Wresearch’s advanced forecasting approach, validated with industry datasets as of June 2026.
Kenya Milk Protein Market Synopsis
The demand for milk protein in Kenya is propelled by a burgeoning awareness of its health benefits, which has led to a higher consumption of dairy products such as yogurt and cheese. Furthermore, the growing trend of sports nutrition is fostering a robust market for dietary supplements rich in milk protein.
Supply chain challenges, including limited domestic production capacity and reliance on imports, are particularly pronounced in the milk protein sector. This dependence hampers the ability to meet the rising consumer demand efficiently and sustainably, emphasizing the need for improvements in local dairy production and processing capabilities.
Kenya Milk Protein Market Key Takeaways
- The market is experiencing strong growth due to increased health awareness and demand for protein-rich products.
- There is a significant focus on sports nutrition and dietary supplements among health-conscious consumers.
- Challenges related to quality control and supply chain management hinder market expansion.
- Government policies and initiatives are crucial for improving local production and ensuring food safety.
- Investment opportunities are emerging as the market evolves to meet consumer preferences and regulatory standards.
Evaluation of Restraints in Kenya Milk Protein Market
Despite the positive growth outlook for the Kenya milk protein market, several restraints are limiting its full potential. A prominent concern is the limited domestic production capacity, which forces reliance on imported protein supplements. This dependency can lead to volatility in prices and supply disruptions. Additionally, quality control issues in local processing facilities further complicate the ability to ensure a consistent product that meets consumer expectations. The challenges of adhering to food safety standards and managing consumer awareness around protein sources also present significant hurdles for market players.
Kenya Milk Protein Market Trends
Current trends indicate a rising consumer preference for functional foods that incorporate milk protein due to its health benefits. Additionally, the surge in online shopping platforms is facilitating easier access to dietary supplements, expanding the market reach. Technological advancements in dairy processing are also enabling better quality control and higher nutritional content in milk protein products, thus attracting more health-conscious consumers.
Kenya Milk Protein Market Opportunities
The Kenya milk protein market presents various opportunities for growth and investment, particularly in enhancing local dairy production capacity. Expanding the range of protein-enriched dairy products and catering to niche markets such as organic and lactose-free options can capture a more diverse consumer base. Moreover, leveraging e-commerce platforms can significantly increase market penetration and accessibility for consumers.
Government Initiatives in the Kenya Milk Protein Market
Government initiatives aimed at boosting local dairy production are critical for the Kenya milk protein market. Policies promoting food safety standards and quality assurance in processing facilities are essential for consumer trust. Additionally, public investments in agricultural infrastructure and incentives for dairy farmers can enhance local supply chains, making the market more resilient to external shocks.
Future Insights of the Kenya Milk Protein Market
Looking ahead to 2026-2032, the Kenya milk protein market is set to experience sustained growth driven by evolving consumer preferences toward health and nutrition. As awareness of the benefits of protein consumption continues to rise, companies will need to innovate and diversify their offerings. A focus on sustainability and product transparency will also play a vital role in gaining consumer loyalty in an increasingly competitive landscape.
Kenya Milk Protein Market Latest Developments (May 2025 - June 2026)
Recent developments in the Kenya milk protein market have highlighted a push toward more rigorous quality control measures and enhanced processing technologies. Industry stakeholders are increasingly adopting practices that align with international food safety standards. Furthermore, there is a noticeable increase in marketing efforts focused on educating consumers about the nutritional benefits of milk protein, thus fostering greater acceptance and demand.
Kenya Milk Protein Market - Key Attractiveness of the Report
- 10 Years of Market Numbers
- Historical Data Starting from 2022 to 2025
- Base Year: 2025
- Forecast Data until 2032
- Key Performance Indicators Impacting the Market
- Major Upcoming Developments and Projects
Key Highlights of the Report:
- Kenya Milk Protein Market Outlook
- Market Size of Kenya Milk Protein Market, 2025
- Forecast of Kenya Milk Protein Market, 2032
- Historical Data and Forecast of Kenya Milk Protein Revenues & Volume for the Period 2022-2032F
- Kenya Milk Protein Market Trend Evolution
- Kenya Milk Protein Market Drivers and Challenges
- Kenya Milk Protein Price Trends
- Kenya Milk Protein Porter's Five Forces
- Kenya Milk Protein Industry Life Cycle
- Historical Data and Forecast of Kenya Milk Protein Market Revenues & Volume By Type for the Period 2022-2032F
- Historical Data and Forecast of Kenya Milk Protein Market Revenues & Volume By Whey Protein Isolates for the Period 2022-2032F
- Historical Data and Forecast of Kenya Milk Protein Market Revenues & Volume By Whey Protein Concentrates for the Period 2022-2032F
- Historical Data and Forecast of Kenya Milk Protein Market Revenues & Volume By Milk Protein Hydrolysates for the Period 2022-2032F
- Historical Data and Forecast of Kenya Milk Protein Market Revenues & Volume By Milk Protein Isolates for the Period 2022-2032F
- Historical Data and Forecast of Kenya Milk Protein Market Revenues & Volume By Milk Protein Concentrates for the Period 2022-2032F
- Historical Data and Forecast of Kenya Milk Protein Market Revenues & Volume By Others for the Period 2022-2032F
- Historical Data and Forecast of Kenya Milk Protein Market Revenues & Volume By Form for the Period 2022-2032F
- Historical Data and Forecast of Kenya Milk Protein Market Revenues & Volume By Liquid for the Period 2022-2032F
- Historical Data and Forecast of Kenya Milk Protein Market Revenues & Volume By Dry for the Period 2022-2032F
- Historical Data and Forecast of Kenya Milk Protein Market Revenues & Volume By Applications for the Period 2022-2032F
- Historical Data and Forecast of Kenya Milk Protein Market Revenues & Volume By Dairy Products for the Period 2022-2032F
- Historical Data and Forecast of Kenya Milk Protein Market Revenues & Volume By Sports Nutrition for the Period 2022-2032F
- Historical Data and Forecast of Kenya Milk Protein Market Revenues & Volume By Infant Formula for the Period 2022-2032F
- Historical Data and Forecast of Kenya Milk Protein Market Revenues & Volume By Others for the Period 2022-2032F
- Kenya Milk Protein Import Export Trade Statistics
- Market Opportunity Assessment By Type
- Market Opportunity Assessment By Form
- Market Opportunity Assessment By Applications
- Kenya Milk Protein Top Companies Market Share
- Kenya Milk Protein Competitive Benchmarking By Technical and Operational Parameters
- Kenya Milk Protein Company Profiles
- Kenya Milk Protein Key Strategic Recommendations
Kenya Milk Protein Market - Frequently Asked Questions
Increasing consumer awareness about the health benefits of milk protein, along with rising demand for nutritional supplements, are significant factors driving this growth.
The Kenya Milk Protein Market was estimated at USD 376 Million in 2025 and is projected to reach USD 493 Million by 2032, growing at a CAGR of 3.9% from 2026 to 2032.
Government initiatives focused on improving dairy production capacity and enforcing food safety standards are critical for the stability and growth of the Kenya milk protein market.
Yes, the focus on functional foods and the increasing shift towards online shopping for dietary supplements are shaping the demand dynamics in this market.
Market players encounter issues such as limited domestic production capacity, quality control problems in processing facilities, and concerns regarding food safety standards.
6Wresearch actively monitors the Kenya Milk Protein Market and publishes its comprehensive annual report, highlighting emerging trends, growth drivers, revenue analysis, and forecast outlook. Our insights help businesses to make data-backed strategic decisions with ongoing market dynamics. Our analysts track relevent industries related to the Kenya Milk Protein Market, allowing our clients with actionable intelligence and reliable forecasts tailored to emerging regional needs.
Yes, we provide customisation as per your requirements. To learn more, feel free to contact us on sales@6wresearch.com
1 Executive Summary |
2 Introduction |
2.1 Key Highlights of the Report |
2.2 Report Description |
2.3 Market Scope & Segmentation |
2.4 Research Methodology |
2.5 Assumptions |
3 Kenya Milk Protein Market Overview |
3.1 Kenya Country Macro Economic Indicators |
3.2 Kenya Milk Protein Market Revenues & Volume, 2022 & 2032F |
3.3 Kenya Milk Protein Market - Industry Life Cycle |
3.4 Kenya Milk Protein Market - Porter's Five Forces |
3.5 Kenya Milk Protein Market Revenues & Volume Share, By Type, 2022 & 2032F |
3.6 Kenya Milk Protein Market Revenues & Volume Share, By Form, 2022 & 2032F |
3.7 Kenya Milk Protein Market Revenues & Volume Share, By Applications, 2022 & 2032F |
4 Kenya Milk Protein Market Dynamics |
4.1 Impact Analysis |
4.2 Market Drivers |
4.3 Market Restraints |
5 Kenya Milk Protein Market Trends |
6 Kenya Milk Protein Market, By Types |
6.1 Kenya Milk Protein Market, By Type |
6.1.1 Overview and Analysis |
6.1.2 Kenya Milk Protein Market Revenues & Volume, By Type, 2022-2032F |
6.1.3 Kenya Milk Protein Market Revenues & Volume, By Whey Protein Isolates, 2022-2032F |
6.1.4 Kenya Milk Protein Market Revenues & Volume, By Whey Protein Concentrates, 2022-2032F |
6.1.5 Kenya Milk Protein Market Revenues & Volume, By Milk Protein Hydrolysates, 2022-2032F |
6.1.6 Kenya Milk Protein Market Revenues & Volume, By Milk Protein Isolates, 2022-2032F |
6.1.7 Kenya Milk Protein Market Revenues & Volume, By Milk Protein Concentrates, 2022-2032F |
6.1.8 Kenya Milk Protein Market Revenues & Volume, By Others, 2022-2032F |
6.2 Kenya Milk Protein Market, By Form |
6.2.1 Overview and Analysis |
6.2.2 Kenya Milk Protein Market Revenues & Volume, By Liquid, 2022-2032F |
6.2.3 Kenya Milk Protein Market Revenues & Volume, By Dry, 2022-2032F |
6.3 Kenya Milk Protein Market, By Applications |
6.3.1 Overview and Analysis |
6.3.2 Kenya Milk Protein Market Revenues & Volume, By Dairy Products, 2022-2032F |
6.3.3 Kenya Milk Protein Market Revenues & Volume, By Sports Nutrition, 2022-2032F |
6.3.4 Kenya Milk Protein Market Revenues & Volume, By Infant Formula, 2022-2032F |
6.3.5 Kenya Milk Protein Market Revenues & Volume, By Others, 2022-2032F |
7 Kenya Milk Protein Market Import-Export Trade Statistics |
7.1 Kenya Milk Protein Market Export to Major Countries |
7.2 Kenya Milk Protein Market Imports from Major Countries |
8 Kenya Milk Protein Market Key Performance Indicators |
9 Kenya Milk Protein Market - Opportunity Assessment |
9.1 Kenya Milk Protein Market Opportunity Assessment, By Type, 2022 & 2032F |
9.2 Kenya Milk Protein Market Opportunity Assessment, By Form, 2022 & 2032F |
9.3 Kenya Milk Protein Market Opportunity Assessment, By Applications, 2022 & 2032F |
10 Kenya Milk Protein Market - Competitive Landscape |
10.1 Kenya Milk Protein Market Revenue Share, By Companies, 2025 |
10.2 Kenya Milk Protein Market Competitive Benchmarking, By Operating and Technical Parameters |
11 Company Profiles |
12 Recommendations |
13 Disclaimer |
Global Go To Market Strategy - 2030
Export potential enables firms to identify high-growth global markets with greater confidence by combining advanced trade intelligence with a structured quantitative methodology. The framework analyzes emerging demand trends and country-level import patterns while integrating macroeconomic and trade datasets such as GDP and population forecasts, bilateral import–export flows, tariff structures, elasticity differentials between developed and developing economies, geographic distance, and import demand projections. Using weighted trade values from 2020–2024 as the base period to project country-to-country export potential for 2030, these inputs are operationalized through calculated drivers such as gravity model parameters, tariff impact factors, and projected GDP per-capita growth. Through an analysis of hidden potentials, demand hotspots, and market conditions that are most favorable to success, this method enables firms to focus on target countries, maximize returns, and global expansion with data, backed by accuracy.
By factoring in the projected importer demand gap that is currently unmet and could be potential opportunity, it identifies the potential for the Exporter (Country) among 190 countries, against the general trade analysis, which identifies the biggest importer or exporter.
To discover high-growth global markets and optimize your business strategy:
Click Here
Pricing
- Single User License$ 1,995
- Department License$ 2,400
- Site License$ 3,120
- Global License$ 3,795

Leadership Perspectives from Industry Events
Search
Thought Leadership and Analyst Meet


Our Clients
6WResearch In News
- India Air Conditioner Market Set for Strong Rebound in 2026 After Weather-Led Correction and GST-Driven Recovery: 6Wresearch
- ADAS in India: How Automatic Emergency Braking, Blind Spot Detection & Driver Monitoring are Transforming Road Safety
- Doha a strategic location for EV manufacturing hub: IPA Qatar
- Demand for luxury TVs surging in the GCC, says Samsung
- Empowering Growth: The Thriving Journey of Bangladesh’s Cable Industry
- Demand for luxury TVs surging in the GCC, says Samsung
Latest Reports
- Poland Fire Protection Systems Market (2026-2032)
- Cape Verde Portable Hand-Thrown Extinguisher Market (2026-2032)
- Canada Portable Hand-Thrown Extinguisher Market (2026-2032)
- Cameroon Portable Hand-Thrown Extinguisher Market (2026-2032)
- Burundi Portable Hand-Thrown Extinguisher Market (2026-2032)
- Burkina Faso Portable Hand-Thrown Extinguisher Market (2026-2032)
- Bulgaria Portable Hand-Thrown Extinguisher Market (2026-2032)
- Brunei Portable Hand-Thrown Extinguisher Market (2026-2032)
- Botswana Portable Hand-Thrown Extinguisher Market (2026-2032)
- Bosnia and Herzegovina Portable Hand-Thrown Extinguisher Market (2026-2032)
Industry Events and Analyst Meet

HIMTEX 2026

India Refining Summit 2026

India EV Show 2026

EV tech India Expo 2026

Auto Tech Asia 2026
Whitepaper
- Middle East & Africa Commercial Security Market Click here to view more.
- Middle East & Africa Fire Safety Systems & Equipment Market Click here to view more.
- GCC Drone Market Click here to view more.
- Middle East Lighting Fixture Market Click here to view more.
- GCC Physical & Perimeter Security Market Click here to view more.