Kenya Nano Copper Oxide Market (2026-2032) Outlook | Share, Industry, Trends, Size, Revenue, Forecast, Companies, Analysis, Value & Growth
Market Forecast By Type (Powder, Dispersed), By Application (Electricals & Electronics, Paints & Coatings, Catalysts, Energy Storage) And Competitive Landscape
| Product Code: ETC197702 | Publication Date: May 2022 | Updated Date: Jun 2026 | Product Type: Market Research Report | |
| Publisher: 6Wresearch | Author: Summon Dutta | No. of Pages: 60 | No. of Figures: 40 | No. of Tables: 7 |
Kenya Nano Copper Oxide Market Size, Share & Growth Rate
The Kenya Nano Copper Oxide Market was estimated at USD 851 Million in 2025 and is projected to reach USD 1239 Million by 2032, growing at a CAGR of 5.5% from 2026 to 2032. This growth trajectory is being driven by the increasing demand for nano copper oxide in high-value industries, particularly electronics and healthcare. The ongoing adoption of nanotechnology and heightened awareness of its benefits across diverse sectors are significant factors contributing to this upward trend.
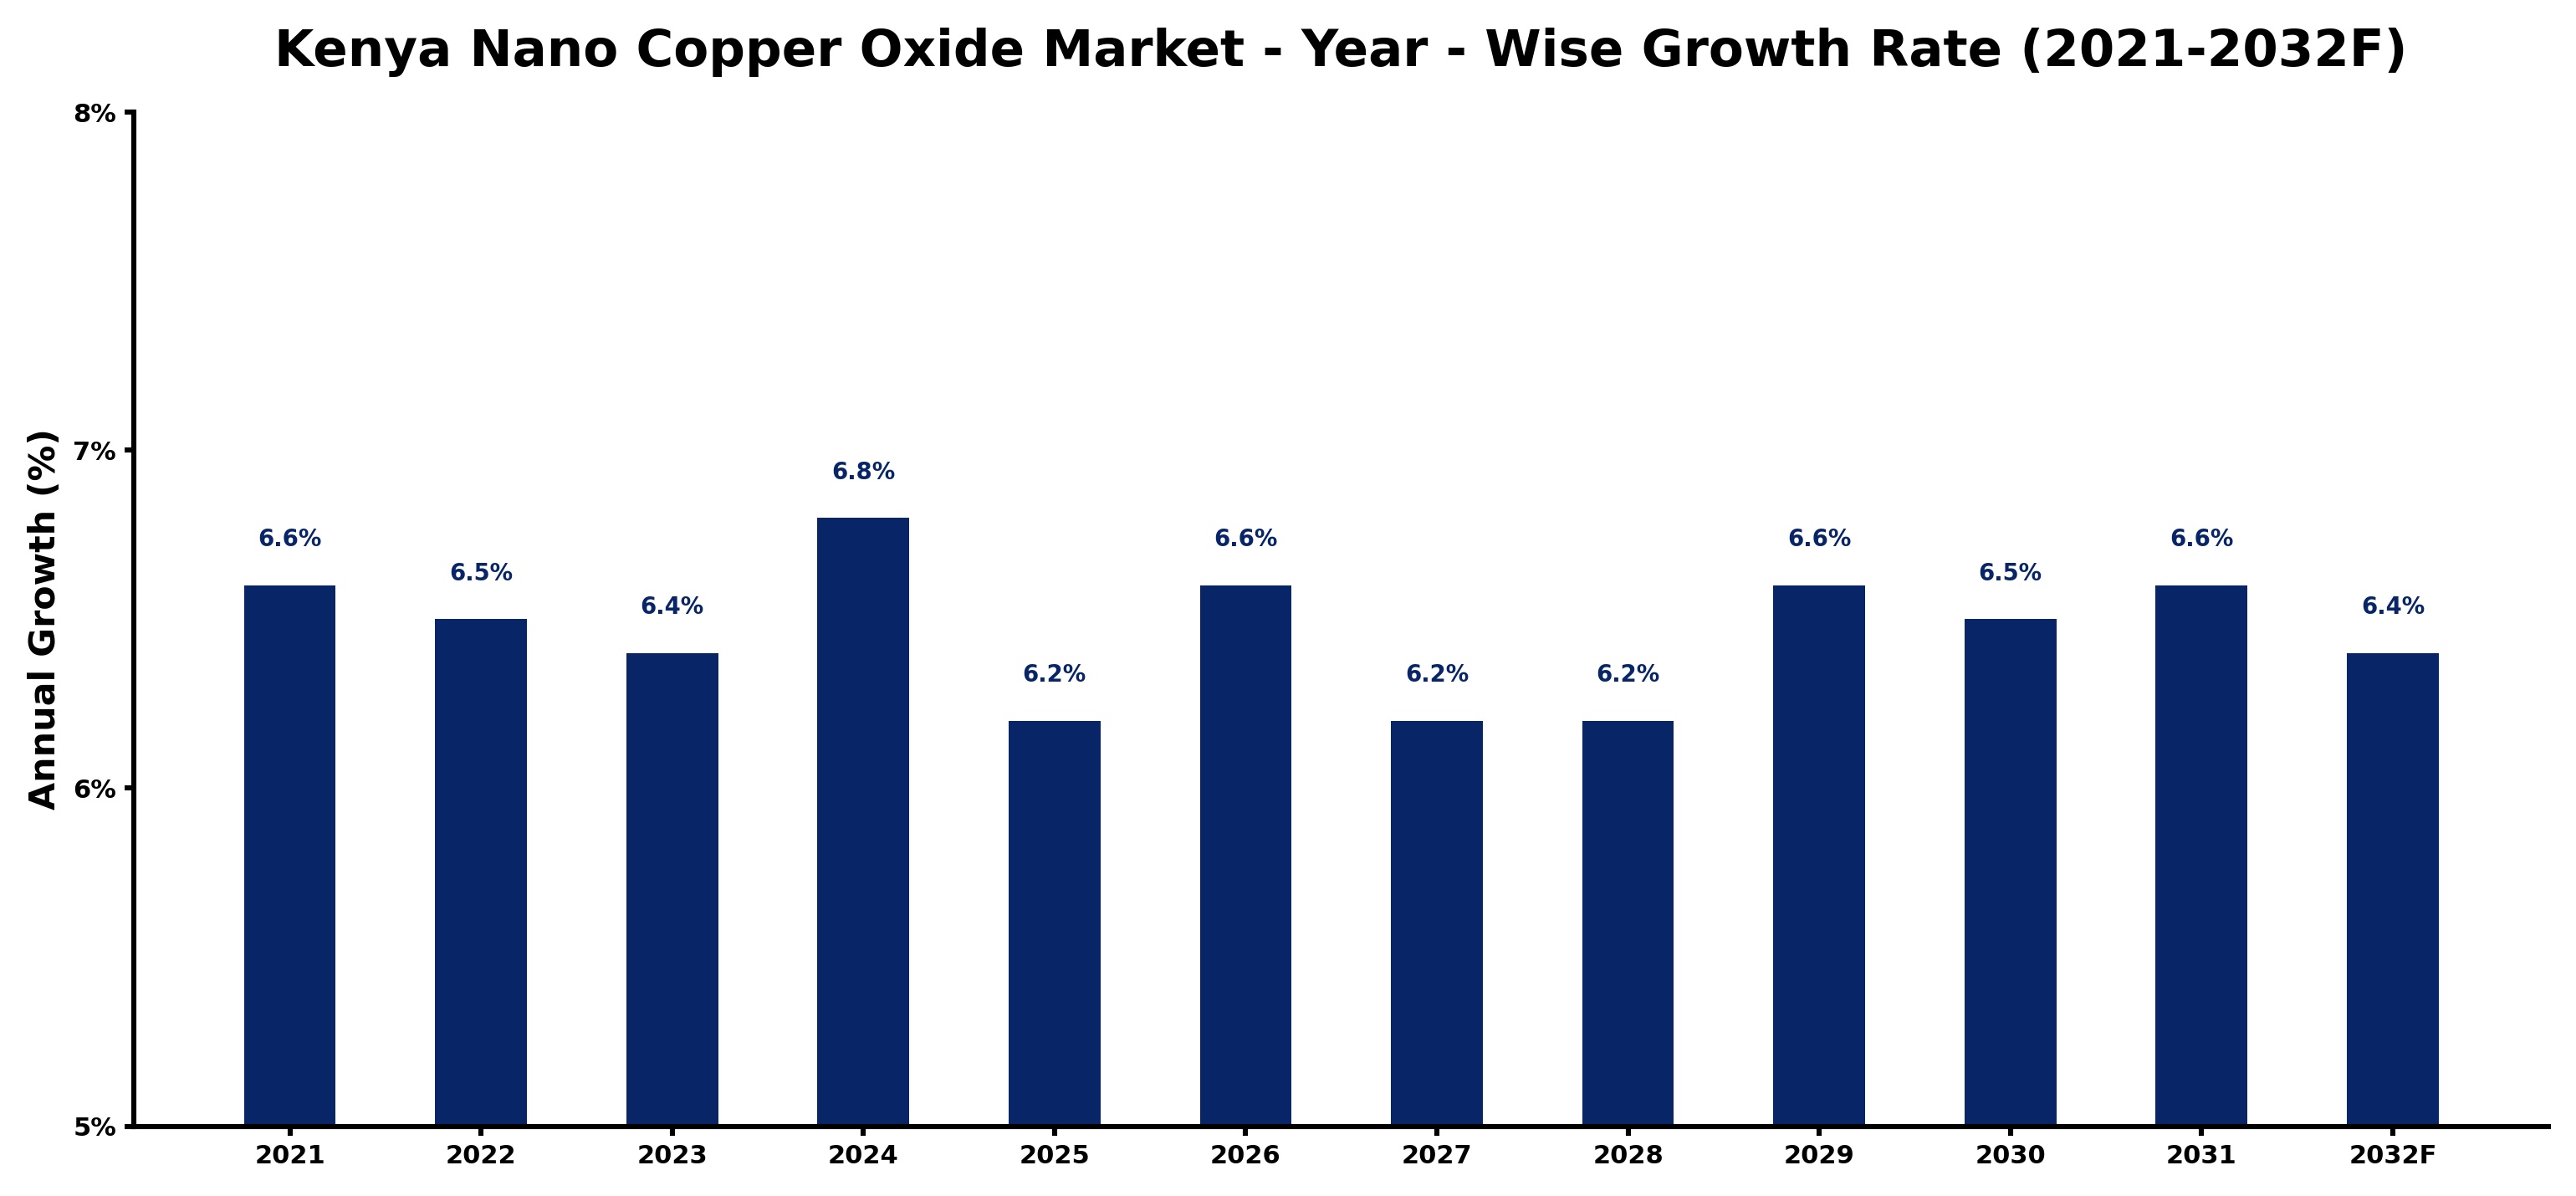
Kenya Nano Copper Oxide Market Growth Rate Analysis (2021-2032)
The Kenya Nano Copper Oxide market reflects a stable growth trend characterized by a consistent yearly increase, ranging from 6.4% to 6.8% during the period of 2021 to 2032. The growth observed in 2024, with a peak of 6.8%, is attributed to heightened demand in sectors such as electronics and renewable energy technologies, driven by the government's commitment to energy transition and industrial innovation. However, the slight dip to 6.2% in 2025 and 2027 suggests temporary market adjustments as companies adapt to fluctuating raw material costs and evolving regulatory frameworks. Overall, the steady consumer demand, coupled with increased investments in digitalization and infrastructure, facilitates sustained development in this dynamic market.
Kenya Nano Copper Oxide Market Year-wise Growth Rate and Key Drivers
This graph highlights how the Kenya Nano Copper Oxide Market has steadily grown over the past five years, supported by major growth factors.
The table below presents the year‑wise growth rates along with the key drivers influencing the market
| Year | Growth Rate | Major Drivers |
| 2021 | 6.6% | Increased industrial applications emerged |
| 2022 | 6.5% | Rising demand for advanced materials |
| 2023 | 6.4% | Technological advancements enhanced production |
| 2024 | 6.8% | Growing awareness of health benefits |
| 2025 | 6.2% | Expansion in renewable energy sector |
| 2026 | 6.6% | Investment in research and development |
| 2027 | 6.2% | Emerging markets adopted new technologies |
| 2028 | 6.2% | Sustainability trends drove market growth |
| 2029 | 6.6% | Collaboration with academic institutions increased |
| 2030 | 6.5% | Government initiatives supported innovation |
| 2031 | 6.6% | Consumer preferences shifted towards quality |
| 2032 | 6.4% | Global partnerships enhanced market reach |
Note - Market size estimations and growth projections presented in this report are based on 6Wresearch’s advanced forecasting approach, validated with industry datasets as of June 2026.
Kenya Nano Copper Oxide Market Synopsis
The Kenya Nano Copper Oxide Market has gained recent momentum due to burgeoning applications in electronics, healthcare, and agriculture. As various industries continue to recognize the advantages of nano copper oxide, the market is expected to transition from initial adoption phases to mainstream integration, reflecting a robust growth potential.
Looking ahead, the market is positioned to expand significantly as research and development initiatives uncover novel applications. The synergy of increasing public interest in sustainable technologies and regulatory support is set to fuel market dynamics, steering it towards a promising future.
Kenya Nano Copper Oxide Market Key Takeaways
- Growing demand across electronics, healthcare, and agriculture sectors is driving market expansion.
- Nano copper oxide’s unique properties facilitate diverse applications, increasing its appeal to various industries.
- Investment in research and development is crucial to uncover new applications and improve product efficacy.
- Increased awareness and education about nanotechnology will enhance market acceptance.
- Government regulations may impact market entry and growth strategies for companies in this space.
Evaluation of Restraints in Kenya Nano Copper Oxide Market
Despite the promising outlook, the Kenya Nano Copper Oxide Market faces several restraints. A key challenge is the limited understanding and awareness of nanotechnology among potential users, which may slow down adoption rates. Concerns regarding safety and environmental impacts of nano materials could also hinder market acceptance. Additionally, infrastructure limitations and regulatory compliance requirements present hurdles for companies looking to establish manufacturing capabilities. As the market evolves, addressing these constraints will be critical for sustainable growth.
Kenya Nano Copper Oxide Market Trends
Current trends in the Kenya Nano Copper Oxide Market reflect a strong inclination towards sustainability and innovation. Companies are increasingly integrating eco-friendly practices in production processes, aligning with global sustainability goals. The electronics industry is actively incorporating nano copper oxide in next-generation devices, enhancing performance with its superior conductivity. Furthermore, the healthcare sector's focus on antimicrobial coatings underscores the growing demand for advanced materials to meet stringent health standards.
Kenya Nano Copper Oxide Market Opportunities
Investment opportunities abound in the Kenya Nano Copper Oxide Market, particularly in the production and application of nano materials. As industries such as agriculture and healthcare recognize the benefits of nano copper oxide, strategic investments in manufacturing facilities and supply chain management are essential. Moreover, aligning product development with sustainable practices presents a lucrative avenue for growth, as market demand shifts towards environmentally friendly solutions.
Government Initiatives in the Kenya Nano Copper Oxide Market
While there are no specific policies directed exclusively at the nano copper oxide market, the Kenyan government promotes a regulatory framework through bodies such as the National Environment Management Authority (NEMA) and the Kenya Bureau of Standards (KEBS). These agencies ensure that manufacturers comply with safety and environmental protocols, indirectly fostering a conducive environment for the growth of advanced materials. Additionally, governmental industrial policies focused on innovation and technology development further bolster the market landscape.
Future Insights of the Kenya Nano Copper Oxide Market
The future outlook for the Kenya Nano Copper Oxide Market appears bright, driven by diverse applications and technological advancements. As industries increasingly pivot toward sustainable practices, the demand for nano copper oxide as an eco-friendly alternative is likely to rise. Continuous research and development efforts are expected to unveil innovative applications that further cement its importance in the market. While price volatility and regulatory considerations may pose challenges, the overall trajectory suggests significant growth potential from 2026 to 2032.
Kenya Nano Copper Oxide Market Latest Developments (May 2025 - June 2026)
Recent developments in the Kenya Nano Copper Oxide Market indicate a rising trend in collaborative research initiatives aimed at enhancing product functionalities. Companies are increasingly investing in partnerships with academic institutions to drive innovation and broaden application scopes. Additionally, heightened public awareness campaigns are being launched to educate various stakeholders about the benefits of nanotechnology, thus paving the way for greater acceptance and integration across industries.
Kenya Nano Copper Oxide Market - Key Attractiveness of the Report
- 10 Years of Market Numbers
- Historical Data Starting from 2022 to 2025
- Base Year: 2025
- Forecast Data until 2032
- Key Performance Indicators Impacting the Market
- Major Upcoming Developments and Projects
Key Highlights of the Report:
- Kenya Nano Copper Oxide Market Outlook
- Market Size of Kenya Nano Copper Oxide Market, 2025
- Forecast of Kenya Nano Copper Oxide Market, 2032
- Historical Data and Forecast of Kenya Nano Copper Oxide Revenues & Volume for the Period 2022-2032F
- Kenya Nano Copper Oxide Market Trend Evolution
- Kenya Nano Copper Oxide Market Drivers and Challenges
- Kenya Nano Copper Oxide Price Trends
- Kenya Nano Copper Oxide Porter's Five Forces
- Kenya Nano Copper Oxide Industry Life Cycle
- Historical Data and Forecast of Kenya Nano Copper Oxide Market Revenues & Volume By Type for the Period 2022-2032F
- Historical Data and Forecast of Kenya Nano Copper Oxide Market Revenues & Volume By Powder for the Period 2022-2032F
- Historical Data and Forecast of Kenya Nano Copper Oxide Market Revenues & Volume By Dispersed for the Period 2022-2032F
- Historical Data and Forecast of Kenya Nano Copper Oxide Market Revenues & Volume By Application for the Period 2022-2032F
- Historical Data and Forecast of Kenya Nano Copper Oxide Market Revenues & Volume By Electricals & Electronics for the Period 2022-2032F
- Historical Data and Forecast of Kenya Nano Copper Oxide Market Revenues & Volume By Paints & Coatings for the Period 2022-2032F
- Historical Data and Forecast of Kenya Nano Copper Oxide Market Revenues & Volume By Catalysts for the Period 2022-2032F
- Historical Data and Forecast of Kenya Nano Copper Oxide Market Revenues & Volume By Energy Storage for the Period 2022-2032F
- Kenya Nano Copper Oxide Import Export Trade Statistics
- Market Opportunity Assessment By Type
- Market Opportunity Assessment By Application
- Kenya Nano Copper Oxide Top Companies Market Share
- Kenya Nano Copper Oxide Competitive Benchmarking By Technical and Operational Parameters
- Kenya Nano Copper Oxide Company Profiles
- Kenya Nano Copper Oxide Key Strategic Recommendations
Kenya Nano Copper Oxide Market - Frequently Asked Questions
The market is estimated at USD 851 Million in 2025 and is expected to reach USD 1239 Million by 2032, demonstrating a robust growth at a CAGR of 5.5% from 2026 to 2032.
Nano copper oxide's exceptional electrical conductivity makes it an ideal material for applications such as conductive inks, printed circuit boards, and sensors, enhancing performance in electronic devices.
The agriculture industry is increasingly utilizing nano copper oxide for crop protection and growth enhancement, leveraging its antimicrobial properties to improve agricultural outputs.
Yes, while nano copper oxide offers numerous benefits, there are ongoing discussions regarding its environmental impact and safety, which may affect consumer and regulatory acceptance.
The government, through regulatory frameworks established by NEMA and KEBS, ensures that companies adhere to safety and environmental standards, indirectly facilitating a conducive market environment.
We can expect ongoing research and development leading to innovative applications, an increasing emphasis on sustainable practices, and enhanced market education to foster wider adoption.
6Wresearch actively monitors the Kenya Nano Copper Oxide Market and publishes its comprehensive annual report, highlighting emerging trends, growth drivers, revenue analysis, and forecast outlook. Our insights help businesses to make data-backed strategic decisions with ongoing market dynamics. Our analysts track relevent industries related to the Kenya Nano Copper Oxide Market, allowing our clients with actionable intelligence and reliable forecasts tailored to emerging regional needs.
Yes, we provide customisation as per your requirements. To learn more, feel free to contact us on sales@6wresearch.com
1 Executive Summary |
2 Introduction |
2.1 Key Highlights of the Report |
2.2 Report Description |
2.3 Market Scope & Segmentation |
2.4 Research Methodology |
2.5 Assumptions |
3 Kenya Nano Copper Oxide Market Overview |
3.1 Kenya Country Macro Economic Indicators |
3.2 Kenya Nano Copper Oxide Market Revenues & Volume, 2022 & 2032F |
3.3 Kenya Nano Copper Oxide Market - Industry Life Cycle |
3.4 Kenya Nano Copper Oxide Market - Porter's Five Forces |
3.5 Kenya Nano Copper Oxide Market Revenues & Volume Share, By Type, 2022 & 2032F |
3.6 Kenya Nano Copper Oxide Market Revenues & Volume Share, By Application, 2022 & 2032F |
4 Kenya Nano Copper Oxide Market Dynamics |
4.1 Impact Analysis |
4.2 Market Drivers |
4.2.1 Increasing demand for nano copper oxide in various industries such as electronics, healthcare, and agriculture |
4.2.2 Government initiatives promoting the use of nanotechnology in Kenya |
4.2.3 Growing investments in research and development of nano copper oxide applications |
4.3 Market Restraints |
4.3.1 High production costs associated with nano copper oxide manufacturing |
4.3.2 Lack of awareness and understanding of nano copper oxide benefits among potential end-users in Kenya |
4.3.3 Regulatory challenges and environmental concerns related to the use of nano materials |
5 Kenya Nano Copper Oxide Market Trends |
6 Kenya Nano Copper Oxide Market, By Types |
6.1 Kenya Nano Copper Oxide Market, By Type |
6.1.1 Overview and Analysis |
6.1.2 Kenya Nano Copper Oxide Market Revenues & Volume, By Type, 2022-2032F |
6.1.3 Kenya Nano Copper Oxide Market Revenues & Volume, By Powder, 2022-2032F |
6.1.4 Kenya Nano Copper Oxide Market Revenues & Volume, By Dispersed, 2022-2032F |
6.2 Kenya Nano Copper Oxide Market, By Application |
6.2.1 Overview and Analysis |
6.2.2 Kenya Nano Copper Oxide Market Revenues & Volume, By Electricals & Electronics, 2022-2032F |
6.2.3 Kenya Nano Copper Oxide Market Revenues & Volume, By Paints & Coatings, 2022-2032F |
6.2.4 Kenya Nano Copper Oxide Market Revenues & Volume, By Catalysts, 2022-2032F |
6.2.5 Kenya Nano Copper Oxide Market Revenues & Volume, By Energy Storage, 2022-2032F |
7 Kenya Nano Copper Oxide Market Import-Export Trade Statistics |
7.1 Kenya Nano Copper Oxide Market Export to Major Countries |
7.2 Kenya Nano Copper Oxide Market Imports from Major Countries |
8 Kenya Nano Copper Oxide Market Key Performance Indicators |
8.1 Research and development investment in nano copper oxide technology |
8.2 Adoption rate of nano copper oxide in key industries in Kenya |
8.3 Number of patents filed for nano copper oxide applications in Kenya |
9 Kenya Nano Copper Oxide Market - Opportunity Assessment |
9.1 Kenya Nano Copper Oxide Market Opportunity Assessment, By Type, 2022 & 2032F |
9.2 Kenya Nano Copper Oxide Market Opportunity Assessment, By Application, 2022 & 2032F |
10 Kenya Nano Copper Oxide Market - Competitive Landscape |
10.1 Kenya Nano Copper Oxide Market Revenue Share, By Companies, 2025 |
10.2 Kenya Nano Copper Oxide Market Competitive Benchmarking, By Operating and Technical Parameters |
11 Company Profiles |
12 Recommendations |
13 Disclaimer |
Global Go To Market Strategy - 2030
Export potential enables firms to identify high-growth global markets with greater confidence by combining advanced trade intelligence with a structured quantitative methodology. The framework analyzes emerging demand trends and country-level import patterns while integrating macroeconomic and trade datasets such as GDP and population forecasts, bilateral import–export flows, tariff structures, elasticity differentials between developed and developing economies, geographic distance, and import demand projections. Using weighted trade values from 2020–2024 as the base period to project country-to-country export potential for 2030, these inputs are operationalized through calculated drivers such as gravity model parameters, tariff impact factors, and projected GDP per-capita growth. Through an analysis of hidden potentials, demand hotspots, and market conditions that are most favorable to success, this method enables firms to focus on target countries, maximize returns, and global expansion with data, backed by accuracy.
By factoring in the projected importer demand gap that is currently unmet and could be potential opportunity, it identifies the potential for the Exporter (Country) among 190 countries, against the general trade analysis, which identifies the biggest importer or exporter.
To discover high-growth global markets and optimize your business strategy:
Click Here
Pricing
- Single User License$ 1,995
- Department License$ 2,400
- Site License$ 3,120
- Global License$ 3,795

Leadership Perspectives from Industry Events
Search
Thought Leadership and Analyst Meet


Our Clients
6WResearch In News
- India Air Conditioner Market Set for Strong Rebound in 2026 After Weather-Led Correction and GST-Driven Recovery: 6Wresearch
- ADAS in India: How Automatic Emergency Braking, Blind Spot Detection & Driver Monitoring are Transforming Road Safety
- Doha a strategic location for EV manufacturing hub: IPA Qatar
- Demand for luxury TVs surging in the GCC, says Samsung
- Empowering Growth: The Thriving Journey of Bangladesh’s Cable Industry
- Demand for luxury TVs surging in the GCC, says Samsung
Latest Reports
- Poland Fire Protection Systems Market (2026-2032)
- Cape Verde Portable Hand-Thrown Extinguisher Market (2026-2032)
- Canada Portable Hand-Thrown Extinguisher Market (2026-2032)
- Cameroon Portable Hand-Thrown Extinguisher Market (2026-2032)
- Burundi Portable Hand-Thrown Extinguisher Market (2026-2032)
- Burkina Faso Portable Hand-Thrown Extinguisher Market (2026-2032)
- Bulgaria Portable Hand-Thrown Extinguisher Market (2026-2032)
- Brunei Portable Hand-Thrown Extinguisher Market (2026-2032)
- Botswana Portable Hand-Thrown Extinguisher Market (2026-2032)
- Bosnia and Herzegovina Portable Hand-Thrown Extinguisher Market (2026-2032)
Industry Events and Analyst Meet

HIMTEX 2026

India Refining Summit 2026

India EV Show 2026

EV tech India Expo 2026

Auto Tech Asia 2026
Whitepaper
- Middle East & Africa Commercial Security Market Click here to view more.
- Middle East & Africa Fire Safety Systems & Equipment Market Click here to view more.
- GCC Drone Market Click here to view more.
- Middle East Lighting Fixture Market Click here to view more.
- GCC Physical & Perimeter Security Market Click here to view more.