Kenya Physical Security Market Size & Growth Rate (2026-2032)
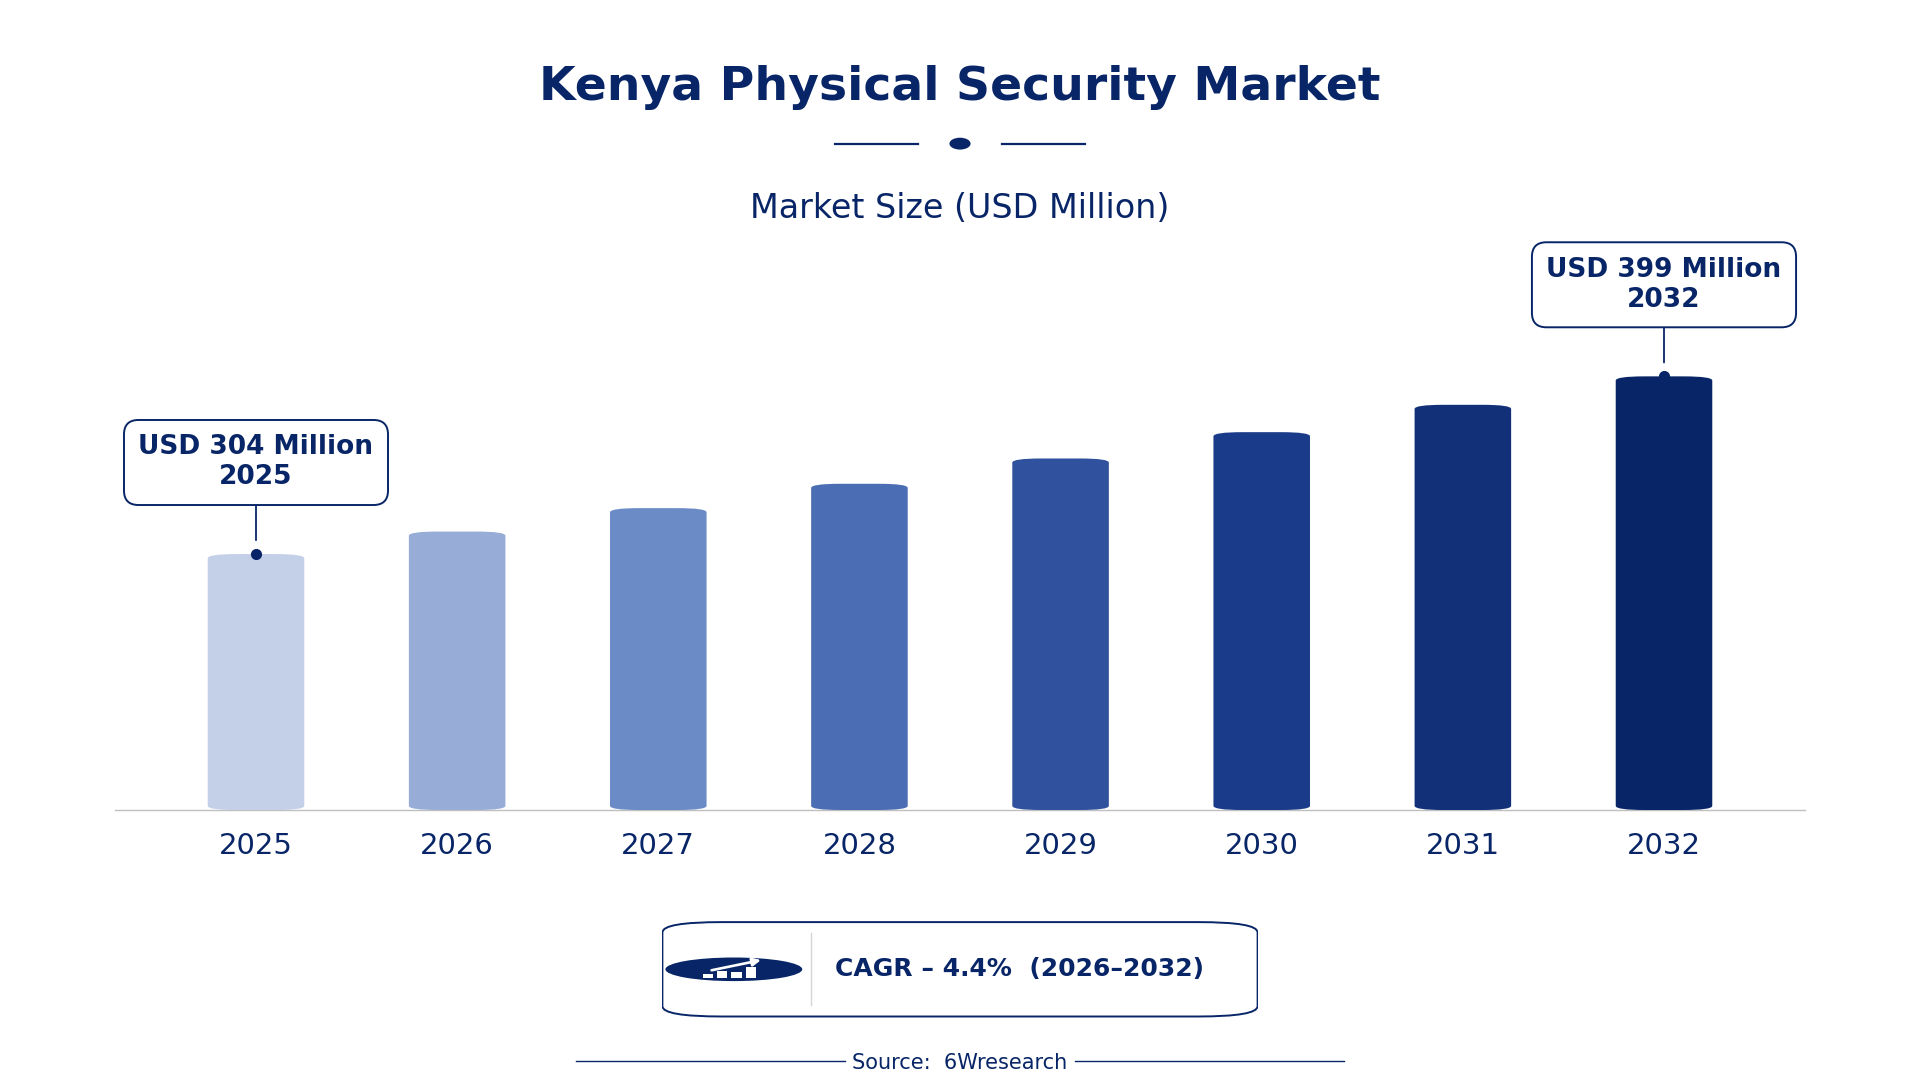
The Kenya Physical Security Market was estimated at USD 304 Million in 2025 and is projected to reach USD 399 Million by 2032, growing at a CAGR of 4.4% from 2026 to 2032.
Kenya Physical Security Market Synopsis
A pressing concern for the Kenya Physical Security Market is the rise in crime and terrorism, pushing both individuals and organizations to prioritize security measures. This urgency is reflected in the strong demand for advanced surveillance systems, access control solutions, and perimeter security mechanisms aimed at safeguarding lives and assets.
As smart city initiatives gain traction across Kenya, the market is witnessing a transformative shift towards integrated security solutions. The incorporation of cutting-edge technologies, including biometrics and video analytics, is shaping the future of security, particularly in government, commercial, and residential sectors.
Kenya Physical Security Market Year-wise Growth Rate and Key Drivers
This graph illustrates the annual growth rates of the Kenya Physical Security Market from 2021 to 2032, highlighting a steady upward trajectory and projected expansion over the forecast period.
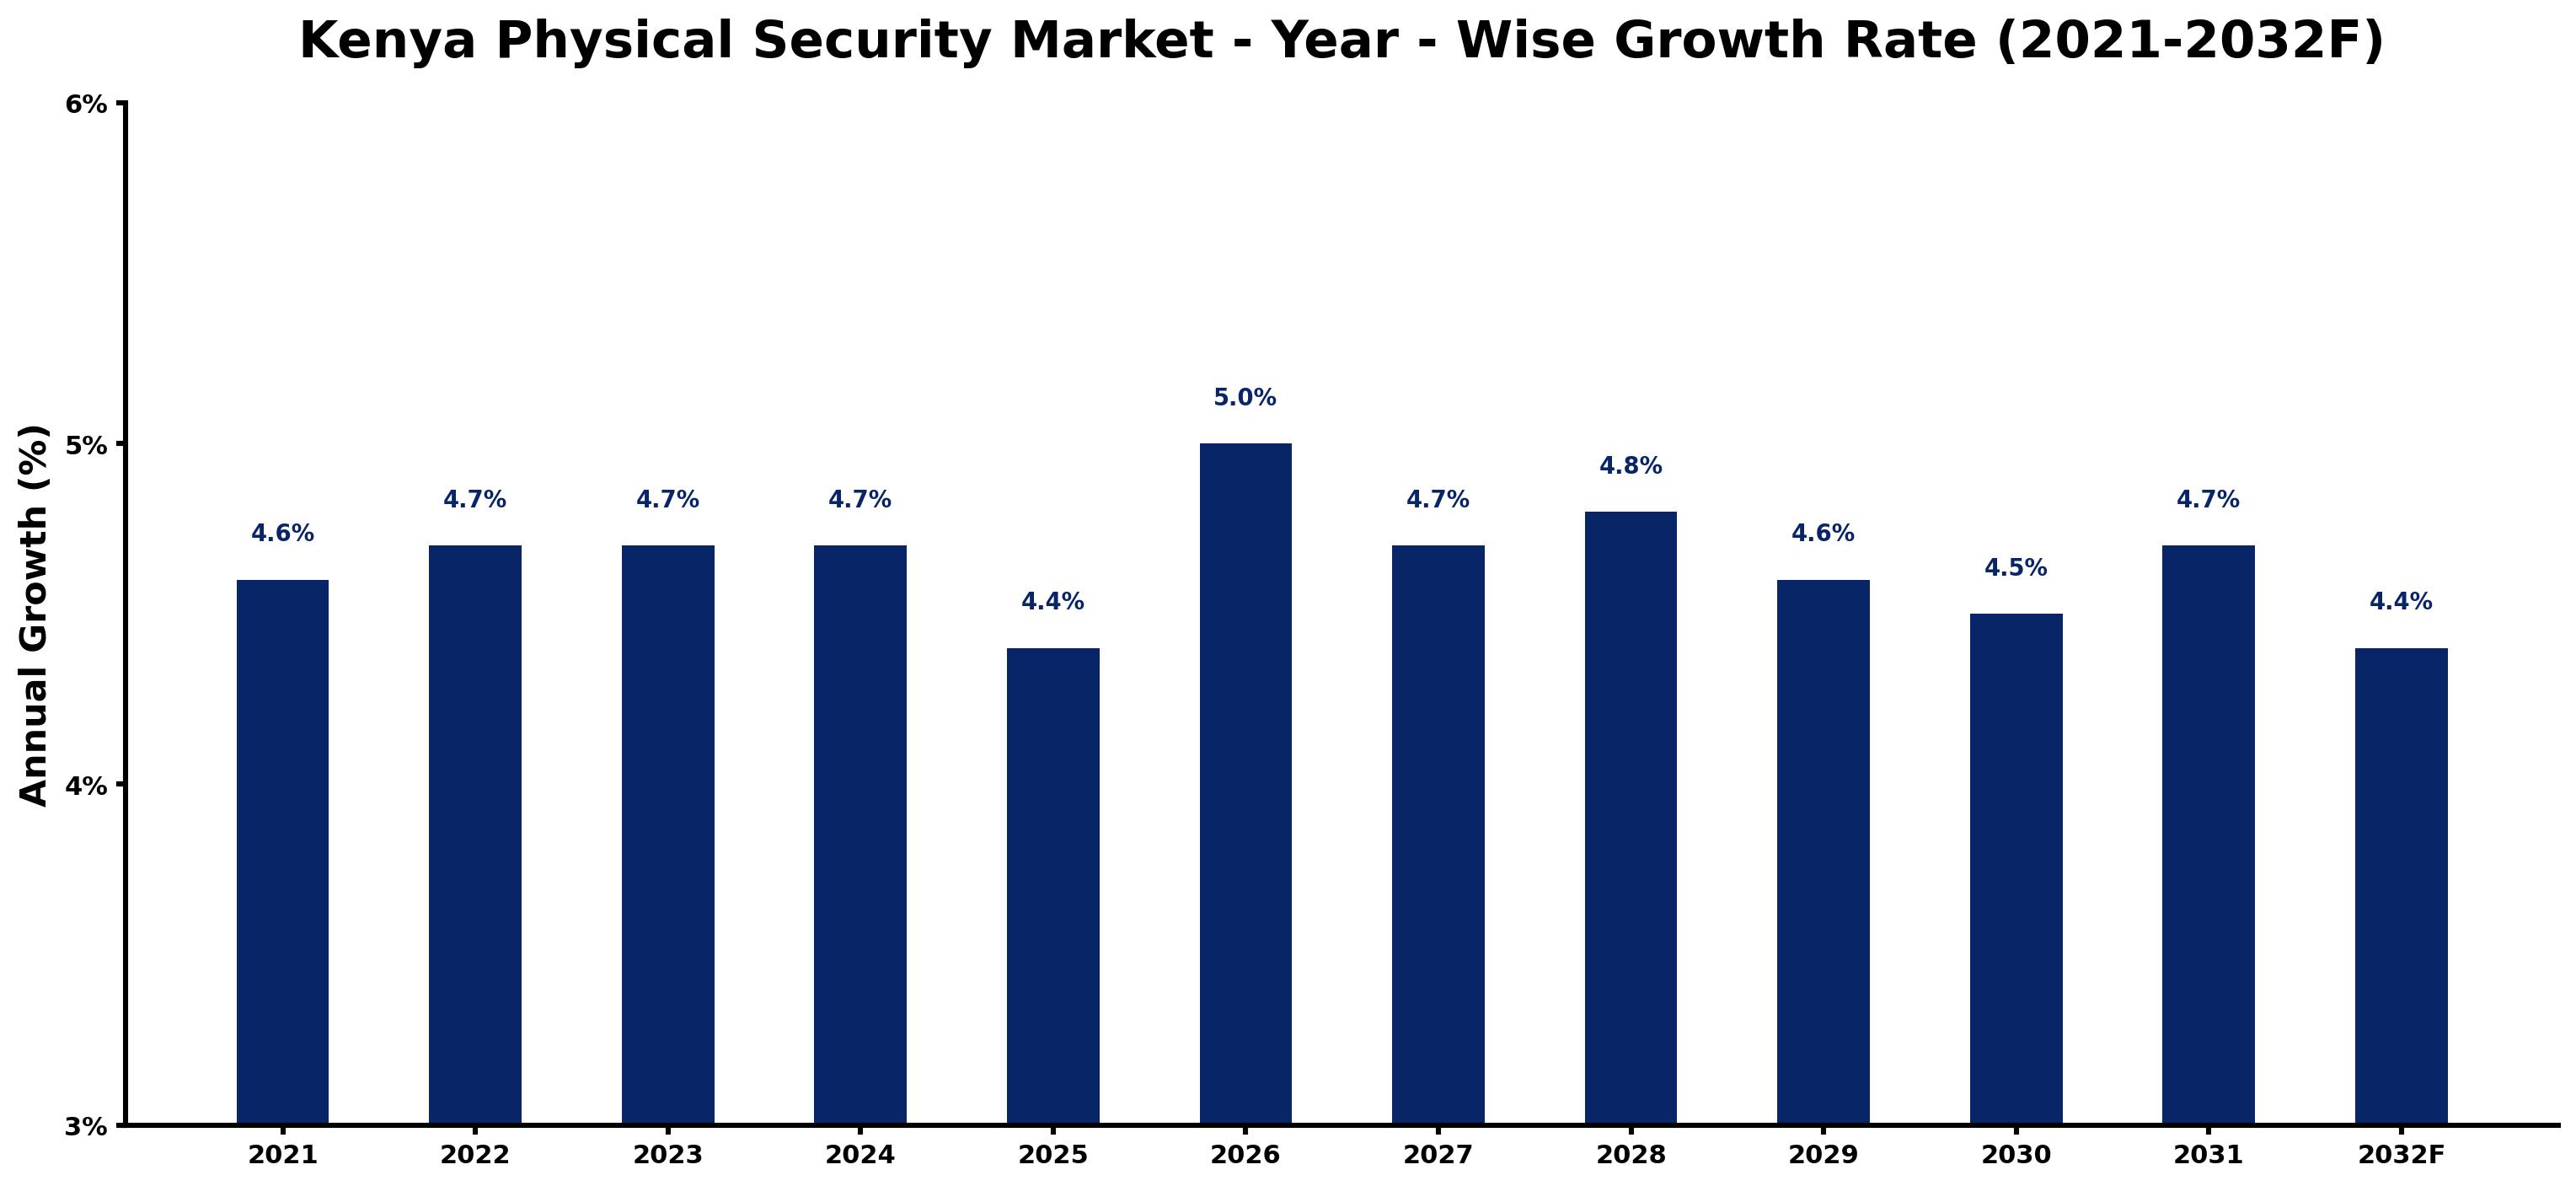
The table below presents the year‑wise growth rates along with the key drivers influencing the market
| Year | Growth Rate | Major Drivers |
| 2021 | 4.6% | Increased crime rates boosting demand for security solutions. |
| 2022 | 4.7% | Government initiatives promoting security awareness and training. |
| 2023 | 4.7% | Rise in property developments necessitating advanced security systems. |
| 2024 | 4.7% | Adoption of biometric access control by corporations. |
| 2025 | 4.4% | Local regulations mandating security assessments for new buildings. |
| 2026 | 5.0% | Integration of surveillance technology in urban planning projects. |
| 2027 | 4.7% | Growing expatriate population driving residential security installations. |
| 2028 | 4.8% | Increased investment in cybersecurity measures among businesses. |
| 2029 | 4.6% | Public safety campaigns raising awareness for personal security. |
| 2030 | 4.5% | Emergence of local startups in smart surveillance technologies. |
| 2031 | 4.7% | Rising tourism leading to enhanced hotel security standards. |
| 2032 | 4.4% | Partnerships between security firms and local law enforcement. |
Note: Market size estimations and growth projections presented in this report are based on 6Wresearch's proprietary forecasting methodology, utilizing the latest available industry data, government publications, and primary research inputs.
Kenya Physical Security Market Key Takeaways
Below are some of the specific key takeaways from the market, including:
- The market is increasingly adopting integrated security systems that combine various technologies for enhanced safety.
- Cloud-based solutions for remote management are gaining popularity among security providers.
- Government initiatives are fostering a more secure environment, encouraging investment in security infrastructure.
- Technological advancements in AI and machine learning are set to redefine threat detection capabilities.
- Inadequate infrastructure and a lack of skilled personnel continue to challenge market growth.
Evaluation of Restraints in Kenya Physical Security Market
Despite the promising growth potential, the Kenya Physical Security Market faces several barriers that limit its advancement. Chief among these is the inadequate infrastructure that hampers the effectiveness of security measures. Poor lighting conditions and unreliable power supply make many security systems less efficient, compromising overall safety. on top of that, the high crime rates escalate the demand for stronger security solutions; however, the shortage of skilled personnel remains a major hurdle. Organizations often struggle to implement sophisticated systems without the necessary expertise. Lastly, the cost and accessibility of advanced security technologies pose significant challenges, particularly for smaller businesses seeking to enhance their security posture.
Kenya Physical Security Market Trends
The Kenya Physical Security Market is witnessing several key trends that shape its future. The shift towards advanced surveillance technologies, such as video analytics and AI-driven monitoring, highlights a growing preference for real-time security solutions. Additionally, there is a marked increase in the adoption of integrated systems that bring together various security measures under one platform, enhancing overall operational efficiency. As businesses recognize the risks associated with cyber threats, incorporating cybersecurity into physical security measures is also gaining traction. Cloud-based solutions are evolving, allowing for better remote management and oversight, catering to the rising demand for flexibility and scalability.
Kenya Physical Security Market Opportunities
Investment opportunities abound in the Kenya Physical Security Market, particularly in sectors demanding robust security solutions. The rising urbanization trend is pushing the need for improved safety in both public and private spaces. Companies that provide innovative video surveillance and access control systems stand to benefit greatly from this increasing demand. Additionally, government initiatives aimed at enhancing security infrastructure present a fertile ground for growth. Investors should look closely at the local market needs, including those tied to commercial development, as they formulate strategies to capitalize on this burgeoning sector.
Government Initiatives in the Kenya Physical Security Market
Government policy is crucial in shaping the Kenya Physical Security Market, as it seeks to enhance security in the face of rising threats. Policies aimed at improving collaboration between private security firms and law enforcement agencies are creating a more integrated approach to public safety. on top of that, ongoing efforts to regulate the private security industry are establishing necessary standards for service providers. These regulations, coupled with strategic infrastructure investments, underscore the government's commitment to bolstering security in Kenya.
- A recently completed initiative is the Private Security Regulations Act, which sets clear guidelines for the private security sector.
- Currently ongoing is a program to upgrade security infrastructure across urban areas, enhancing public safety measures.
- A planned initiative is the establishment of the National Security Council, expected to coordinate efforts across various security sectors by mid-2026.
- The National Police Service Act emphasizes partnerships with private security firms to create comprehensive security strategies.
- Future initiatives include investments in smart technologies for surveillance that align with the Kenya Vision 2030 development goals.
Future Insights of the Kenya Physical Security Market
Looking ahead to 2026-2032, the Kenya Physical Security Market is set to experience noteworthy advancements, fueled by increased awareness of security needs. Rapid urbanization, coupled with a surge in crime rates, will necessitate innovative solutions that cater to the diverse security requirements of citizens and organizations alike. The integration of AI and machine learning in threat detection will further enhance security measures, allowing for proactive responses to potential risks. Government initiatives aimed at improving infrastructure will bolster the adoption of advanced technologies, supporting the market's expansion.
Kenya Physical Security Market Latest Developments
In the past year, the Kenya Physical Security Market has seen significant developments as stakeholders respond to growing security demands. The landscape is marked by advancements in technology and strategic partnerships aimed at enhancing security capabilities across various sectors.
- A leading regional operator launched a new video surveillance system in early 2025, designed to integrate with existing security frameworks.
- An ongoing initiative began in mid-2025 to implement cloud-based access control solutions across commercial properties, enhancing security management.
- Plans are underway for a major technology vendor to introduce advanced biometric authentication solutions in upcoming residential projects, expected to roll out by late 2026.
- Several companies are currently enhancing their service offerings by incorporating AI technologies for better threat monitoring, an effort that began in Q3 2025.
- A collaborative project between government and private security firms launched in early 2025, focusing on community safety education and crime prevention strategies.
Kenya Physical Security Market - Key Attractiveness of the Report
- 10 Years of Market Numbers
- Historical Data Starting from 2022 to 2025
- Base Year: 2025
- Forecast Data until 2032
- Key Performance Indicators Impacting the Market
- Major Upcoming Developments and Projects
Key Highlights of the Report:
- Kenya Physical Security Market Outlook
- Market Size of Kenya Physical Security Market, 2025
- Forecast of Kenya Physical Security Market, 2032
- Historical Data and Forecast of Kenya Physical Security Revenues & Volume for the Period 2022-2032F
- Kenya Physical Security Market Trend Evolution
- Kenya Physical Security Market Drivers and Challenges
- Kenya Physical Security Price Trends
- Kenya Physical Security Porter's Five Forces
- Kenya Physical Security Industry Life Cycle
- Historical Data and Forecast of Kenya Physical Security Market Revenues & Volume By Component for the Period 2022-2032F
- Historical Data and Forecast of Kenya Physical Security Market Revenues & Volume By Systems (PACS, PSIM, PIAM, Video Surveillance, Fire and Life Safety) for the Period 2022-2032F
- Historical Data and Forecast of Kenya Physical Security Market Revenues & Volume By Services for the Period 2022-2032F
- Historical Data and Forecast of Kenya Physical Security Market Revenues & Volume By Vertical for the Period 2022-2032F
- Historical Data and Forecast of Kenya Physical Security Market Revenues & Volume By BFSI for the Period 2022-2032F
- Historical Data and Forecast of Kenya Physical Security Market Revenues & Volume By Government for the Period 2022-2032F
- Historical Data and Forecast of Kenya Physical Security Market Revenues & Volume By Retail for the Period 2022-2032F
- Historical Data and Forecast of Kenya Physical Security Market Revenues & Volume By Transportation for the Period 2022-2032F
- Historical Data and Forecast of Kenya Physical Security Market Revenues & Volume By Residential for the Period 2022-2032F
- Historical Data and Forecast of Kenya Physical Security Market Revenues & Volume By Telecom and IT for the Period 2022-2032F
- Historical Data and Forecast of Kenya Physical Security Market Revenues & Volume By Other Verticals (Healthcare, Manufacturing, Energy and Utilities, and Education). for the Period 2022-2032F
- Historical Data and Forecast of Kenya Physical Security Market Revenues & Volume By Organization Size for the Period 2022-2032F
- Historical Data and Forecast of Kenya Physical Security Market Revenues & Volume By SMEs for the Period 2022-2032F
- Historical Data and Forecast of Kenya Physical Security Market Revenues & Volume By Large Enterprises for the Period 2022-2032F
- Kenya Physical Security Import Export Trade Statistics
- Market Opportunity Assessment By Component
- Market Opportunity Assessment By Vertical
- Market Opportunity Assessment By Organization Size
- Kenya Physical Security Top Companies Market Share
- Kenya Physical Security Competitive Benchmarking By Technical and Operational Parameters
- Kenya Physical Security Company Profiles
- Kenya Physical Security Key Strategic Recommendations






































