Kenya Pneumatic Conveying System Market (2026-2032) | Value, Companies, Industry, Growth, Outlook, Revenue, Size, Analysis, Share, Forecast & Trends
Market Forecast By Type (Positive Pressure Conveying, Vacuum Pressure Conveying, Combined Conveying), By Operation (Dense-Phase Conveying, Dilute-Phase Conveying), By End-Use (Pharmaceutical, Ceramic, Food, Rubber & Plastic) And Competitive Landscape
| Product Code: ETC048570 | Publication Date: Jan 2021 | Updated Date: Jun 2026 | Product Type: Report | |
| Publisher: 6Wresearch | Author: Summon Dutta | No. of Pages: 70 | No. of Figures: 35 | No. of Tables: 5 |
Kenya Pneumatic Conveying System Market Size, Share & Growth Rate
The Kenya Pneumatic Conveying System Market was estimated at USD 857 Million in 2025 and is projected to reach USD 1216 Million by 2032, growing at a CAGR of 5.1% from 2026 to 2032. This upward trajectory is largely fueled by the ongoing industrialization in Kenya, which intensifies the demand for efficient material handling solutions. The food processing and pharmaceutical sectors are particularly significant, pushing for advanced conveying systems that enhance productivity while reducing energy consumption.
Kenya Pneumatic Conveying System Market Growth Rate Analysis (2021-2032)
The Kenya Pneumatic Conveying System market has exhibited stable growth, starting with a rate of 5.9% in 2021 and gradually increasing to 6.3% projected by 2032. This upward trend reflects heightened demand for efficient material handling solutions across various industries, fueled by infrastructure developments and a burgeoning manufacturing sector. Notably, 2023 and 2024 saw growth rates of 6.0% and 6.2%, respectively, largely due to investments in technology and energy-efficient systems aimed at optimizing productivity. However, minor fluctuations, such as a dip to 5.6% in 2026, can be attributed to temporary supply chain disruptions. Overall, the market benefits from a robust industrial landscape and evolving consumer demands supporting long-term expansion.
Kenya Pneumatic Conveying System Market Year-wise Growth Rate and Key Drivers
This graph highlights how the Kenya Pneumatic Conveying System Market has steadily grown over the past five years, supported by major growth factors.
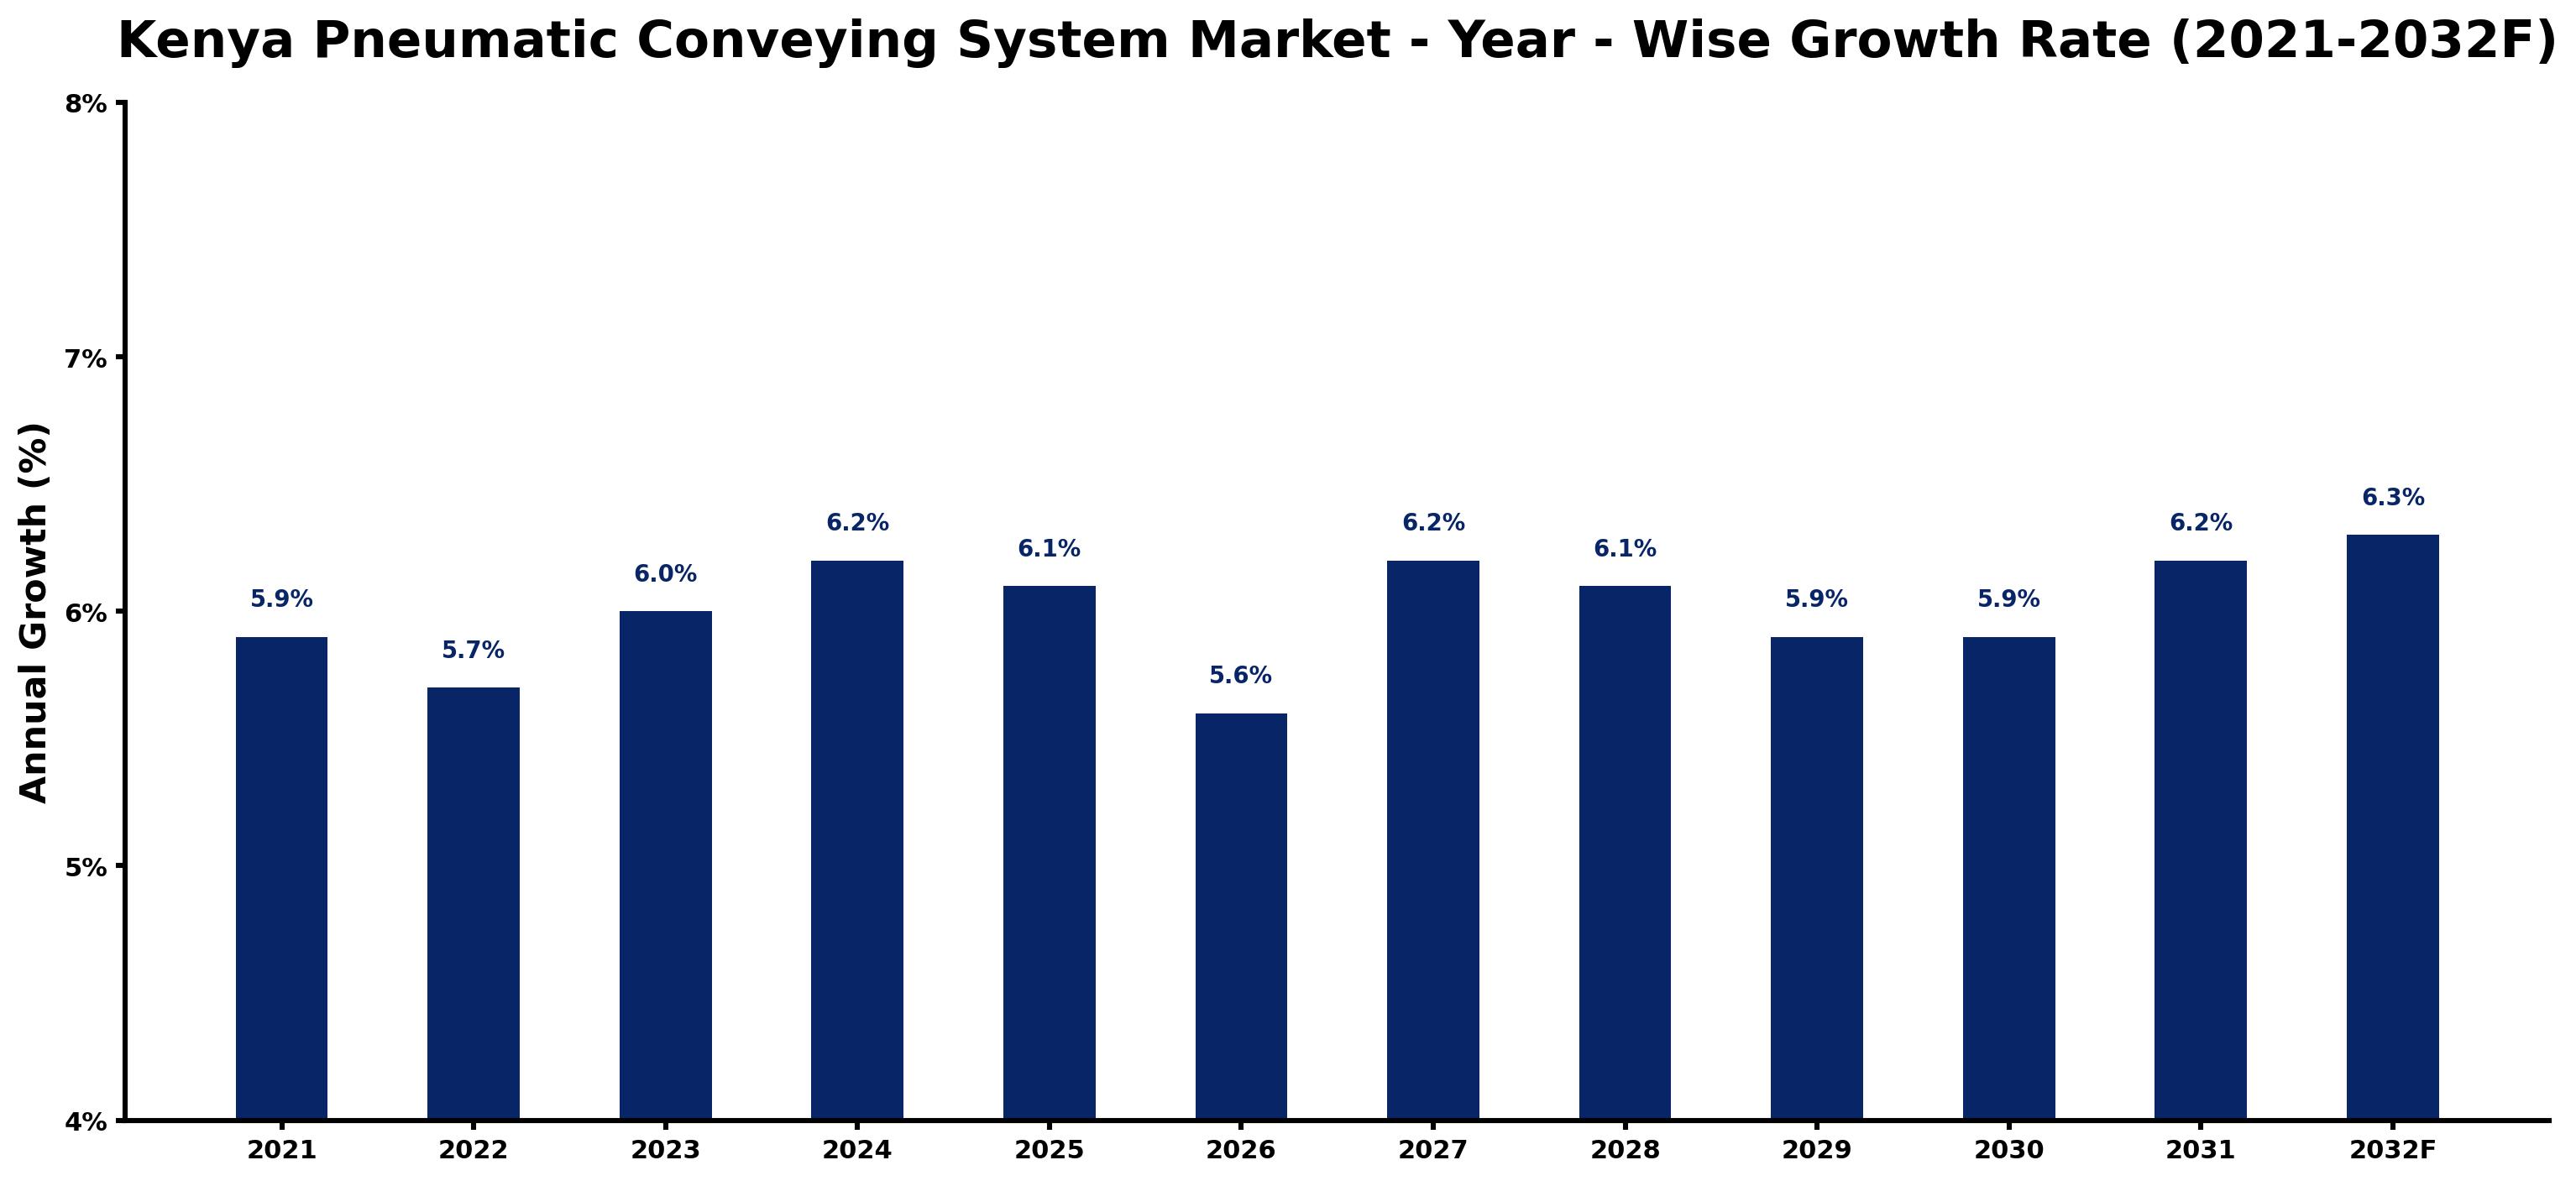
The table below presents the year‑wise growth rates along with the key drivers influencing the market
| Year | Growth Rate | Major Drivers |
| 2021 | 5.9% | Expansion of commercial construction activities |
| 2022 | 5.7% | Growing renewable energy integration projects |
| 2023 | 6.0% | Rising electricity demand across industries |
| 2024 | 6.2% | Growing urbanization and commercial development |
| 2025 | 6.1% | Increasing industrial automation investments |
| 2026 | 5.6% | Increasing adoption of advanced technologies |
| 2027 | 6.2% | Expansion of manufacturing activities |
| 2028 | 6.1% | Increasing smart city development projects |
| 2029 | 5.9% | Increasing smart city development projects |
| 2030 | 5.9% | Growing urbanization and commercial development |
| 2031 | 6.2% | Expansion of commercial construction activities |
| 2032 | 6.3% | Rapid growth in telecom and data center sectors |
Note - Market size estimations and growth projections presented in this report are based on 6Wresearch’s advanced forecasting approach, validated with industry datasets as of June 2026.
Kenya Pneumatic Conveying System Market Synopsis
The Kenya Pneumatic Conveying System Market is marked by robust growth as industries seek more efficient ways to transport bulk materials. This demand is driven by the need for automation and optimization in production processes, particularly in the food and beverage and pharmaceutical sectors.
Recent trends indicate a strong push towards sustainability, with businesses increasingly focused on eco-friendly solutions that minimize environmental impacts. As a result, pneumatic conveying systems that align with these sustainability goals are likely to see heightened interest and investment in the near future.
Kenya Pneumatic Conveying System Market Key Takeaways
- The market is projected to experience a healthy CAGR of 5.1% from 2026 to 2032.
- Technological advancements are leading to more energy-efficient and automated conveying systems.
- Customization of pneumatic conveying solutions is becoming increasingly crucial across various industries.
- Sustainability and eco-friendliness are key considerations driving innovation in the market.
- Investments in local manufacturing initiatives are expected to boost market growth and development.
Evaluation of Restraints in Kenya Pneumatic Conveying System Market
Despite the favorable growth conditions, several factors could inhibit the advancement of the Kenya Pneumatic Conveying System Market. A significant barrier is the limited awareness and understanding of pneumatic conveying technology among potential end-users, which can slow its adoption across industries. Additionally, the high initial costs involved in system installation can be a deterrent for many businesses. Moreover, the shortage of skilled technicians to design, install, and maintain these systems further complicates the landscape, potentially affecting the operational efficiency and reliability of these technologies.
Kenya Pneumatic Conveying System Market Trends
Current trends in the Kenya Pneumatic Conveying System Market reveal an increasing integration of advanced technologies such as IoT and AI. These innovations enable real-time monitoring and predictive maintenance, significantly enhancing system efficiency. Furthermore, there is a growing interest in modular and flexible systems that can be tailored to meet the specific needs of various industries, thereby fostering competitive differentiation among manufacturers.
Kenya Pneumatic Conveying System Market Opportunities
There are abundant opportunities for growth in the Kenya Pneumatic Conveying System Market, particularly for investors focused on sustainable and energy-efficient solutions. The increasing demand for customized systems, especially in food processing and pharmaceuticals, opens avenues for innovation and differentiation. Additionally, supporting local manufacturing efforts presents a dual advantage of contributing to national economic growth while meeting local market needs.
Government Initiatives in the Kenya Pneumatic Conveying System Market
The Kenyan government is actively promoting industrial growth through various policies aimed at enhancing manufacturing efficiency and sustainability. Initiatives such as tax breaks and subsidies are designed to encourage local production of pneumatic conveying systems. Furthermore, safety and environmental regulations ensure that new technologies align with sustainable practices, fostering a conducive environment for market expansion.
Future Insights of the Kenya Pneumatic Conveying System Market
Looking ahead to 2026-2032, the Kenya Pneumatic Conveying System Market is positioned for steady growth, driven primarily by expanding industrial capabilities and infrastructure development. The heightened emphasis on automation and reduced manual labor will serve as catalysts for further adoption of pneumatic systems. As companies increasingly recognize the benefits of these technologies, coupled with ongoing advancements in system efficiency, the market is poised for significant evolution.
Kenya Pneumatic Conveying System Market Latest Developments (May 2025 - June 2026)
Recent developments in the Kenya Pneumatic Conveying System Market have showcased a shift towards innovative solutions that prioritize energy efficiency and sustainability. There is a noticeable trend of manufacturers focusing on developing systems with lower environmental footprints and improved operational capabilities. Furthermore, collaborative efforts between local industries and international technology providers are on the rise, indicating a strong drive towards modernization and competitiveness in the sector.
Kenya Pneumatic Conveying System Market - Key Attractiveness of the Report
- 10 Years of Market Numbers
- Historical Data Starting from 2022 to 2025
- Base Year: 2025
- Forecast Data until 2032
- Key Performance Indicators Impacting the Market
- Major Upcoming Developments and Projects
Key Highlights of the Report:
- Kenya Pneumatic Conveying System Market Outlook
- Market Size of Kenya Pneumatic Conveying System Market, 2025
- Forecast of Kenya Pneumatic Conveying System Market, 2032
- Historical Data and Forecast of Kenya Pneumatic Conveying System Revenues & Volume for the Period 2022-2032F
- Kenya Pneumatic Conveying System Market Trend Evolution
- Kenya Pneumatic Conveying System Market Drivers and Challenges
- Kenya Pneumatic Conveying System Price Trends
- Kenya Pneumatic Conveying System Porter's Five Forces
- Kenya Pneumatic Conveying System Industry Life Cycle
- Historical Data and Forecast of Kenya Pneumatic Conveying System Market Revenues & Volume By Type for the Period 2022-2032F
- Historical Data and Forecast of Kenya Pneumatic Conveying System Market Revenues & Volume By Positive Pressure Conveying for the Period 2022-2032F
- Historical Data and Forecast of Kenya Pneumatic Conveying System Market Revenues & Volume By Vacuum Pressure Conveying for the Period 2022-2032F
- Historical Data and Forecast of Kenya Pneumatic Conveying System Market Revenues & Volume By Combined Conveying for the Period 2022-2032F
- Historical Data and Forecast of Kenya Pneumatic Conveying System Market Revenues & Volume By Operation for the Period 2022-2032F
- Historical Data and Forecast of Kenya Pneumatic Conveying System Market Revenues & Volume By Dense-Phase Conveying for the Period 2022-2032F
- Historical Data and Forecast of Kenya Pneumatic Conveying System Market Revenues & Volume By Dilute-Phase Conveying for the Period 2022-2032F
- Historical Data and Forecast of Kenya Pneumatic Conveying System Market Revenues & Volume By End-Use for the Period 2022-2032F
- Historical Data and Forecast of Kenya Pneumatic Conveying System Market Revenues & Volume By Pharmaceutical for the Period 2022-2032F
- Historical Data and Forecast of Kenya Pneumatic Conveying System Market Revenues & Volume By Ceramic for the Period 2022-2032F
- Historical Data and Forecast of Kenya Pneumatic Conveying System Market Revenues & Volume By Food for the Period 2022-2032F
- Historical Data and Forecast of Kenya Pneumatic Conveying System Market Revenues & Volume By Rubber & Plastic for the Period 2022-2032F
- Kenya Pneumatic Conveying System Import Export Trade Statistics
- Market Opportunity Assessment By Type
- Market Opportunity Assessment By Operation
- Market Opportunity Assessment By End-Use
- Kenya Pneumatic Conveying System Top Companies Market Share
- Kenya Pneumatic Conveying System Competitive Benchmarking By Technical and Operational Parameters
- Kenya Pneumatic Conveying System Company Profiles
- Kenya Pneumatic Conveying System Key Strategic Recommendations
Kenya Pneumatic Conveying System Market - Frequently Asked Questions
The market is largely driven by increasing industrialization and a pressing need for efficient material handling solutions across sectors such as food processing and pharmaceuticals.
The market is expected to grow from USD 857 Million in 2025 to USD 1216 Million by 2032, achieving a CAGR of 5.1% between 2026 and 2032.
The Kenyan government is promoting industrial development through incentives such as tax breaks and subsidies, as well as ensuring compliance with environmental regulations.
Significant trends include the integration of IoT for monitoring and predictive maintenance, as well as an increasing demand for sustainable and energy-efficient solutions.
Companies often encounter high initial investment costs and a lack of skilled technicians familiar with the design and maintenance of these systems, which can limit their efficiency and adoption.
6Wresearch actively monitors the Kenya Pneumatic Conveying System Market and publishes its comprehensive annual report, highlighting emerging trends, growth drivers, revenue analysis, and forecast outlook. Our insights help businesses to make data-backed strategic decisions with ongoing market dynamics. Our analysts track relevent industries related to the Kenya Pneumatic Conveying System Market, allowing our clients with actionable intelligence and reliable forecasts tailored to emerging regional needs.
Yes, we provide customisation as per your requirements. To learn more, feel free to contact us on sales@6wresearch.com
1 Executive Summary |
2 Introduction |
2.1 Key Highlights of the Report |
2.2 Report Description |
2.3 Market Scope & Segmentation |
2.4 Research Methodology |
2.5 Assumptions |
3 Kenya Pneumatic Conveying System Market Overview |
3.1 Kenya Country Macro Economic Indicators |
3.2 Kenya Pneumatic Conveying System Market Revenues & Volume, 2022 & 2032F |
3.3 Kenya Pneumatic Conveying System Market - Industry Life Cycle |
3.4 Kenya Pneumatic Conveying System Market - Porter's Five Forces |
3.5 Kenya Pneumatic Conveying System Market Revenues & Volume Share, By Type, 2022 & 2032F |
3.6 Kenya Pneumatic Conveying System Market Revenues & Volume Share, By Operation, 2022 & 2032F |
3.7 Kenya Pneumatic Conveying System Market Revenues & Volume Share, By End-Use, 2022 & 2032F |
4 Kenya Pneumatic Conveying System Market Dynamics |
4.1 Impact Analysis |
4.2 Market Drivers |
4.3 Market Restraints |
5 Kenya Pneumatic Conveying System Market Trends |
6 Kenya Pneumatic Conveying System Market, By Types |
6.1 Kenya Pneumatic Conveying System Market, By Type |
6.1.1 Overview and Analysis |
6.1.2 Kenya Pneumatic Conveying System Market Revenues & Volume, By Type, 2022-2032F |
6.1.3 Kenya Pneumatic Conveying System Market Revenues & Volume, By Positive Pressure Conveying, 2022-2032F |
6.1.4 Kenya Pneumatic Conveying System Market Revenues & Volume, By Vacuum Pressure Conveying, 2022-2032F |
6.1.5 Kenya Pneumatic Conveying System Market Revenues & Volume, By Combined Conveying, 2022-2032F |
6.2 Kenya Pneumatic Conveying System Market, By Operation |
6.2.1 Overview and Analysis |
6.2.2 Kenya Pneumatic Conveying System Market Revenues & Volume, By Dense-Phase Conveying, 2022-2032F |
6.2.3 Kenya Pneumatic Conveying System Market Revenues & Volume, By Dilute-Phase Conveying, 2022-2032F |
6.3 Kenya Pneumatic Conveying System Market, By End-Use |
6.3.1 Overview and Analysis |
6.3.2 Kenya Pneumatic Conveying System Market Revenues & Volume, By Pharmaceutical, 2022-2032F |
6.3.3 Kenya Pneumatic Conveying System Market Revenues & Volume, By Ceramic, 2022-2032F |
6.3.4 Kenya Pneumatic Conveying System Market Revenues & Volume, By Food, 2022-2032F |
6.3.5 Kenya Pneumatic Conveying System Market Revenues & Volume, By Rubber & Plastic, 2022-2032F |
7 Kenya Pneumatic Conveying System Market Import-Export Trade Statistics |
7.1 Kenya Pneumatic Conveying System Market Export to Major Countries |
7.2 Kenya Pneumatic Conveying System Market Imports from Major Countries |
8 Kenya Pneumatic Conveying System Market Key Performance Indicators |
9 Kenya Pneumatic Conveying System Market - Opportunity Assessment |
9.1 Kenya Pneumatic Conveying System Market Opportunity Assessment, By Type, 2022 & 2032F |
9.2 Kenya Pneumatic Conveying System Market Opportunity Assessment, By Operation, 2022 & 2032F |
9.3 Kenya Pneumatic Conveying System Market Opportunity Assessment, By End-Use, 2022 & 2032F |
10 Kenya Pneumatic Conveying System Market - Competitive Landscape |
10.1 Kenya Pneumatic Conveying System Market Revenue Share, By Companies, 2025 |
10.2 Kenya Pneumatic Conveying System Market Competitive Benchmarking, By Operating and Technical Parameters |
11 Company Profiles |
12 Recommendations |
13 Disclaimer |
Global Go To Market Strategy - 2030
Export potential enables firms to identify high-growth global markets with greater confidence by combining advanced trade intelligence with a structured quantitative methodology. The framework analyzes emerging demand trends and country-level import patterns while integrating macroeconomic and trade datasets such as GDP and population forecasts, bilateral import–export flows, tariff structures, elasticity differentials between developed and developing economies, geographic distance, and import demand projections. Using weighted trade values from 2020–2024 as the base period to project country-to-country export potential for 2030, these inputs are operationalized through calculated drivers such as gravity model parameters, tariff impact factors, and projected GDP per-capita growth. Through an analysis of hidden potentials, demand hotspots, and market conditions that are most favorable to success, this method enables firms to focus on target countries, maximize returns, and global expansion with data, backed by accuracy.
By factoring in the projected importer demand gap that is currently unmet and could be potential opportunity, it identifies the potential for the Exporter (Country) among 190 countries, against the general trade analysis, which identifies the biggest importer or exporter.
To discover high-growth global markets and optimize your business strategy:
Click Here
Pricing
- Single User License$ 1,995
- Department License$ 2,400
- Site License$ 3,120
- Global License$ 3,795

Leadership Perspectives from Industry Events
Search
Thought Leadership and Analyst Meet


Our Clients
6WResearch In News
- India Air Conditioner Market Set for Strong Rebound in 2026 After Weather-Led Correction and GST-Driven Recovery: 6Wresearch
- ADAS in India: How Automatic Emergency Braking, Blind Spot Detection & Driver Monitoring are Transforming Road Safety
- Doha a strategic location for EV manufacturing hub: IPA Qatar
- Demand for luxury TVs surging in the GCC, says Samsung
- Empowering Growth: The Thriving Journey of Bangladesh’s Cable Industry
- Demand for luxury TVs surging in the GCC, says Samsung
Latest Reports
- Poland Fire Protection Systems Market (2026-2032)
- Cape Verde Portable Hand-Thrown Extinguisher Market (2026-2032)
- Canada Portable Hand-Thrown Extinguisher Market (2026-2032)
- Cameroon Portable Hand-Thrown Extinguisher Market (2026-2032)
- Burundi Portable Hand-Thrown Extinguisher Market (2026-2032)
- Burkina Faso Portable Hand-Thrown Extinguisher Market (2026-2032)
- Bulgaria Portable Hand-Thrown Extinguisher Market (2026-2032)
- Brunei Portable Hand-Thrown Extinguisher Market (2026-2032)
- Botswana Portable Hand-Thrown Extinguisher Market (2026-2032)
- Bosnia and Herzegovina Portable Hand-Thrown Extinguisher Market (2026-2032)
Industry Events and Analyst Meet

HIMTEX 2026

India Refining Summit 2026

India EV Show 2026

EV tech India Expo 2026

Auto Tech Asia 2026
Whitepaper
- Middle East & Africa Commercial Security Market Click here to view more.
- Middle East & Africa Fire Safety Systems & Equipment Market Click here to view more.
- GCC Drone Market Click here to view more.
- Middle East Lighting Fixture Market Click here to view more.
- GCC Physical & Perimeter Security Market Click here to view more.