Kenya Potassium permanganate Market (2026-2032) Outlook | Companies, Share, Industry, Growth, Value, Revenue, Analysis, Forecast, Size & Trends
Market Forecast By Grade (Free Flowing Grade, Technical Grade, Pharmaceutical Grade), By Application (Water Treatment, Waste Water Treatment, Chemicals Manufacturing, Aquaculture, Metal Processing, Air and Gas Purification, Others) And Competitive Landscape
| Product Code: ETC091209 | Publication Date: Jun 2021 | Updated Date: Jun 2026 | Product Type: Report | |
| Publisher: 6Wresearch | Author: Ravi Bhandari | No. of Pages: 70 | No. of Figures: 35 | No. of Tables: 5 |
Kenya Potassium permanganate Market Size, Share & Growth Rate
The Kenya Potassium permanganate Market was estimated at USD 204 Million in 2025 and is projected to reach USD 271 Million by 2032, growing at a CAGR of 4.1% from 2026 to 2032. This growth trajectory is fueled by the rising demand for clean water solutions amidst growing urbanization and population pressures in Kenya. Additionally, the industrial sector’s need for effective oxidizing agents is further boosting the market, with potassium permanganate being a preferred choice due to its versatility and strong disinfecting properties.
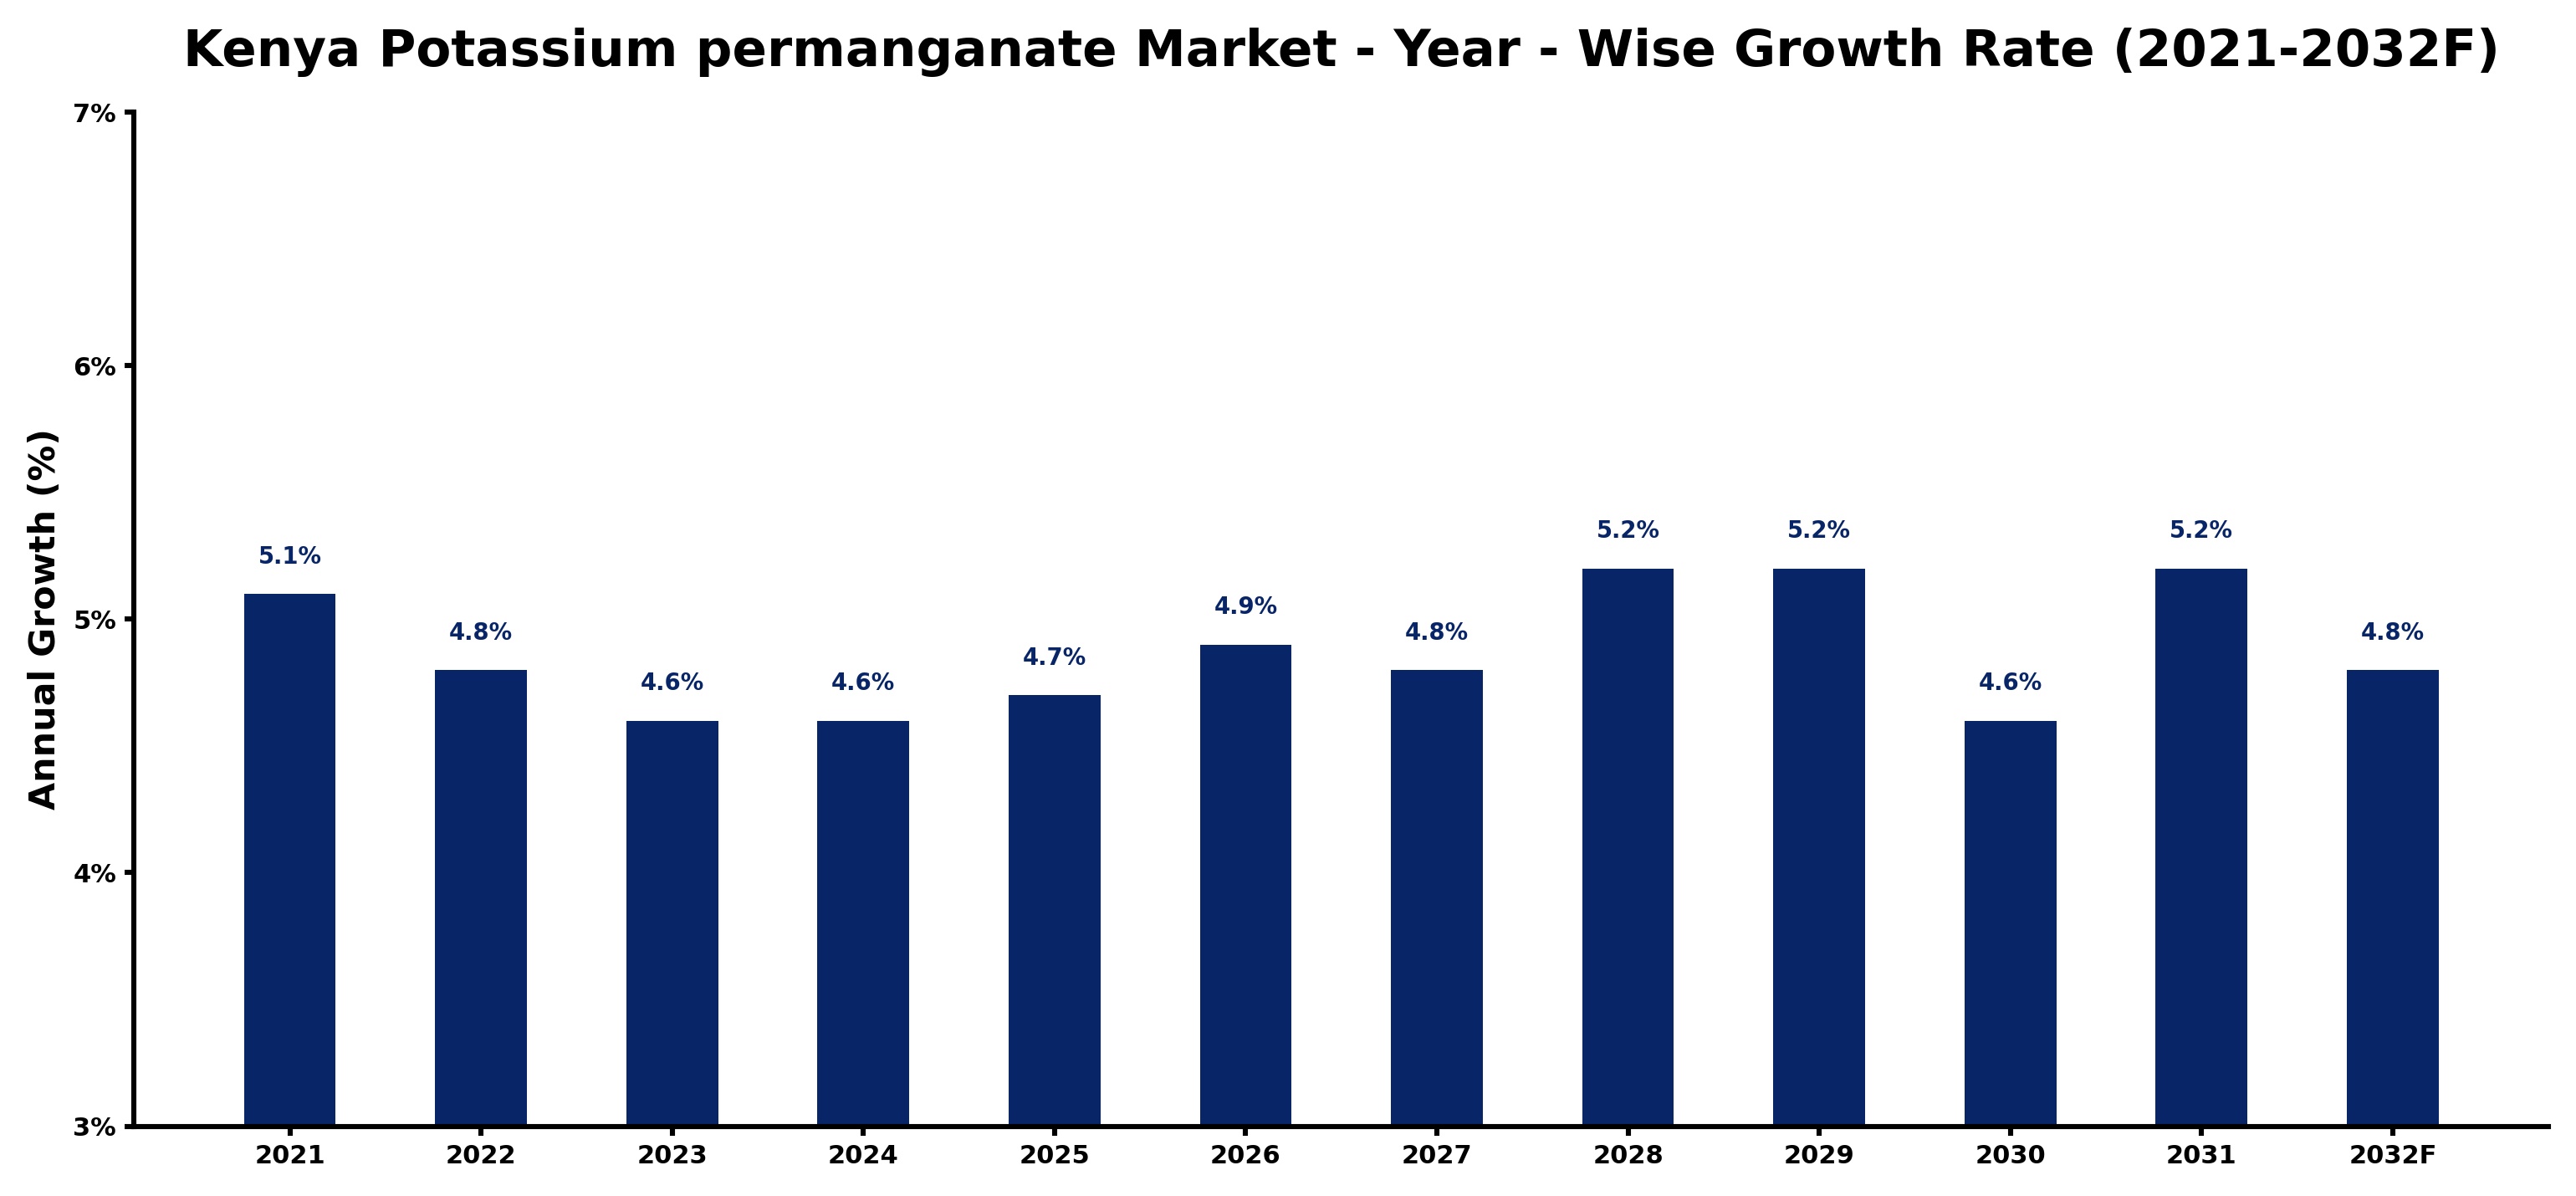
Kenya Potassium permanganate Market Growth Rate Analysis (2021-2032)
The Kenya potassium permanganate market has exhibited stable growth, marked by a yearly increase of 5.1% in 2021 following a robust demand from water treatment and chemical manufacturing sectors. This growth slightly tapered to 4.8% in 2022, influenced by supply chain disruptions and fluctuating raw material costs. However, the outlook stabilized around 4.6% in both 2023 and 2024, as investments in industrial applications and digitalization efforts enhanced production efficiency. Notably, the market is projected to experience a resurgence to 5.2% by 2028, driven by escalating consumer demand and supportive policies aimed at improving infrastructure for water purification. This ongoing evolution suggests a responsive market adapting to technological advancements and energy transition imperatives.
Kenya Potassium permanganate Market Year-wise Growth Rate and Key Drivers
This graph highlights how the Kenya Potassium permanganate Market has steadily grown over the past five years, supported by major growth factors.
The table below presents the year‑wise growth rates along with the key drivers influencing the market
| Year | Growth Rate | Major Drivers |
| 2021 | 5.1% | Infrastructure development drives potassium permanganate manufacturing capacity upgrades |
| 2022 | 4.8% | Potassium permanganate applications in water treatment boost market interest |
| 2023 | 4.6% | Local chemical plants expanded capacity for potassium permanganate production |
| 2024 | 4.6% | Export driven fertilizer demand boosts potassium permanganate manufacturing capacity |
| 2025 | 4.7% | Chemical processing facilities adopt advanced methods for potassium permanganate production |
| 2026 | 4.9% | New potassium permanganate plant openings boost regional supply capabilities |
| 2027 | 4.8% | Advanced water treatment technologies drive potassium permanganate application growth |
| 2028 | 5.2% | New chemical facility investments boost potassium permanganate output capacity |
| 2029 | 5.2% | Investment in processing facilities boosted potassium permanganate output capacity |
| 2030 | 4.6% | Local potassium permanganate production expansion boosts regional agricultural supply |
| 2031 | 5.2% | Improved mining sector performance boosts potassium permanganate procurement needs |
| 2032 | 4.8% | New chemical manufacturing facilities boost local potassium permanganate output |
Note - Market size estimations and growth projections presented in this report are based on 6Wresearch’s advanced forecasting approach, validated with industry datasets as of June 2026.
Kenya Potassium permanganate Market Synopsis
A paramount force shaping the Kenya Potassium permanganate Market is the urgent requirement for safe drinking water and efficient wastewater treatment solutions. With stringent regulations focusing on water quality and safety, municipalities and industries are increasingly turning to potassium permanganate for effective treatment processes.
Moreover, the chemical's applications extend beyond water treatment to encompass uses in medicine and various industrial processes. This multifaceted demand is driving innovations and technology advancements, positioning potassium permanganate as a crucial component in Kenya’s efforts to enhance public health and environmental sustainability.
Kenya Potassium permanganate Market Key Takeaways
- Potassium permanganate is gaining traction due to its application in water treatment and wastewater management.
- The market is significantly influenced by regulatory requirements for water quality and safety.
- Increasing industrial activities in Kenya are creating higher demand for oxidizing agents.
- Challenges include high production costs and dependence on imported materials.
- Innovations in treatment technologies are expected to shape the market's future.
Evaluation of Restraints in Kenya Potassium permanganate Market
Despite promising growth, the Kenya Potassium permanganate Market faces notable challenges that could impede its progress. The high production costs, largely due to a dependence on imported raw materials and technology, render potassium permanganate less accessible to local consumers and industries. This financial burden limits its adoption, particularly in smaller enterprises. Furthermore, the environmental regulations surrounding the production and handling of potassium permanganate demand significant investment in sustainable practices, further complicating the economic landscape for stakeholders in the market.
Kenya Potassium permanganate Market Trends
Current trends indicate a strong push towards sustainable practices in the production and application of potassium permanganate. As public awareness of environmental issues grows, industries are seeking eco-friendly alternatives and cleaner production methods. Additionally, advancements in water treatment technologies, including the integration of potassium permanganate with other treatment processes, are emerging as key drivers of market demand. These developments reflect a shift towards more efficient and environmentally responsible chemical solutions.
Kenya Potassium permanganate Market Opportunities
Opportunities within the Kenya Potassium permanganate Market lie in enhancing local production capabilities and reducing reliance on imports. Investing in domestic production not only mitigates logistical challenges but also supports local economies. Moreover, the growing focus on water quality standards opens avenues for innovative applications of potassium permanganate in sectors such as agriculture, pharmaceuticals, and food processing. Collaborations between the public and private sectors could also lead to breakthroughs in sustainable production techniques, tapping into a more environmentally conscious market.
Government Initiatives in the Kenya Potassium permanganate Market
The Kenyan government is actively promoting initiatives that support water quality improvement and environmental sustainability. This includes funding public projects aimed at enhancing water treatment infrastructure and enforcing strict regulations on water safety. Additionally, policies encouraging investment in local production and technology development for chemicals like potassium permanganate are anticipated, as these initiatives align with broader national goals for public health and ecological responsibility.
Future Insights of the Kenya Potassium permanganate Market
Looking ahead to 2026-2032, the Kenya Potassium permanganate Market is poised for steady growth, primarily driven by continued urbanization and heightened awareness of public health issues. As more industries adopt stringent water quality standards, the demand for reliable disinfectants like potassium permanganate is expected to rise. Innovations in production techniques and formulations may also facilitate wider application and acceptance. Stakeholders that adapt to regulatory changes and invest in sustainable practices will likely thrive in this evolving landscape.
Kenya Potassium permanganate Market Latest Developments (May 2025 - June 2026)
Recent developments indicate a notable shift in the industry towards adopting cleaner production methods for potassium permanganate. Companies are exploring innovative technologies that improve efficiency while reducing environmental impact. Additionally, partnerships between governmental agencies and local manufacturers are emerging to boost domestic production capabilities, responding to the pressing demand for water treatment solutions.
Kenya Potassium permanganate Market - Key Attractiveness of the Report
- 10 Years of Market Numbers
- Historical Data Starting from 2022 to 2025
- Base Year: 2025
- Forecast Data until 2032
- Key Performance Indicators Impacting the Market
- Major Upcoming Developments and Projects
Key Highlights of the Report:
- Kenya Potassium permanganate Market Outlook
- Market Size of Kenya Potassium permanganate Market, 2025
- Forecast of Kenya Potassium permanganate Market, 2032
- Historical Data and Forecast of Kenya Potassium permanganate Revenues & Volume for the Period 2022-2032F
- Kenya Potassium permanganate Market Trend Evolution
- Kenya Potassium permanganate Market Drivers and Challenges
- Kenya Potassium permanganate Price Trends
- Kenya Potassium permanganate Porter's Five Forces
- Kenya Potassium permanganate Industry Life Cycle
- Historical Data and Forecast of Kenya Potassium permanganate Market Revenues & Volume By Grade for the Period 2022-2032F
- Historical Data and Forecast of Kenya Potassium permanganate Market Revenues & Volume By Free Flowing Grade for the Period 2022-2032F
- Historical Data and Forecast of Kenya Potassium permanganate Market Revenues & Volume By Technical Grade for the Period 2022-2032F
- Historical Data and Forecast of Kenya Potassium permanganate Market Revenues & Volume By Pharmaceutical Grade for the Period 2022-2032F
- Historical Data and Forecast of Kenya Potassium permanganate Market Revenues & Volume By Application for the Period 2022-2032F
- Historical Data and Forecast of Kenya Potassium permanganate Market Revenues & Volume By Water Treatment for the Period 2022-2032F
- Historical Data and Forecast of Kenya Potassium permanganate Market Revenues & Volume By Waste Water Treatment for the Period 2022-2032F
- Historical Data and Forecast of Kenya Potassium permanganate Market Revenues & Volume By Chemicals Manufacturing for the Period 2022-2032F
- Historical Data and Forecast of Kenya Potassium permanganate Market Revenues & Volume By Aquaculture for the Period 2022-2032F
- Historical Data and Forecast of Kenya Potassium permanganate Market Revenues & Volume By Metal Processing for the Period 2022-2032F
- Historical Data and Forecast of Kenya Potassium permanganate Market Revenues & Volume By Air and Gas Purification for the Period 2022-2032F
- Historical Data and Forecast of Kenya Potassium permanganate Market Revenues & Volume By Others for the Period 2022-2032F
- Kenya Potassium permanganate Import Export Trade Statistics
- Market Opportunity Assessment By Grade
- Market Opportunity Assessment By Application
- Kenya Potassium permanganate Top Companies Market Share
- Kenya Potassium permanganate Competitive Benchmarking By Technical and Operational Parameters
- Kenya Potassium permanganate Company Profiles
- Kenya Potassium permanganate Key Strategic Recommendations
Kenya Potassium permanganate Market - Frequently Asked Questions
The Kenya Potassium permanganate Market was estimated at USD 204 Million in 2025 and is projected to reach USD 271 Million by 2032, growing at a CAGR of 4.1% from 2026 to 2032. This growth is largely fueled by increasing demands in water treatment and industrial processes.
The increasing necessity for safe drinking water and stringent regulatory requirements for water quality are primary drivers. Additionally, the chemical's versatile applications in industrial processes are contributing significantly to its demand.
Environmental regulations necessitate investment in sustainable practices, creating a dual challenge for producers. Compliance often leads to increased costs, which can be a barrier for local manufacturers relying on imported materials.
Innovations focus on cleaner production techniques and integrated treatment solutions that utilize potassium permanganate more efficiently. These advancements not only enhance effectiveness but also align with sustainability goals.
Government policy is crucial, as it supports infrastructure development and enforces regulations that promote clean water initiatives. Collaborative efforts between public and private sectors are also paving the way for enhanced production capabilities.
6Wresearch actively monitors the Kenya Potassium permanganate Market and publishes its comprehensive annual report, highlighting emerging trends, growth drivers, revenue analysis, and forecast outlook. Our insights help businesses to make data-backed strategic decisions with ongoing market dynamics. Our analysts track relevent industries related to the Kenya Potassium permanganate Market, allowing our clients with actionable intelligence and reliable forecasts tailored to emerging regional needs.
Yes, we provide customisation as per your requirements. To learn more, feel free to contact us on sales@6wresearch.com
1 Executive Summary |
2 Introduction |
2.1 Key Highlights of the Report |
2.2 Report Description |
2.3 Market Scope & Segmentation |
2.4 Research Methodology |
2.5 Assumptions |
3 Kenya Potassium permanganate Market Overview |
3.1 Kenya Country Macro Economic Indicators |
3.2 Kenya Potassium permanganate Market Revenues & Volume, 2022 & 2032F |
3.3 Kenya Potassium permanganate Market - Industry Life Cycle |
3.4 Kenya Potassium permanganate Market - Porter's Five Forces |
3.5 Kenya Potassium permanganate Market Revenues & Volume Share, By Grade, 2022 & 2032F |
3.6 Kenya Potassium permanganate Market Revenues & Volume Share, By Form, 2022 & 2032F |
4 Kenya Potassium permanganate Market Dynamics |
4.1 Impact Analysis |
4.2 Market Drivers |
4.3 Market Restraints |
5 Kenya Potassium permanganate Market Trends |
6 Kenya Potassium permanganate Market, By Types |
6.1 Kenya Potassium permanganate Market, By Grade |
6.1.1 Overview and Analysis |
6.1.2 Kenya Potassium permanganate Market Revenues & Volume, By Grade, 2022-2032F |
6.1.3 Kenya Potassium permanganate Market Revenues & Volume, By Free Flowing Grade, 2022-2032F |
6.1.4 Kenya Potassium permanganate Market Revenues & Volume, By Technical Grade, 2022-2032F |
6.1.5 Kenya Potassium permanganate Market Revenues & Volume, By Pharmaceutical Grade, 2022-2032F |
6.2 Kenya Potassium permanganate Market, By Application |
6.2.1 Overview and Analysis |
6.2.2 Kenya Potassium permanganate Market Revenues & Volume, By Water Treatment, 2022-2032F |
6.2.3 Kenya Potassium permanganate Market Revenues & Volume, By Waste Water Treatment, 2022-2032F |
6.2.4 Kenya Potassium permanganate Market Revenues & Volume, By Chemicals Manufacturing, 2022-2032F |
6.2.5 Kenya Potassium permanganate Market Revenues & Volume, By Aquaculture, 2022-2032F |
6.2.6 Kenya Potassium permanganate Market Revenues & Volume, By Metal Processing, 2022-2032F |
6.2.7 Kenya Potassium permanganate Market Revenues & Volume, By Air and Gas Purification, 2022-2032F |
7 Kenya Potassium permanganate Market Import-Export Trade Statistics |
7.1 Kenya Potassium permanganate Market Export to Major Countries |
7.2 Kenya Potassium permanganate Market Imports from Major Countries |
8 Kenya Potassium permanganate Market Key Performance Indicators |
9 Kenya Potassium permanganate Market - Opportunity Assessment |
9.1 Kenya Potassium permanganate Market Opportunity Assessment, By Grade, 2022 & 2032F |
9.2 Kenya Potassium permanganate Market Opportunity Assessment, By Application, 2022 & 2032F |
10 Kenya Potassium permanganate Market - Competitive Landscape |
10.1 Kenya Potassium permanganate Market Revenue Share, By Companies, 2025 |
10.2 Kenya Potassium permanganate Market Competitive Benchmarking, By Operating and Technical Parameters |
11 Company Profiles |
12 Recommendations |
13 Disclaimer |
Global Go To Market Strategy - 2030
Export potential enables firms to identify high-growth global markets with greater confidence by combining advanced trade intelligence with a structured quantitative methodology. The framework analyzes emerging demand trends and country-level import patterns while integrating macroeconomic and trade datasets such as GDP and population forecasts, bilateral import–export flows, tariff structures, elasticity differentials between developed and developing economies, geographic distance, and import demand projections. Using weighted trade values from 2020–2024 as the base period to project country-to-country export potential for 2030, these inputs are operationalized through calculated drivers such as gravity model parameters, tariff impact factors, and projected GDP per-capita growth. Through an analysis of hidden potentials, demand hotspots, and market conditions that are most favorable to success, this method enables firms to focus on target countries, maximize returns, and global expansion with data, backed by accuracy.
By factoring in the projected importer demand gap that is currently unmet and could be potential opportunity, it identifies the potential for the Exporter (Country) among 190 countries, against the general trade analysis, which identifies the biggest importer or exporter.
To discover high-growth global markets and optimize your business strategy:
Click Here
Pricing
- Single User License$ 1,995
- Department License$ 2,400
- Site License$ 3,120
- Global License$ 3,795

Leadership Perspectives from Industry Events
Search
Thought Leadership and Analyst Meet


Our Clients
6WResearch In News
- India Air Conditioner Market Set for Strong Rebound in 2026 After Weather-Led Correction and GST-Driven Recovery: 6Wresearch
- ADAS in India: How Automatic Emergency Braking, Blind Spot Detection & Driver Monitoring are Transforming Road Safety
- Doha a strategic location for EV manufacturing hub: IPA Qatar
- Demand for luxury TVs surging in the GCC, says Samsung
- Empowering Growth: The Thriving Journey of Bangladesh’s Cable Industry
- Demand for luxury TVs surging in the GCC, says Samsung
Latest Reports
- Poland Fire Protection Systems Market (2026-2032)
- Cape Verde Portable Hand-Thrown Extinguisher Market (2026-2032)
- Canada Portable Hand-Thrown Extinguisher Market (2026-2032)
- Cameroon Portable Hand-Thrown Extinguisher Market (2026-2032)
- Burundi Portable Hand-Thrown Extinguisher Market (2026-2032)
- Burkina Faso Portable Hand-Thrown Extinguisher Market (2026-2032)
- Bulgaria Portable Hand-Thrown Extinguisher Market (2026-2032)
- Brunei Portable Hand-Thrown Extinguisher Market (2026-2032)
- Botswana Portable Hand-Thrown Extinguisher Market (2026-2032)
- Bosnia and Herzegovina Portable Hand-Thrown Extinguisher Market (2026-2032)
Industry Events and Analyst Meet

HIMTEX 2026

India Refining Summit 2026

India EV Show 2026

EV tech India Expo 2026

Auto Tech Asia 2026
Whitepaper
- Middle East & Africa Commercial Security Market Click here to view more.
- Middle East & Africa Fire Safety Systems & Equipment Market Click here to view more.
- GCC Drone Market Click here to view more.
- Middle East Lighting Fixture Market Click here to view more.
- GCC Physical & Perimeter Security Market Click here to view more.