Kenya Power Supply Market (2026-2032) | Trends, Forecast, Outlook, Industry, Analysis, Growth, Value, Revenue, Companies, Share & Size
Market Forecast By Output Power (Power Supply With Low Output (500 W and Below), Power Supply With Medium Output (500–1,000 W), Power Supply With High Output (More Than 1,000 W)), By Type (AC-DC Power Supply, DC-DC Power Supply), By Vertical (Medical & Healthcare, Military & Aerospace, Telecommunications, Consumer Electronics, Transportation, Lighting, Food & Beverages, Industrial) And Competitive Landscape
| Product Code: ETC014230 | Publication Date: Oct 2020 | Updated Date: Jun 2026 | Product Type: Report | |
| Publisher: 6Wresearch | Author: Ravi Bhandari | No. of Pages: 70 | No. of Figures: 35 | No. of Tables: 5 |
Kenya Power Supply Market Summary
The kenya power supply market was estimated at USD 368 Million in 2025 and is projected to reach USD 486 Million by 2032, growing at a CAGR of 4.5% from 2026 to 2032.
Kenya Power Supply Market Growth Rate Analysis (2021-2032)
The Kenya Power Supply Market has exhibited stable growth over the past few years, with notable yearly growth rates of 5.1% in 2021 and 4.8% in 2022, driven by increased consumer demand and investments in renewable energy infrastructure. In 2023, growth slightly rebounded to 4.9%, indicating ongoing commitment to the energy transition and technological advancements. However, projections show a modest dip to 4.5% in 2024, likely due to infrastructural challenges and regulatory adjustments. The market is expected to stabilize around 4.7% to 5.0% from 2025 to 2032, reflecting a consistent effort to enhance service delivery and integrate digital solutions within the sector.
Kenya Power Supply Market Year-wise Growth Rate and Key Drivers
This graph highlights how the Kenya Power Supply Market has steadily grown over the past five years, supported by major growth factors.
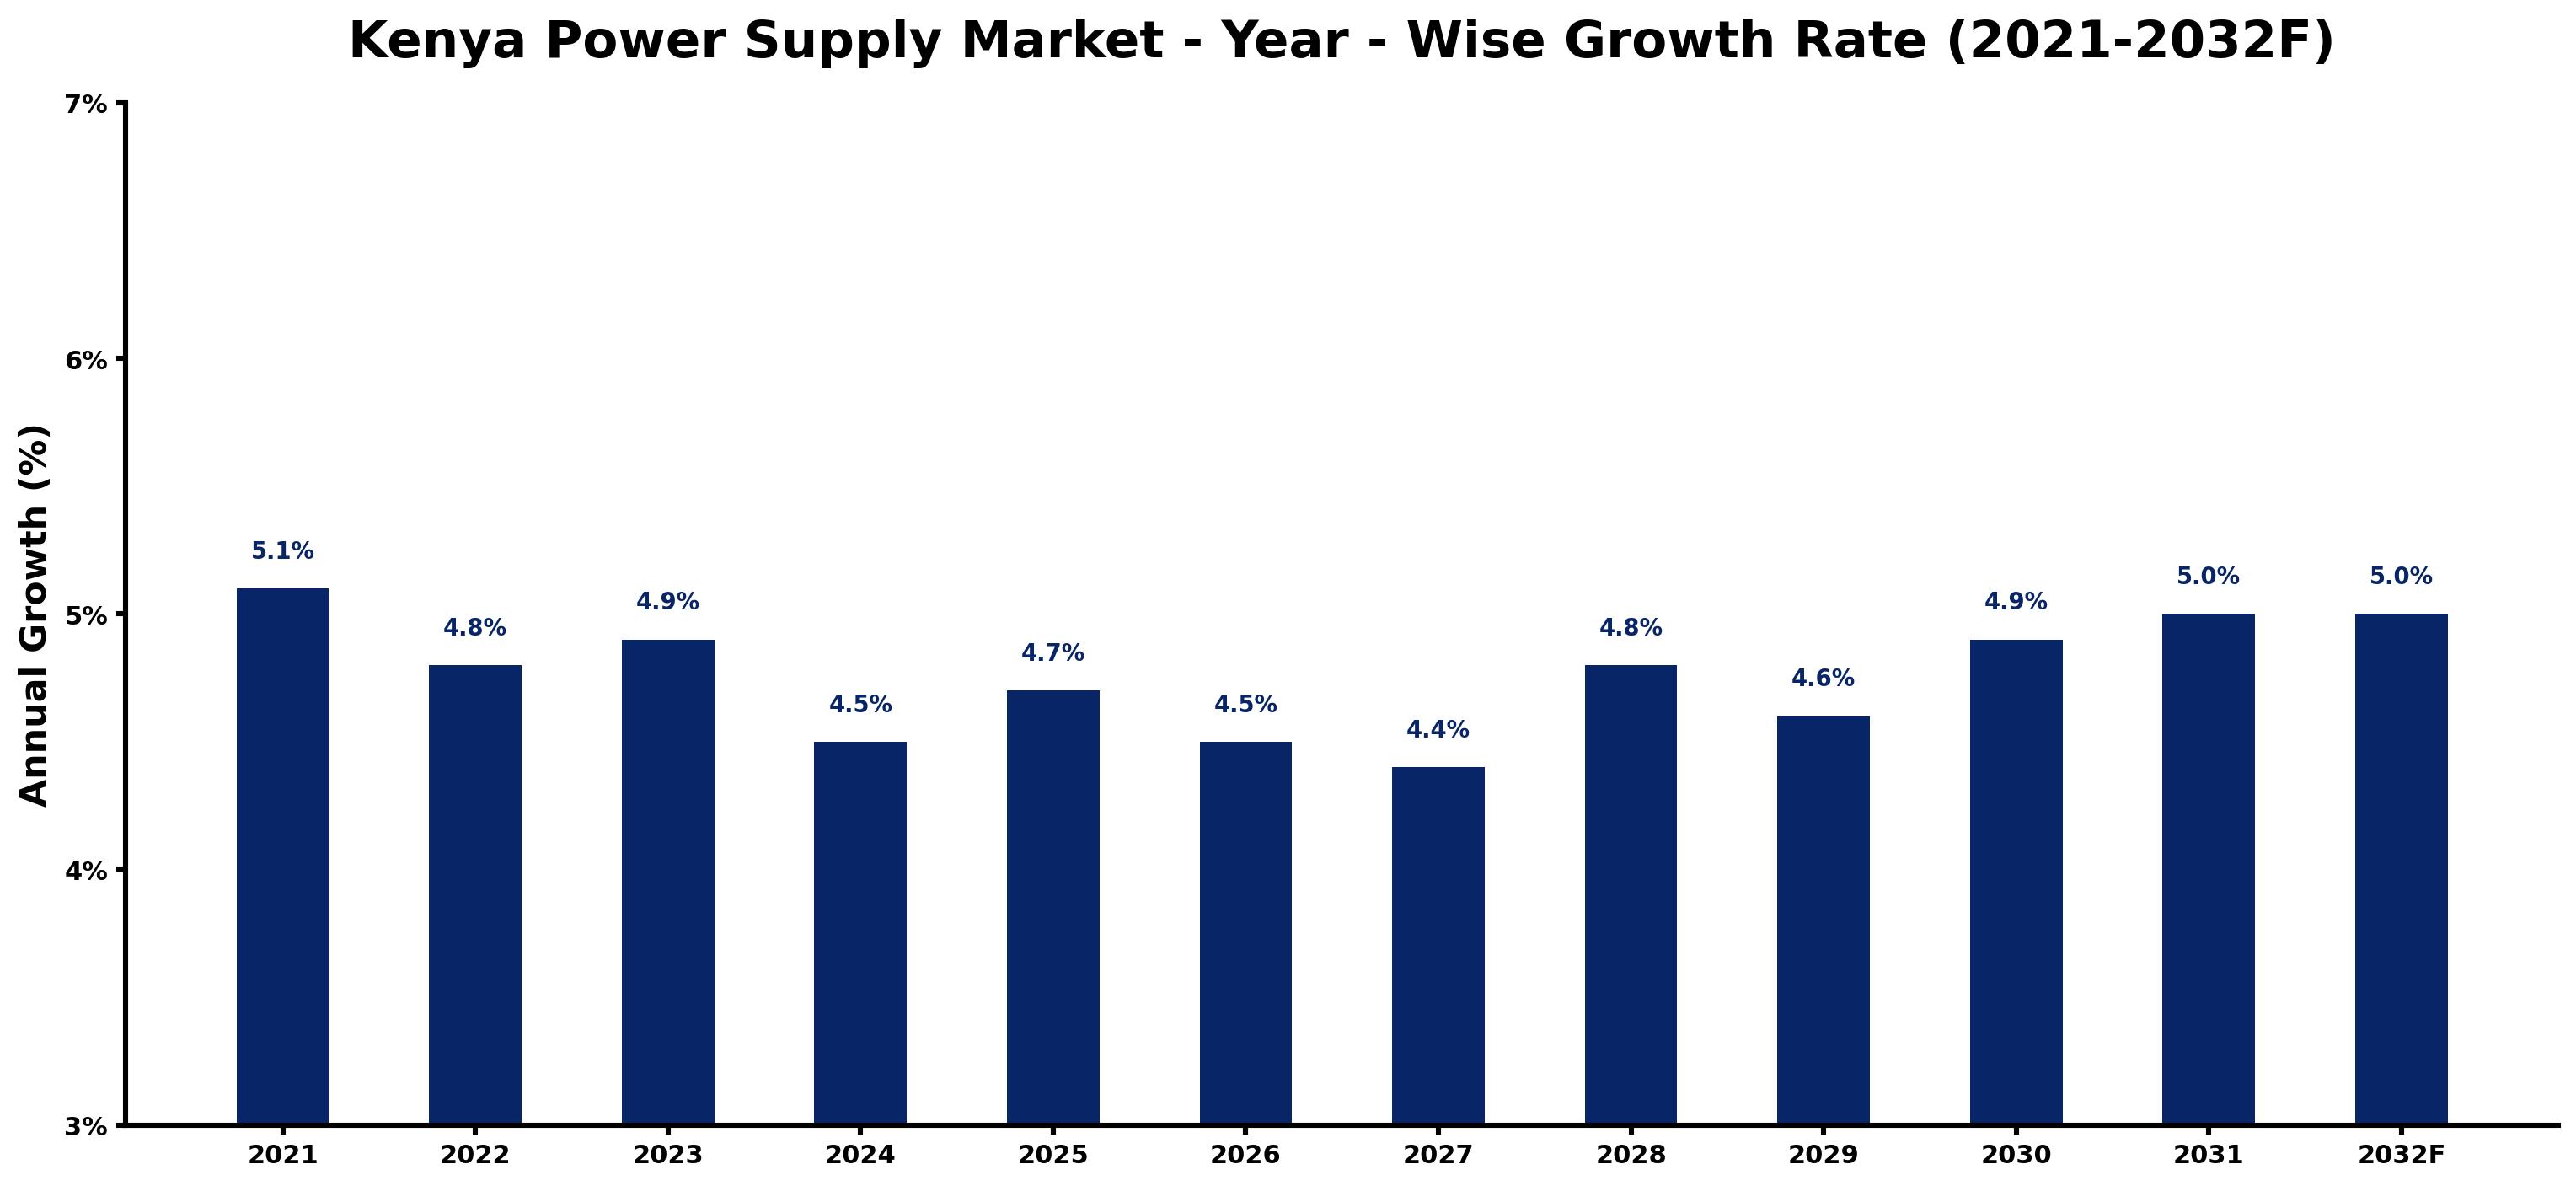
The table below presents the year wise growth rates along with the key drivers influencing the market
| Year | Growth Rate | Major Drivers |
| 2021 | 5.1% | Post-lockdown retail projects increased electricity demand in urban centers significantly. |
| 2022 | 4.8% | Infrastructure investments focused on renewable energy sources enhanced overall grid reliability. |
| 2023 | 4.9% | Technological innovations expanded electricity access in underserved rural communities nationwide. |
| 2024 | 4.5% | Corporate sustainability goals prompted large firms to shift towards renewable energy solutions. |
| 2025 | 4.7% | Public-private partnerships accelerated the rollout of off-grid solar solutions across the country. |
| 2026 | 4.5% | Investment in smart grid technologies improved efficiency in energy distribution networks. |
| 2027 | 4.4% | Emerging local startups introduced innovative energy solutions for residential consumers. |
| 2028 | 4.8% | Climate change concerns motivated increased interest in sustainable energy practices nationwide. |
| 2029 | 4.6% | Regional collaborations with neighboring countries enhanced energy security and resource sharing. |
| 2030 | 4.9% | Legislative reforms encouraged private sector investments in renewable energy projects. |
| 2031 | 5.0% | Consumer awareness regarding energy efficiency led to higher adoption of solar technologies. |
| 2032 | 5.0% | The shift towards electric mobility created new demand for reliable power supply infrastructure. |
Note - Market size estimations and growth projections presented in this report are based on 6Wresearch's advanced forecasting approach, validated with industry datasets as of June 2026.
Kenya Power Supply Market Synopsis
The Kenya Power Supply Market is projected to reach 4.5% and witness significant growth during the forecast period (2026-2032). This market is characterized by a burgeoning demand for reliable and uninterrupted electricity across various sectors, including residential, commercial, and industrial. The ongoing urbanization and industrialization in Kenya are contributing to an increasing requirement for stable power supply solutions. Enhanced investments in expanding and upgrading the national power grid, along with the integration of renewable energy sources, are fundamental drivers of this market. Furthermore, advancements in power supply technologies and infrastructure improvements are markedly improving power reliability and efficiency.
Kenya Power Supply Market Growth Drivers
The growth of the Kenya Power Supply Market is driven by several interrelated factors:
- Rising electricity demand is observed across residential, commercial, and industrial sectors, propelled by population growth and economic development.
- Infrastructure development projects aimed at expanding and modernizing the existing power grid are crucial for accommodating new connections and higher power loads.
- Efforts to increase electricity access in rural regions are pivotal for fostering inclusivity and improving quality of life.
- The integration of renewable energy sources is not only environmentally sustainable but also cost-effective in the long run.
- Adoption of smart grid technologies enhances the efficiency of electricity distribution and helps reduce losses associated with energy theft.
Kenya Power Supply Market Challenges and Restraints
Despite its promising growth trajectory, the Kenya Power Supply Market faces a myriad of challenges:
- The necessity for extensive investments in upgrading the transmission and distribution network is critical to meet the escalating demand for electricity.
- Challenges pertaining to energy theft and non-payment hinder the financial stability of utilities and affect their ability to invest in improvements.
- Revenue collection issues pose a significant barrier, limiting the ability to fund necessary infrastructure projects.
- There is a pressing need to diversify the energy mix to minimize reliance on imported fuels and alleviate the impacts of price volatility.
- Regulatory frameworks must evolve to address environmental concerns and promote sustainable practices in energy generation and distribution.
Kenya Power Supply Market Government Investment and Initiatives
The government of Kenya is actively engaged in initiatives aimed at enhancing the power supply market. Key efforts include:
- Implementation of national electrification programs focused on increasing access to electricity, particularly in underserved rural communities.
- Public-private partnerships are being encouraged to mobilize investment for critical infrastructure projects in the power sector.
- The government is promoting renewable energy through various incentives, including feed-in tariffs and tax breaks for clean energy projects.
- Strategic development plans are in place to modernize existing facilities and introduce innovative technologies in electricity generation and distribution.
- Regulatory reforms are being introduced to improve the operational efficiency of utilities and increase their attractiveness to potential investors.
Kenya Power Supply Market Latest Developments (May 2025 - June 2026)
Between May 2025 and June 2026, the Kenya Power Supply Market has seen pivotal advancements. The government has accelerated its commitment to renewable energy, enhancing policy frameworks to attract investment in solar and wind projects. A significant focus has been placed on modernizing the power grid to improve reliability and efficiency in electricity distribution. Furthermore, various initiatives targeting energy theft have been implemented, aimed at reducing losses and improving revenue collection. The deployment of smart metering technologies marks a noteworthy trend, facilitating better management of energy consumption. Additionally, ongoing discussions around energy diversification reflect an effort to reduce dependency on traditional fuel sources and promote sustainable practices within the sector.
Kenya Power Supply Market - Key Attractiveness of the Report
- 10 Years of Market Numbers
- Historical Data Starting from 2022 to 2025
- Base Year: 2025
- Forecast Data until 2032
- Key Performance Indicators Impacting the Market
- Major Upcoming Developments and Projects
Key Highlights of the Report:
- Kenya Power Supply Market Outlook
- Market Size of Kenya Power Supply Market, 2025
- Forecast of Kenya Power Supply Market, 2032
- Historical Data and Forecast of Kenya Power Supply Revenues & Volume for the Period 2022-2032F
- Kenya Power Supply Market Trend Evolution
- Kenya Power Supply Market Drivers and Challenges
- Kenya Power Supply Price Trends
- Kenya Power Supply Porter's Five Forces
- Kenya Power Supply Industry Life Cycle
- Historical Data and Forecast of Kenya Power Supply Market Revenues & Volume By Output Power for the Period 2022-2032F
- Historical Data and Forecast of Kenya Power Supply Market Revenues & Volume By Power Supply With Low Output (500 W and Below) for the Period 2022-2032F
- Historical Data and Forecast of Kenya Power Supply Market Revenues & Volume By Power Supply With Medium Output (500?1,000 W) for the Period 2022-2032F
- Historical Data and Forecast of Kenya Power Supply Market Revenues & Volume By Power Supply With High Output (More Than 1,000 W) for the Period 2022-2032F
- Historical Data and Forecast of Kenya Power Supply Market Revenues & Volume By Type for the Period 2022-2032F
- Historical Data and Forecast of Kenya Power Supply Market Revenues & Volume By AC-DC Power Supply for the Period 2022-2032F
- Historical Data and Forecast of Kenya Power Supply Market Revenues & Volume By DC-DC Power Supply for the Period 2022-2032F
- Historical Data and Forecast of Kenya Power Supply Market Revenues & Volume By Vertical for the Period 2022-2032F
- Historical Data and Forecast of Kenya Power Supply Market Revenues & Volume By Medical & Healthcare for the Period 2022-2032F
- Historical Data and Forecast of Kenya Power Supply Market Revenues & Volume By Military & Aerospace for the Period 2022-2032F
- Historical Data and Forecast of Kenya Power Supply Market Revenues & Volume By Telecommunications for the Period 2022-2032F
- Historical Data and Forecast of Kenya Power Supply Market Revenues & Volume By Consumer Electronics for the Period 2022-2032F
- Historical Data and Forecast of Kenya Power Supply Market Revenues & Volume By Transportation for the Period 2022-2032F
- Historical Data and Forecast of Kenya Power Supply Market Revenues & Volume By Lighting for the Period 2022-2032F
- Historical Data and Forecast of Kenya Power Supply Market Revenues & Volume By Food & Beverages for the Period 2022-2032F
- Historical Data and Forecast of Kenya Power Supply Market Revenues & Volume By Industrial for the Period 2022-2032F
- Kenya Power Supply Import Export Trade Statistics
- Market Opportunity Assessment By Output Power
- Market Opportunity Assessment By Type
- Market Opportunity Assessment By Vertical
- Kenya Power Supply Top Companies Market Share
- Kenya Power Supply Competitive Benchmarking By Technical and Operational Parameters
- Kenya Power Supply Company Profiles
- Kenya Power Supply Key Strategic Recommendations
Frequently Asked Questions About the Market Study (FAQs):
The market growth is primarily driven by increasing electricity demand, infrastructure development, and the integration of renewable energy sources.
Key challenges include the need for significant capital investments in infrastructure, issues related to energy theft, and ensuring universal access to electricity.
The government is investing in electrification initiatives, promoting public-private partnerships, and implementing regulatory reforms to enhance market efficiency.
Recent developments include advancements in renewable energy projects, modernization of the power grid, and initiatives aimed at reducing energy theft.
6Wresearch actively monitors the Kenya Power Supply Market and publishes its comprehensive annual report, highlighting emerging trends, growth drivers, revenue analysis, and forecast outlook. Our insights help businesses to make data-backed strategic decisions with ongoing market dynamics. Our analysts track relevent industries related to the Kenya Power Supply Market, allowing our clients with actionable intelligence and reliable forecasts tailored to emerging regional needs.
Yes, we provide customisation as per your requirements. To learn more, feel free to contact us on sales@6wresearch.com
1 Executive Summary |
2 Introduction |
2.1 Key Highlights of the Report |
2.2 Report Description |
2.3 Market Scope & Segmentation |
2.4 Research Methodology |
2.5 Assumptions |
3 Kenya Power Supply Market Overview |
3.1 Kenya Country Macro Economic Indicators |
3.2 Kenya Power Supply Market Revenues & Volume, 2022 & 2032F |
3.3 Kenya Power Supply Market - Industry Life Cycle |
3.4 Kenya Power Supply Market - Porter's Five Forces |
3.5 Kenya Power Supply Market Revenues & Volume Share, By Output Power, 2022 & 2032F |
3.6 Kenya Power Supply Market Revenues & Volume Share, By Type, 2022 & 2032F |
3.7 Kenya Power Supply Market Revenues & Volume Share, By Vertical, 2022 & 2032F |
4 Kenya Power Supply Market Dynamics |
4.1 Impact Analysis |
4.2 Market Drivers |
4.3 Market Restraints |
5 Kenya Power Supply Market Trends |
6 Kenya Power Supply Market, By Types |
6.1 Kenya Power Supply Market, By Output Power |
6.1.1 Overview and Analysis |
6.1.2 Kenya Power Supply Market Revenues & Volume, By Output Power, 2022-2032F |
6.1.3 Kenya Power Supply Market Revenues & Volume, By Power Supply With Low Output (500 W and Below), 2022-2032F |
6.1.4 Kenya Power Supply Market Revenues & Volume, By Power Supply With Medium Output (500?1,000 W), 2022-2032F |
6.1.5 Kenya Power Supply Market Revenues & Volume, By Power Supply With High Output (More Than 1,000 W), 2022-2032F |
6.2 Kenya Power Supply Market, By Type |
6.2.1 Overview and Analysis |
6.2.2 Kenya Power Supply Market Revenues & Volume, By AC-DC Power Supply, 2022-2032F |
6.2.3 Kenya Power Supply Market Revenues & Volume, By DC-DC Power Supply, 2022-2032F |
6.3 Kenya Power Supply Market, By Vertical |
6.3.1 Overview and Analysis |
6.3.2 Kenya Power Supply Market Revenues & Volume, By Medical & Healthcare, 2022-2032F |
6.3.3 Kenya Power Supply Market Revenues & Volume, By Military & Aerospace, 2022-2032F |
6.3.4 Kenya Power Supply Market Revenues & Volume, By Telecommunications, 2022-2032F |
6.3.5 Kenya Power Supply Market Revenues & Volume, By Consumer Electronics, 2022-2032F |
6.3.6 Kenya Power Supply Market Revenues & Volume, By Transportation, 2022-2032F |
6.3.7 Kenya Power Supply Market Revenues & Volume, By Lighting, 2022-2032F |
6.3.8 Kenya Power Supply Market Revenues & Volume, By Industrial, 2022-2032F |
6.3.9 Kenya Power Supply Market Revenues & Volume, By Industrial, 2022-2032F |
7 Kenya Power Supply Market Import-Export Trade Statistics |
7.1 Kenya Power Supply Market Export to Major Countries |
7.2 Kenya Power Supply Market Imports from Major Countries |
8 Kenya Power Supply Market Key Performance Indicators |
9 Kenya Power Supply Market - Opportunity Assessment |
9.1 Kenya Power Supply Market Opportunity Assessment, By Output Power, 2022 & 2032F |
9.2 Kenya Power Supply Market Opportunity Assessment, By Type, 2022 & 2032F |
9.3 Kenya Power Supply Market Opportunity Assessment, By Vertical, 2022 & 2032F |
10 Kenya Power Supply Market - Competitive Landscape |
10.1 Kenya Power Supply Market Revenue Share, By Companies, 2025 |
10.2 Kenya Power Supply Market Competitive Benchmarking, By Operating and Technical Parameters |
11 Company Profiles |
12 Recommendations |
13 Disclaimer |
Global Go To Market Strategy - 2030
Export potential enables firms to identify high-growth global markets with greater confidence by combining advanced trade intelligence with a structured quantitative methodology. The framework analyzes emerging demand trends and country-level import patterns while integrating macroeconomic and trade datasets such as GDP and population forecasts, bilateral import–export flows, tariff structures, elasticity differentials between developed and developing economies, geographic distance, and import demand projections. Using weighted trade values from 2020–2024 as the base period to project country-to-country export potential for 2030, these inputs are operationalized through calculated drivers such as gravity model parameters, tariff impact factors, and projected GDP per-capita growth. Through an analysis of hidden potentials, demand hotspots, and market conditions that are most favorable to success, this method enables firms to focus on target countries, maximize returns, and global expansion with data, backed by accuracy.
By factoring in the projected importer demand gap that is currently unmet and could be potential opportunity, it identifies the potential for the Exporter (Country) among 190 countries, against the general trade analysis, which identifies the biggest importer or exporter.
To discover high-growth global markets and optimize your business strategy:
Click Here
Pricing
- Single User License$ 1,995
- Department License$ 2,400
- Site License$ 3,120
- Global License$ 3,795

Leadership Perspectives from Industry Events
Search
Thought Leadership and Analyst Meet


Our Clients
6WResearch In News
- India Air Conditioner Market Set for Strong Rebound in 2026 After Weather-Led Correction and GST-Driven Recovery: 6Wresearch
- ADAS in India: How Automatic Emergency Braking, Blind Spot Detection & Driver Monitoring are Transforming Road Safety
- Doha a strategic location for EV manufacturing hub: IPA Qatar
- Demand for luxury TVs surging in the GCC, says Samsung
- Empowering Growth: The Thriving Journey of Bangladesh’s Cable Industry
- Demand for luxury TVs surging in the GCC, says Samsung
Latest Reports
- Poland Fire Protection Systems Market (2026-2032)
- Cape Verde Portable Hand-Thrown Extinguisher Market (2026-2032)
- Canada Portable Hand-Thrown Extinguisher Market (2026-2032)
- Cameroon Portable Hand-Thrown Extinguisher Market (2026-2032)
- Burundi Portable Hand-Thrown Extinguisher Market (2026-2032)
- Burkina Faso Portable Hand-Thrown Extinguisher Market (2026-2032)
- Bulgaria Portable Hand-Thrown Extinguisher Market (2026-2032)
- Brunei Portable Hand-Thrown Extinguisher Market (2026-2032)
- Botswana Portable Hand-Thrown Extinguisher Market (2026-2032)
- Bosnia and Herzegovina Portable Hand-Thrown Extinguisher Market (2026-2032)
Industry Events and Analyst Meet

HIMTEX 2026

India Refining Summit 2026

India EV Show 2026

EV tech India Expo 2026

Auto Tech Asia 2026
Whitepaper
- Middle East & Africa Commercial Security Market Click here to view more.
- Middle East & Africa Fire Safety Systems & Equipment Market Click here to view more.
- GCC Drone Market Click here to view more.
- Middle East Lighting Fixture Market Click here to view more.
- GCC Physical & Perimeter Security Market Click here to view more.