Kenya Professional Lighting Market (2026-2032) | Companies, Industry, Growth, Revenue, Outlook, Trends, Size, Share, Analysis, Value & Forecast
Market Forecast By Light Source (LEDs, Others (halogen lamps, xenon bulbs, incandescent lamps) ), By Applications (Entertainment, Stage lighting, Medical, UV Lamps, Others) And Competitive Landscape
| Product Code: ETC005530 | Publication Date: Sep 2020 | Updated Date: Jun 2026 | Product Type: Report | |
| Publisher: 6Wresearch | Author: Ravi Bhandari | No. of Pages: 70 | No. of Figures: 35 | No. of Tables: 5 |
Kenya Professional Lighting Market Summary
The kenya professional lighting market was estimated at USD 474 Million in 2025 and is projected to reach USD 688 Million by 2032, growing at a CAGR of 6.0% from 2026 to 2032.
Kenya Professional Lighting Market Growth Rate Analysis (2021-2032)
The Kenya Professional Lighting Market has showcased stable growth over recent years, with annual increases consistently around the 6% mark. After registering a growth of 6.4% in 2021, the market saw even stronger activity in 2022 at 6.6%, primarily driven by rising consumer demand for energy-efficient solutions and ongoing investments in infrastructure development. While growth dipped slightly to 6.3% in 2023, it rebounded to 6.6% in 2024 as advancements in LED technology and a shift towards sustainable practices gained traction. Moving forward, fluctuations in growth rates, like the expected 6.1% in 2025, reflect transitional dynamics in policy and energy transition efforts that continue to reshape consumer preferences and industry standards.
Kenya Professional Lighting Market Year-wise Growth Rate and Key Drivers
This graph highlights how the Kenya Professional Lighting Market has steadily grown over the past five years, supported by major growth factors.
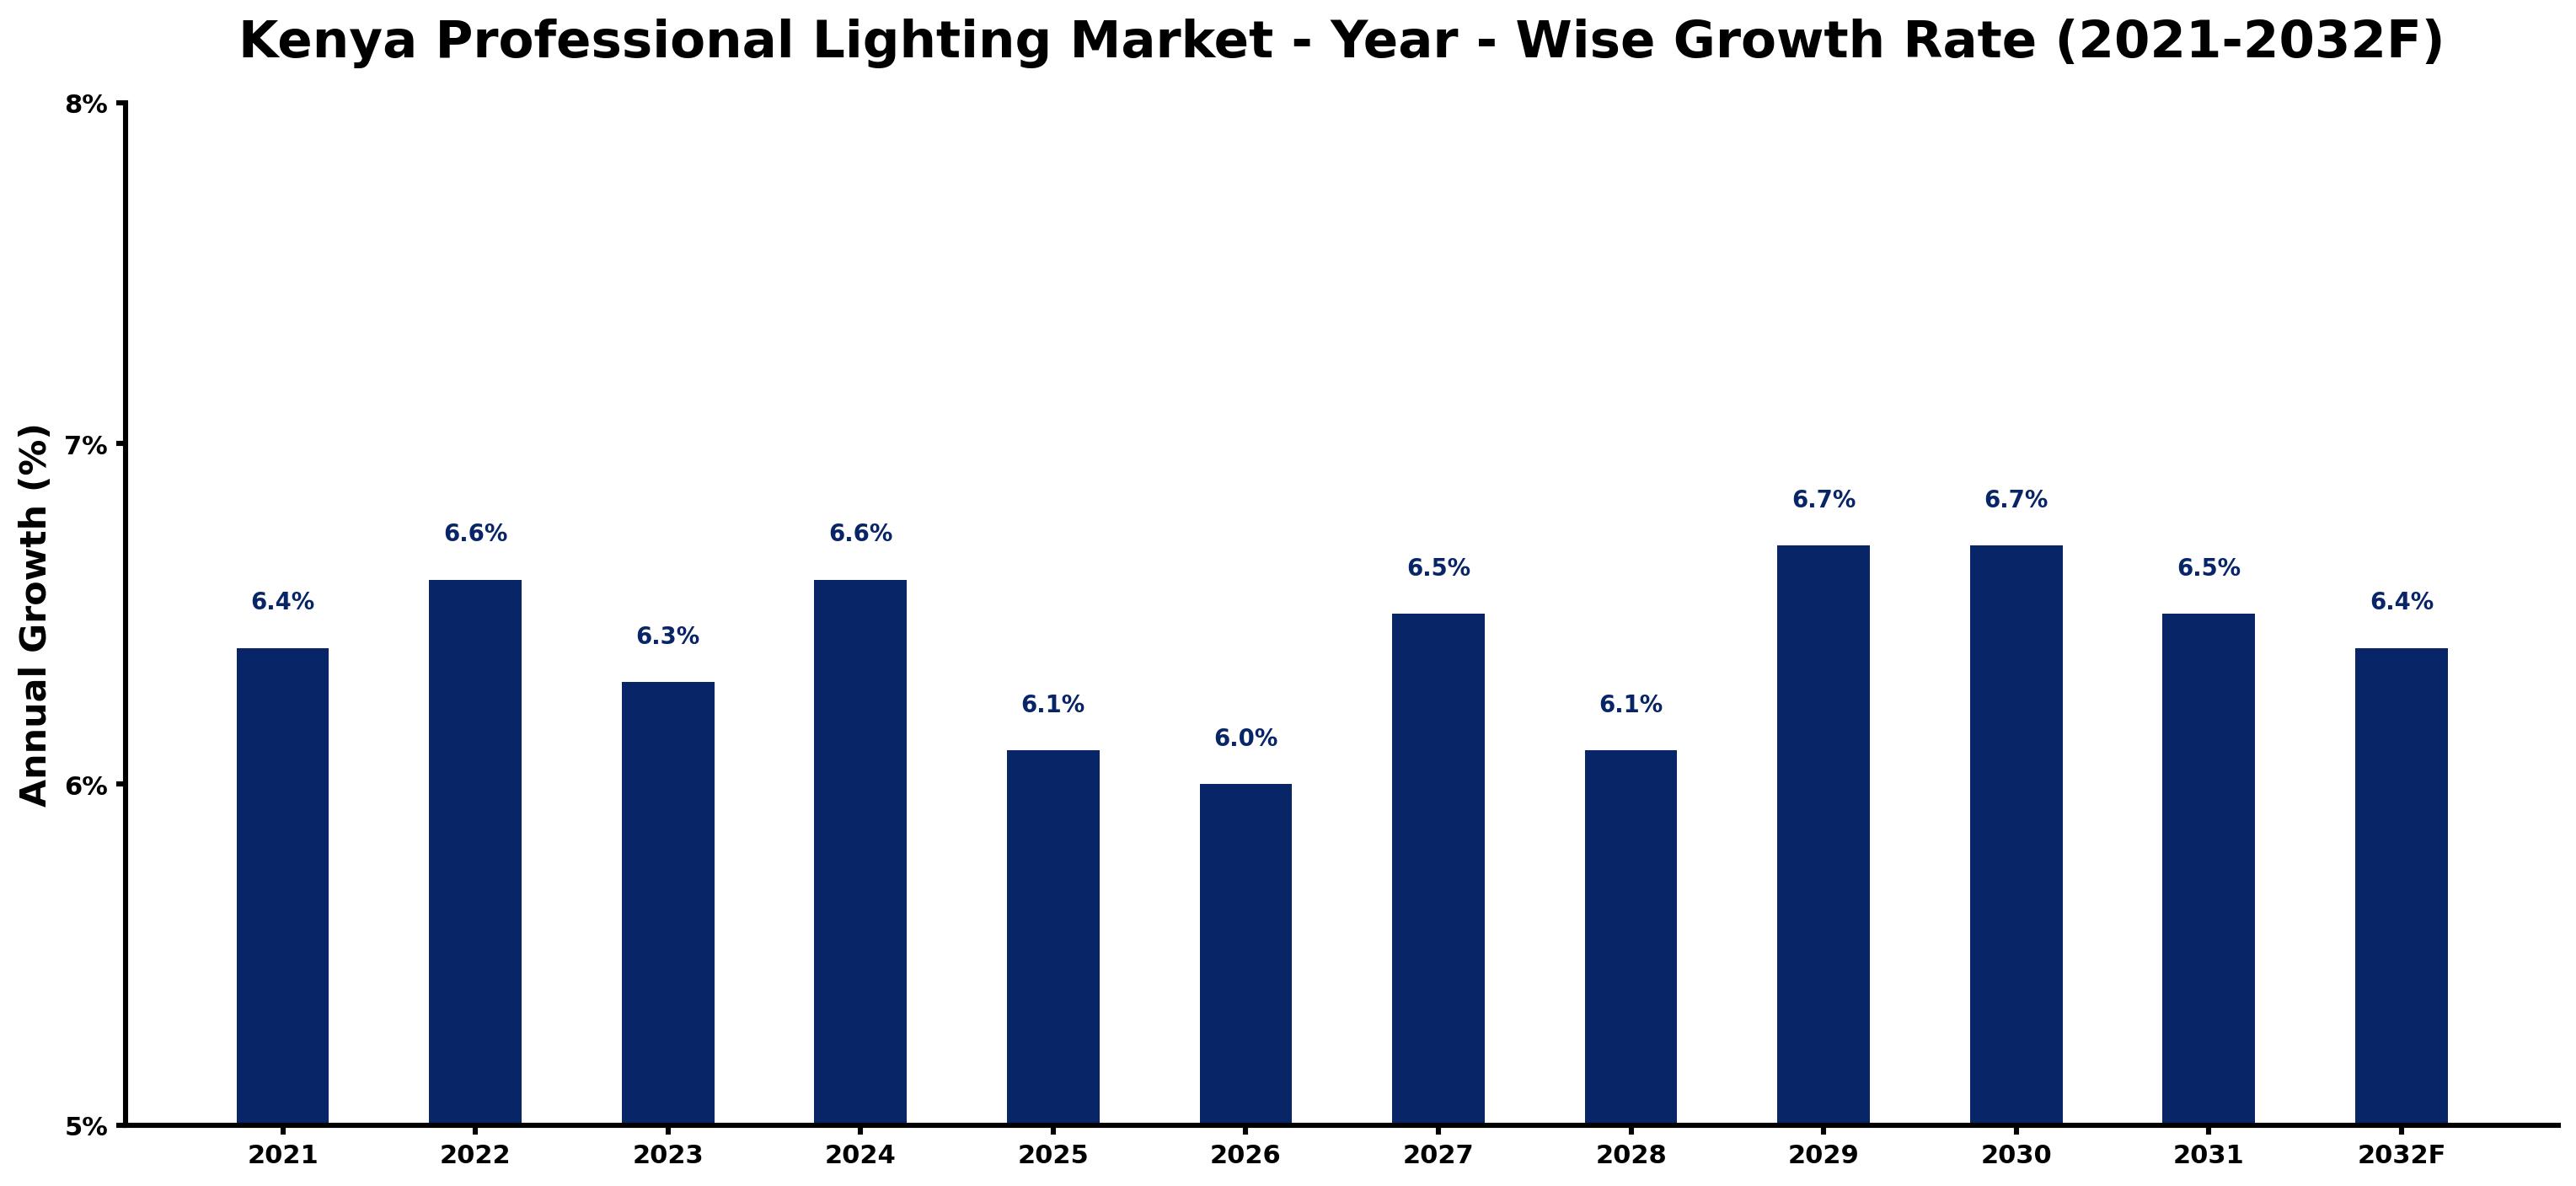
The table below presents the year wise growth rates along with the key drivers influencing the market
| Year | Growth Rate | Major Drivers |
| 2021 | 6.4% | Kenya's urbanization spurred demand for energy-efficient lighting solutions in cities. |
| 2022 | 6.6% | Increasing real estate projects highlighted the importance of innovative lighting designs. |
| 2023 | 6.3% | Local companies began prioritizing affordable LED technology over traditional lighting options. |
| 2024 | 6.6% | Post-pandemic recovery saw renewed investments in commercial and residential buildings. |
| 2025 | 6.1% | Smart city initiatives focused on integrating technology into public lighting systems. |
| 2026 | 6.0% | Corporate sustainability goals encouraged businesses to switch to eco-friendly lighting solutions. |
| 2027 | 6.5% | Consumer awareness about energy savings drove the popularity of solar-powered lights. |
| 2028 | 6.1% | Emergence of local manufacturing facilities reduced costs and improved supply chain efficiency. |
| 2029 | 6.7% | Infrastructure projects, including roads and parks, increased requirements for reliable lighting. |
| 2030 | 6.7% | E-commerce growth led to higher demand for warehouse and distribution center lighting. |
| 2031 | 6.5% | Innovative designs attracted investments in the hospitality sector for aesthetic lighting. |
| 2032 | 6.4% | Integration of IoT technologies transformed traditional lighting into smart lighting systems. |
Note - Market size estimations and growth projections presented in this report are based on 6Wresearch's advanced forecasting approach, validated with industry datasets as of June 2026.
Key Highlights of the Report:
- Kenya Professional Lighting Market Outlook
- Market Size of Kenya Professional Lighting Market, 2025
- Forecast of Kenya Professional Lighting Market, 2032F
- Historical Data and Forecast of Kenya Professional Lighting Revenues & Volume for the Period 2022-2032F
- Kenya Professional Lighting Market Trend Evolution
- Kenya Professional Lighting Market Drivers and Challenges
- Kenya Professional Lighting Price Trends
- Kenya Professional Lighting Porter's Five Forces
- Kenya Professional Lighting Industry Life Cycle
- Historical Data and Forecast of Kenya Professional Lighting Market Revenues & Volume By Light Source for the Period 2022-2032F
- Historical Data and Forecast of Kenya Professional Lighting Market Revenues & Volume By LEDs for the Period 2022-2032F
- Historical Data and Forecast of Kenya Professional Lighting Market Revenues & Volume By Others (halogen lamps, xenon bulbs, incandescent lamps) for the Period 2022-2032F
- Historical Data and Forecast of Kenya Professional Lighting Market Revenues & Volume By Applications for the Period 2022-2032F
- Historical Data and Forecast of Kenya Professional Lighting Market Revenues & Volume By Entertainment for the Period 2022-2032F
- Historical Data and Forecast of Kenya Professional Lighting Market Revenues & Volume By Stage lighting for the Period 2022-2032F
- Historical Data and Forecast of Kenya Professional Lighting Market Revenues & Volume By Medical for the Period 2022-2032F
- Historical Data and Forecast of Kenya Professional Lighting Market Revenues & Volume By UV Lamps for the Period 2022-2032F
- Historical Data and Forecast of Kenya Professional Lighting Market Revenues & Volume By Others for the Period 2022-2032F
- Kenya Professional Lighting Import Export Trade Statistics
- Market Opportunity Assessment By Light Source
- Market Opportunity Assessment By Applications
- Kenya Professional Lighting Top Companies Market Share
- Kenya Professional Lighting Competitive Benchmarking By Technical and Operational Parameters
- Kenya Professional Lighting Company Profiles
- Kenya Professional Lighting Key Strategic Recommendations
Frequently Asked Questions About the Market Study (FAQs):
6Wresearch actively monitors the Kenya Professional Lighting Market and publishes its comprehensive annual report, highlighting emerging trends, growth drivers, revenue analysis, and forecast outlook. Our insights help businesses to make data-backed strategic decisions with ongoing market dynamics. Our analysts track relevent industries related to the Kenya Professional Lighting Market, allowing our clients with actionable intelligence and reliable forecasts tailored to emerging regional needs.
Yes, we provide customisation as per your requirements. To learn more, feel free to contact us on sales@6wresearch.com
1 Executive Summary |
2 Introduction |
2.1 Key Highlights of the Report |
2.2 Report Description |
2.3 Market Scope & Segmentation |
2.4 Research Methodology |
2.5 Assumptions |
3 Kenya Professional Lighting Market Overview |
3.1 Kenya Country Macro Economic Indicators |
3.2 Kenya Professional Lighting Market Revenues & Volume, 2022 & 2032F |
3.3 Kenya Professional Lighting Market - Industry Life Cycle |
3.4 Kenya Professional Lighting Market - Porter's Five Forces |
3.5 Kenya Professional Lighting Market Revenues & Volume Share, By Light Source, 2022 & 2032F |
3.6 Kenya Professional Lighting Market Revenues & Volume Share, By Applications, 2022 & 2032F |
4 Kenya Professional Lighting Market Dynamics |
4.1 Impact Analysis |
4.2 Market Drivers |
4.3 Market Restraints |
5 Kenya Professional Lighting Market Trends |
6 Kenya Professional Lighting Market, By Types |
6.1 Kenya Professional Lighting Market, By Light Source |
6.1.1 Overview and Analysis |
6.1.2 Kenya Professional Lighting Market Revenues & Volume, By Light Source, 2022 - 2032F |
6.1.3 Kenya Professional Lighting Market Revenues & Volume, By LEDs, 2022 - 2032F |
6.1.4 Kenya Professional Lighting Market Revenues & Volume, By Others (halogen lamps, xenon bulbs, incandescent lamps) , 2022 - 2032F |
6.2 Kenya Professional Lighting Market, By Applications |
6.2.1 Overview and Analysis |
6.2.2 Kenya Professional Lighting Market Revenues & Volume, By Entertainment, 2022 - 2032F |
6.2.3 Kenya Professional Lighting Market Revenues & Volume, By Stage lighting, 2022 - 2032F |
6.2.4 Kenya Professional Lighting Market Revenues & Volume, By Medical, 2022 - 2032F |
6.2.5 Kenya Professional Lighting Market Revenues & Volume, By UV Lamps, 2022 - 2032F |
6.2.6 Kenya Professional Lighting Market Revenues & Volume, By Others, 2022 - 2032F |
7 Kenya Professional Lighting Market Import-Export Trade Statistics |
7.1 Kenya Professional Lighting Market Export to Major Countries |
7.2 Kenya Professional Lighting Market Imports from Major Countries |
8 Kenya Professional Lighting Market Key Performance Indicators |
9 Kenya Professional Lighting Market - Opportunity Assessment |
9.1 Kenya Professional Lighting Market Opportunity Assessment, By Light Source, 2022 & 2032F |
9.2 Kenya Professional Lighting Market Opportunity Assessment, By Applications, 2022 & 2032F |
10 Kenya Professional Lighting Market - Competitive Landscape |
10.1 Kenya Professional Lighting Market Revenue Share, By Companies, 2025 |
10.2 Kenya Professional Lighting Market Competitive Benchmarking, By Operating and Technical Parameters |
11 Company Profiles |
12 Recommendations |
13 Disclaimer |
Global Go To Market Strategy - 2030
Export potential enables firms to identify high-growth global markets with greater confidence by combining advanced trade intelligence with a structured quantitative methodology. The framework analyzes emerging demand trends and country-level import patterns while integrating macroeconomic and trade datasets such as GDP and population forecasts, bilateral import–export flows, tariff structures, elasticity differentials between developed and developing economies, geographic distance, and import demand projections. Using weighted trade values from 2020–2024 as the base period to project country-to-country export potential for 2030, these inputs are operationalized through calculated drivers such as gravity model parameters, tariff impact factors, and projected GDP per-capita growth. Through an analysis of hidden potentials, demand hotspots, and market conditions that are most favorable to success, this method enables firms to focus on target countries, maximize returns, and global expansion with data, backed by accuracy.
By factoring in the projected importer demand gap that is currently unmet and could be potential opportunity, it identifies the potential for the Exporter (Country) among 190 countries, against the general trade analysis, which identifies the biggest importer or exporter.
To discover high-growth global markets and optimize your business strategy:
Click Here
Pricing
- Single User License$ 1,995
- Department License$ 2,400
- Site License$ 3,120
- Global License$ 3,795

Leadership Perspectives from Industry Events
Search
Thought Leadership and Analyst Meet


Our Clients
6WResearch In News
- India Air Conditioner Market Set for Strong Rebound in 2026 After Weather-Led Correction and GST-Driven Recovery: 6Wresearch
- ADAS in India: How Automatic Emergency Braking, Blind Spot Detection & Driver Monitoring are Transforming Road Safety
- Doha a strategic location for EV manufacturing hub: IPA Qatar
- Demand for luxury TVs surging in the GCC, says Samsung
- Empowering Growth: The Thriving Journey of Bangladesh’s Cable Industry
- Demand for luxury TVs surging in the GCC, says Samsung
Latest Reports
- Poland Fire Protection Systems Market (2026-2032)
- Cape Verde Portable Hand-Thrown Extinguisher Market (2026-2032)
- Canada Portable Hand-Thrown Extinguisher Market (2026-2032)
- Cameroon Portable Hand-Thrown Extinguisher Market (2026-2032)
- Burundi Portable Hand-Thrown Extinguisher Market (2026-2032)
- Burkina Faso Portable Hand-Thrown Extinguisher Market (2026-2032)
- Bulgaria Portable Hand-Thrown Extinguisher Market (2026-2032)
- Brunei Portable Hand-Thrown Extinguisher Market (2026-2032)
- Botswana Portable Hand-Thrown Extinguisher Market (2026-2032)
- Bosnia and Herzegovina Portable Hand-Thrown Extinguisher Market (2026-2032)
Industry Events and Analyst Meet

HIMTEX 2026

India Refining Summit 2026

India EV Show 2026

EV tech India Expo 2026

Auto Tech Asia 2026
Whitepaper
- Middle East & Africa Commercial Security Market Click here to view more.
- Middle East & Africa Fire Safety Systems & Equipment Market Click here to view more.
- GCC Drone Market Click here to view more.
- Middle East Lighting Fixture Market Click here to view more.
- GCC Physical & Perimeter Security Market Click here to view more.