Kenya Solenoid Valve Market (2026-2032) Outlook | Size, Revenue, Companies, Share, Industry, Trends, Forecast, Analysis, Growth & Value
Market Forecast By Body Material (Stainless Steel, Brass, Aluminium, Plastic), By Valve Design Type (2-way, 3-way, 4-way, 5-way), By Industry (Oil & Gas, Chemical & Petrochemical, Water & Wastewater, Food & Beverages, Power Generation, Pharmaceuticals, Automotive, Others) And Competitive Landscape
| Product Code: ETC129230 | Publication Date: Jun 2021 | Updated Date: Jun 2026 | Product Type: Report | |
| Publisher: 6Wresearch | Author: Sumit Sagar | No. of Pages: 70 | No. of Figures: 35 | No. of Tables: 5 |
Kenya Solenoid Valve Market Size, Share & Growth Rate
The Kenya Solenoid Valve Market was estimated at USD 248 Million in 2025 and is projected to reach USD 329 Million by 2032, growing at a CAGR of 4.1% from 2026 to 2032. This growth is largely attributed to the accelerated pace of industrialization and the rising trend of automation across key sectors such as oil and gas, water treatment, and agriculture. Furthermore, the increasing investment in infrastructure and a push towards sustainable practices by the government are acting as catalysts for market expansion.
Kenya Solenoid Valve Market Growth Rate Analysis (2021-2032)
The Kenya solenoid valve market has shown stable growth, with an annual increase of 4.8% in both 2021 and 2022. This modest but steady expansion can be attributed to rising demand across various sectors, particularly in manufacturing and irrigation, driven by a growing population and increased industrial activities. A slight dip to 4.6% in 2023 reflects some market adjustments, potentially linked to supply chain disruptions. However, the market rebounds to 4.8% in 2025, buoyed by investments in infrastructure and energy transition initiatives. Notably, projections show a peak growth of 5.1% in 2029, underscoring the ongoing digitalization efforts and enhanced consumer demand for efficient control solutions in diverse applications.
Kenya Solenoid Valve Market Year-wise Growth Rate and Key Drivers
This graph highlights how the Kenya Solenoid Valve Market has steadily grown over the past five years, supported by major growth factors.
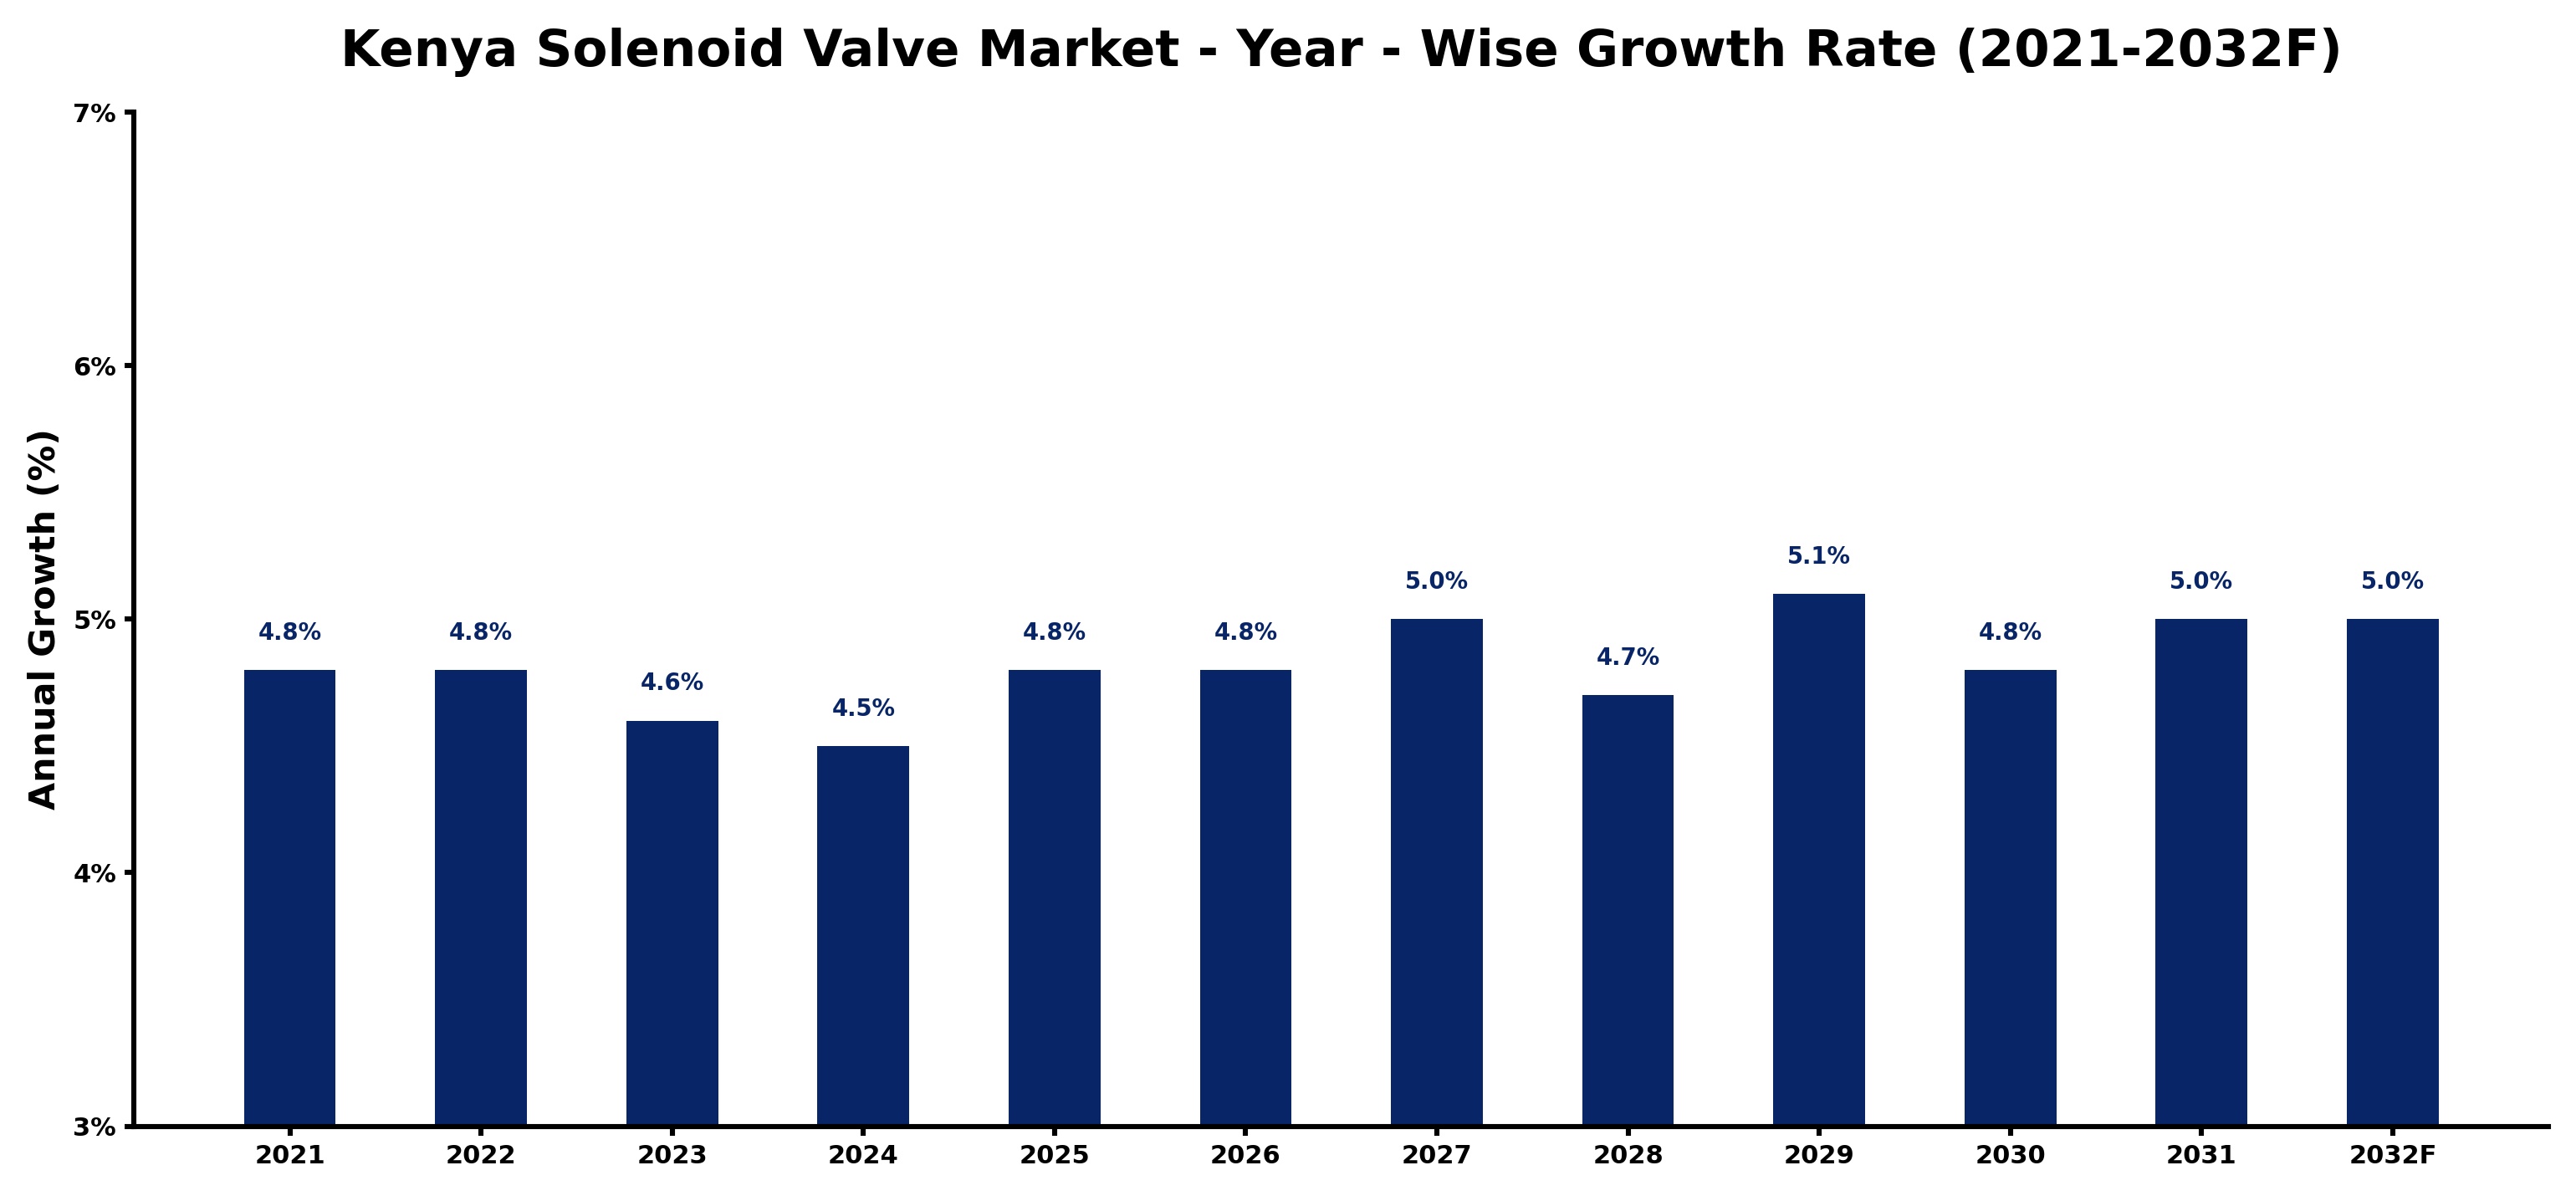
The table below presents the year‑wise growth rates along with the key drivers influencing the market
| Year | Growth Rate | Major Drivers |
| 2021 | 4.8% | Growing renewable energy integration projects |
| 2022 | 4.8% | Government infrastructure modernization initiatives |
| 2023 | 4.6% | Expansion of transportation and logistics networks |
| 2024 | 4.5% | Growing urbanization and commercial development |
| 2025 | 4.8% | Rising electricity demand across industries |
| 2026 | 4.8% | Growing renewable energy integration projects |
| 2027 | 5.0% | Expansion of manufacturing activities |
| 2028 | 4.7% | Rising electricity demand across industries |
| 2029 | 5.1% | Government infrastructure modernization initiatives |
| 2030 | 4.8% | Growing renewable energy integration projects |
| 2031 | 5.0% | Increasing adoption of advanced technologies |
| 2032 | 5.0% | Increasing industrial automation investments |
Note - Market size estimations and growth projections presented in this report are based on 6Wresearch’s advanced forecasting approach, validated with industry datasets as of June 2026.
Kenya Solenoid Valve Market Synopsis
The Kenya solenoid valve market is witnessing a dynamic transformation as industries seek more efficient fluid control solutions. With automation becoming increasingly prevalent, solenoid valves are playing a vital role in enhancing operational efficiency across multiple sectors.
In particular, the automotive and agricultural sectors are driving demand for advanced solenoid valves that promise energy efficiency and durability. The integration of IoT technologies for monitoring and control further underscores the market’s evolution, aligning with global trends toward smart manufacturing.
Kenya Solenoid Valve Market Key Takeaways
- Rapid industrialization and automation are primary drivers of solenoid valve demand in Kenya.
- Government initiatives are fostering local manufacturing and creating a competitive market landscape.
- Emerging trends, such as IoT integration, are revolutionizing the functionalities of solenoid valves.
- Investment opportunities abound as sectors like water treatment and oil & gas expand.
- Challenges related to awareness and counterfeit products necessitate enhanced customer education and regulatory measures.
Evaluation of Restraints in Kenya Solenoid Valve Market
Despite the optimistic outlook, several restraints hinder the market's full potential. A significant challenge lies in the limited understanding of solenoid valve technology among potential end-users, which leads to slower adoption rates. Compounding this issue, the prevalence of low-cost alternatives and counterfeit products threatens established brands, undermining consumer confidence in quality. Furthermore, inadequate distribution networks and after-sales support limit market reach, creating hurdles for customer satisfaction. To overcome these challenges, concerted efforts to elevate awareness, enhance distribution channels, and establish stringent quality control measures are essential.
Kenya Solenoid Valve Market Trends
Key trends shaping the Kenya solenoid valve market include an increased focus on energy-efficient products and the demand for greater integration of advanced technologies. Manufacturers are innovating to produce corrosion-resistant solenoid valves tailored for specific industrial applications, ensuring higher reliability and longevity. Additionally, the ongoing integration of IoT technology into solenoid valves is enabling remote monitoring and enhancing operational efficiencies, thus aligning with the global shift towards automation.
Kenya Solenoid Valve Market Opportunities
Investment opportunities in the Kenya solenoid valve market are becoming increasingly apparent as the industrial landscape evolves. The expanding manufacturing, water treatment, and oil & gas sectors present significant avenues for growth. Investors can take advantage of this trend by forming partnerships with local distributors or investing in manufacturers specializing in innovative solenoid valve technologies. The ongoing need for advanced and reliable solutions in automation further creates a favorable environment for future product development.
Government Initiatives in the Kenya Solenoid Valve Market
The Kenyan government has established a framework of policies aimed at bolstering the local solenoid valve manufacturing sector. With the Kenya Bureau of Standards (KEBS) implementing regulations to ensure quality and safety, domestic producers can compete effectively against imports. Moreover, incentives such as tax breaks and subsidies are available to encourage local manufacturers, fostering a self-sufficient market that prioritizes quality standards while facilitating growth.
Future Insights of the Kenya Solenoid Valve Market
Looking ahead to 2026-2032, the Kenya solenoid valve market is poised for steady growth, spurred by advancements in industrial automation and increasing adoption of smart manufacturing solutions. The ongoing focus on energy efficiency will drive further innovations in solenoid valve design and functionality. As the demand for more sophisticated fluid control systems rises, particularly in water treatment and agriculture, the market is likely to benefit from an influx of new technologies and products designed to meet evolving industry needs.
Kenya Solenoid Valve Market Latest Developments (May 2025 - June 2026)
The Kenya solenoid valve market is witnessing a surge in innovation as manufacturers respond to the growing need for advanced fluid control systems. Recent advancements include the development of energy-efficient models designed to minimize operational costs while maximizing performance. Industry players are also increasingly focusing on enhancing their distribution networks and after-sales services to address consumer concerns regarding quality and reliability.
Kenya Solenoid Valve Market - Key Attractiveness of the Report
- 10 Years of Market Numbers
- Historical Data Starting from 2022 to 2025
- Base Year: 2025
- Forecast Data until 2032
- Key Performance Indicators Impacting the Market
- Major Upcoming Developments and Projects
Key Highlights of the Report:
- Kenya Solenoid Valve Market Outlook
- Market Size of Kenya Solenoid Valve Market, 2025
- Forecast of Kenya Solenoid Valve Market, 2032
- Historical Data and Forecast of Kenya Solenoid Valve Revenues & Volume for the Period 2022-2032F
- Kenya Solenoid Valve Market Trend Evolution
- Kenya Solenoid Valve Market Drivers and Challenges
- Kenya Solenoid Valve Price Trends
- Kenya Solenoid Valve Porter's Five Forces
- Kenya Solenoid Valve Industry Life Cycle
- Historical Data and Forecast of Kenya Solenoid Valve Market Revenues & Volume By Body Material for the Period 2022-2032F
- Historical Data and Forecast of Kenya Solenoid Valve Market Revenues & Volume By Stainless Steel for the Period 2022-2032F
- Historical Data and Forecast of Kenya Solenoid Valve Market Revenues & Volume By Brass for the Period 2022-2032F
- Historical Data and Forecast of Kenya Solenoid Valve Market Revenues & Volume By Aluminium for the Period 2022-2032F
- Historical Data and Forecast of Kenya Solenoid Valve Market Revenues & Volume By Plastic for the Period 2022-2032F
- Historical Data and Forecast of Kenya Solenoid Valve Market Revenues & Volume By Valve Design Type for the Period 2022-2032F
- Historical Data and Forecast of Kenya Solenoid Valve Market Revenues & Volume By 2-way for the Period 2022-2032F
- Historical Data and Forecast of Kenya Solenoid Valve Market Revenues & Volume By 3-way for the Period 2022-2032F
- Historical Data and Forecast of Kenya Solenoid Valve Market Revenues & Volume By 4-way for the Period 2022-2032F
- Historical Data and Forecast of Kenya Solenoid Valve Market Revenues & Volume By 5-way for the Period 2022-2032F
- Historical Data and Forecast of Kenya Solenoid Valve Market Revenues & Volume By Industry for the Period 2022-2032F
- Historical Data and Forecast of Kenya Solenoid Valve Market Revenues & Volume By Oil & Gas for the Period 2022-2032F
- Historical Data and Forecast of Kenya Solenoid Valve Market Revenues & Volume By Chemical & Petrochemical for the Period 2022-2032F
- Historical Data and Forecast of Kenya Solenoid Valve Market Revenues & Volume By Water & Wastewater for the Period 2022-2032F
- Historical Data and Forecast of Kenya Solenoid Valve Market Revenues & Volume By Food & Beverages for the Period 2022-2032F
- Historical Data and Forecast of Kenya Solenoid Valve Market Revenues & Volume By Power Generation for the Period 2022-2032F
- Historical Data and Forecast of Kenya Solenoid Valve Market Revenues & Volume By Pharmaceuticals for the Period 2022-2032F
- Historical Data and Forecast of Kenya Solenoid Valve Market Revenues & Volume By Automotive for the Period 2022-2032F
- Historical Data and Forecast of Kenya Solenoid Valve Market Revenues & Volume By Others for the Period 2022-2032F
- Kenya Solenoid Valve Import Export Trade Statistics
- Market Opportunity Assessment By Body Material
- Market Opportunity Assessment By Valve Design Type
- Market Opportunity Assessment By Industry
- Kenya Solenoid Valve Top Companies Market Share
- Kenya Solenoid Valve Competitive Benchmarking By Technical and Operational Parameters
- Kenya Solenoid Valve Company Profiles
- Kenya Solenoid Valve Key Strategic Recommendations
Kenya Solenoid Valve Market - Frequently Asked Questions
Key growth drivers include increased industrialization, the rise of automation across sectors, and government initiatives aimed at improving infrastructure and promoting local manufacturing.
The Kenya Solenoid Valve Market is projected to reach USD 329 Million by 2032, with a CAGR of 4.1% from 2026 to 2032.
The government has implemented various policies, including tax incentives and quality standards established by the Kenya Bureau of Standards, to support local manufacturers and foster a competitive environment.
Trends such as the integration of IoT technology for remote monitoring and increased focus on energy efficiency are reshaping demand and functionality in the market.
The market faces challenges including limited consumer awareness of solenoid valve technology and the proliferation of low-cost alternatives and counterfeit products, which threaten established brands.
Key sectors driving demand include automotive, agriculture, water and wastewater treatment, and oil and gas, all of which are increasingly automating their processes for better efficiency.
6Wresearch actively monitors the Kenya Solenoid Valve Market and publishes its comprehensive annual report, highlighting emerging trends, growth drivers, revenue analysis, and forecast outlook. Our insights help businesses to make data-backed strategic decisions with ongoing market dynamics. Our analysts track relevent industries related to the Kenya Solenoid Valve Market, allowing our clients with actionable intelligence and reliable forecasts tailored to emerging regional needs.
Yes, we provide customisation as per your requirements. To learn more, feel free to contact us on sales@6wresearch.com
Kenya Solenoid Valve |
1 Executive Summary |
2 Introduction |
2.1 Key Highlights of the Report |
2.2 Report Description |
2.3 Market Scope & Segmentation |
2.4 Research Methodology |
2.5 Assumptions |
3 Kenya Solenoid Valve Market Overview |
3.1 Kenya Country Macro Economic Indicators |
3.2 Kenya Solenoid Valve Market Revenues & Volume, 2022 & 2032F |
3.3 Kenya Solenoid Valve Market - Industry Life Cycle |
3.4 Kenya Solenoid Valve Market - Porter's Five Forces |
3.5 Kenya Solenoid Valve Market Revenues & Volume Share, By Body Material, 2022 & 2032F |
3.6 Kenya Solenoid Valve Market Revenues & Volume Share, By Valve Design Type, 2022 & 2032F |
3.7 Kenya Solenoid Valve Market Revenues & Volume Share, By Industry, 2022 & 2032F |
4 Kenya Solenoid Valve Market Dynamics |
4.1 Impact Analysis |
4.2 Market Drivers |
4.3 Market Restraints |
5 Kenya Solenoid Valve Market Trends |
6 Kenya Solenoid Valve Market, By Types |
6.1 Kenya Solenoid Valve Market, By Body Material |
6.1.1 Overview and Analysis |
6.1.2 Kenya Solenoid Valve Market Revenues & Volume, By Body Material, 2022-2032F |
6.1.3 Kenya Solenoid Valve Market Revenues & Volume, By Stainless Steel, 2022-2032F |
6.1.4 Kenya Solenoid Valve Market Revenues & Volume, By Brass, 2022-2032F |
6.1.5 Kenya Solenoid Valve Market Revenues & Volume, By Aluminium, 2022-2032F |
6.1.6 Kenya Solenoid Valve Market Revenues & Volume, By Plastic, 2022-2032F |
6.2 Kenya Solenoid Valve Market, By Valve Design Type |
6.2.1 Overview and Analysis |
6.2.2 Kenya Solenoid Valve Market Revenues & Volume, By 2-way, 2022-2032F |
6.2.3 Kenya Solenoid Valve Market Revenues & Volume, By 3-way, 2022-2032F |
6.2.4 Kenya Solenoid Valve Market Revenues & Volume, By 4-way, 2022-2032F |
6.2.5 Kenya Solenoid Valve Market Revenues & Volume, By 5-way, 2022-2032F |
6.3 Kenya Solenoid Valve Market, By Industry |
6.3.1 Overview and Analysis |
6.3.2 Kenya Solenoid Valve Market Revenues & Volume, By Oil & Gas, 2022-2032F |
6.3.3 Kenya Solenoid Valve Market Revenues & Volume, By Chemical & Petrochemical, 2022-2032F |
6.3.4 Kenya Solenoid Valve Market Revenues & Volume, By Water & Wastewater, 2022-2032F |
6.3.5 Kenya Solenoid Valve Market Revenues & Volume, By Food & Beverages, 2022-2032F |
6.3.6 Kenya Solenoid Valve Market Revenues & Volume, By Power Generation, 2022-2032F |
6.3.7 Kenya Solenoid Valve Market Revenues & Volume, By Pharmaceuticals, 2022-2032F |
6.3.8 Kenya Solenoid Valve Market Revenues & Volume, By Others, 2022-2032F |
6.3.9 Kenya Solenoid Valve Market Revenues & Volume, By Others, 2022-2032F |
7 Kenya Solenoid Valve Market Import-Export Trade Statistics |
7.1 Kenya Solenoid Valve Market Export to Major Countries |
7.2 Kenya Solenoid Valve Market Imports from Major Countries |
8 Kenya Solenoid Valve Market Key Performance Indicators |
9 Kenya Solenoid Valve Market - Opportunity Assessment |
9.1 Kenya Solenoid Valve Market Opportunity Assessment, By Body Material, 2022 & 2032F |
9.2 Kenya Solenoid Valve Market Opportunity Assessment, By Valve Design Type, 2022 & 2032F |
9.3 Kenya Solenoid Valve Market Opportunity Assessment, By Industry, 2022 & 2032F |
10 Kenya Solenoid Valve Market - Competitive Landscape |
10.1 Kenya Solenoid Valve Market Revenue Share, By Companies, 2025 |
10.2 Kenya Solenoid Valve Market Competitive Benchmarking, By Operating and Technical Parameters |
11 Company Profiles |
12 Recommendations |
13 Disclaimer |
Global Go To Market Strategy - 2030
Export potential enables firms to identify high-growth global markets with greater confidence by combining advanced trade intelligence with a structured quantitative methodology. The framework analyzes emerging demand trends and country-level import patterns while integrating macroeconomic and trade datasets such as GDP and population forecasts, bilateral import–export flows, tariff structures, elasticity differentials between developed and developing economies, geographic distance, and import demand projections. Using weighted trade values from 2020–2024 as the base period to project country-to-country export potential for 2030, these inputs are operationalized through calculated drivers such as gravity model parameters, tariff impact factors, and projected GDP per-capita growth. Through an analysis of hidden potentials, demand hotspots, and market conditions that are most favorable to success, this method enables firms to focus on target countries, maximize returns, and global expansion with data, backed by accuracy.
By factoring in the projected importer demand gap that is currently unmet and could be potential opportunity, it identifies the potential for the Exporter (Country) among 190 countries, against the general trade analysis, which identifies the biggest importer or exporter.
To discover high-growth global markets and optimize your business strategy:
Click Here
Pricing
- Single User License$ 1,995
- Department License$ 2,400
- Site License$ 3,120
- Global License$ 3,795

Leadership Perspectives from Industry Events
Search
Thought Leadership and Analyst Meet


Our Clients
6WResearch In News
- India Air Conditioner Market Set for Strong Rebound in 2026 After Weather-Led Correction and GST-Driven Recovery: 6Wresearch
- ADAS in India: How Automatic Emergency Braking, Blind Spot Detection & Driver Monitoring are Transforming Road Safety
- Doha a strategic location for EV manufacturing hub: IPA Qatar
- Demand for luxury TVs surging in the GCC, says Samsung
- Empowering Growth: The Thriving Journey of Bangladesh’s Cable Industry
- Demand for luxury TVs surging in the GCC, says Samsung
Latest Reports
- Poland Fire Protection Systems Market (2026-2032)
- Cape Verde Portable Hand-Thrown Extinguisher Market (2026-2032)
- Canada Portable Hand-Thrown Extinguisher Market (2026-2032)
- Cameroon Portable Hand-Thrown Extinguisher Market (2026-2032)
- Burundi Portable Hand-Thrown Extinguisher Market (2026-2032)
- Burkina Faso Portable Hand-Thrown Extinguisher Market (2026-2032)
- Bulgaria Portable Hand-Thrown Extinguisher Market (2026-2032)
- Brunei Portable Hand-Thrown Extinguisher Market (2026-2032)
- Botswana Portable Hand-Thrown Extinguisher Market (2026-2032)
- Bosnia and Herzegovina Portable Hand-Thrown Extinguisher Market (2026-2032)
Industry Events and Analyst Meet

HIMTEX 2026

India Refining Summit 2026

India EV Show 2026

EV tech India Expo 2026

Auto Tech Asia 2026
Whitepaper
- Middle East & Africa Commercial Security Market Click here to view more.
- Middle East & Africa Fire Safety Systems & Equipment Market Click here to view more.
- GCC Drone Market Click here to view more.
- Middle East Lighting Fixture Market Click here to view more.
- GCC Physical & Perimeter Security Market Click here to view more.