Kenya Urea Formaldehyde Market Outlook | Value, Industry, Size, Forecast, Trends, COVID-19 IMPACT, Analysis, Revenue, Growth, Companies & Share
Market Forecast By End-users (Automobiles, Electrical Appliances, Home Appliances (Furniture), Agriculture, Others), By Applications (Adhesives, Particle board, Plywood, Roofing mats, Others) And Competitive Landscape
| Product Code: ETC093129 | Publication Date: Jun 2021 | Updated Date: Jun 2026 | Product Type: Report | |
| Publisher: 6Wresearch | Author: Ravi Bhandari | No. of Pages: 70 | No. of Figures: 35 | No. of Tables: 5 |
Kenya Urea Formaldehyde Market Size, Share & Growth Rate
The Kenya Urea Formaldehyde Market was estimated at USD 431 Million in 2025 and is projected to reach USD 571 Million by 2032, growing at a CAGR of 4.1% from 2026 to 2032. This growth trajectory is propelled by the rising demand for high-performance adhesives and resins in the woodworking and furniture manufacturing sectors. The construction boom in Kenya, along with a shift towards eco-friendly products, is further supporting market expansion as industries seek cost-effective and durable materials.
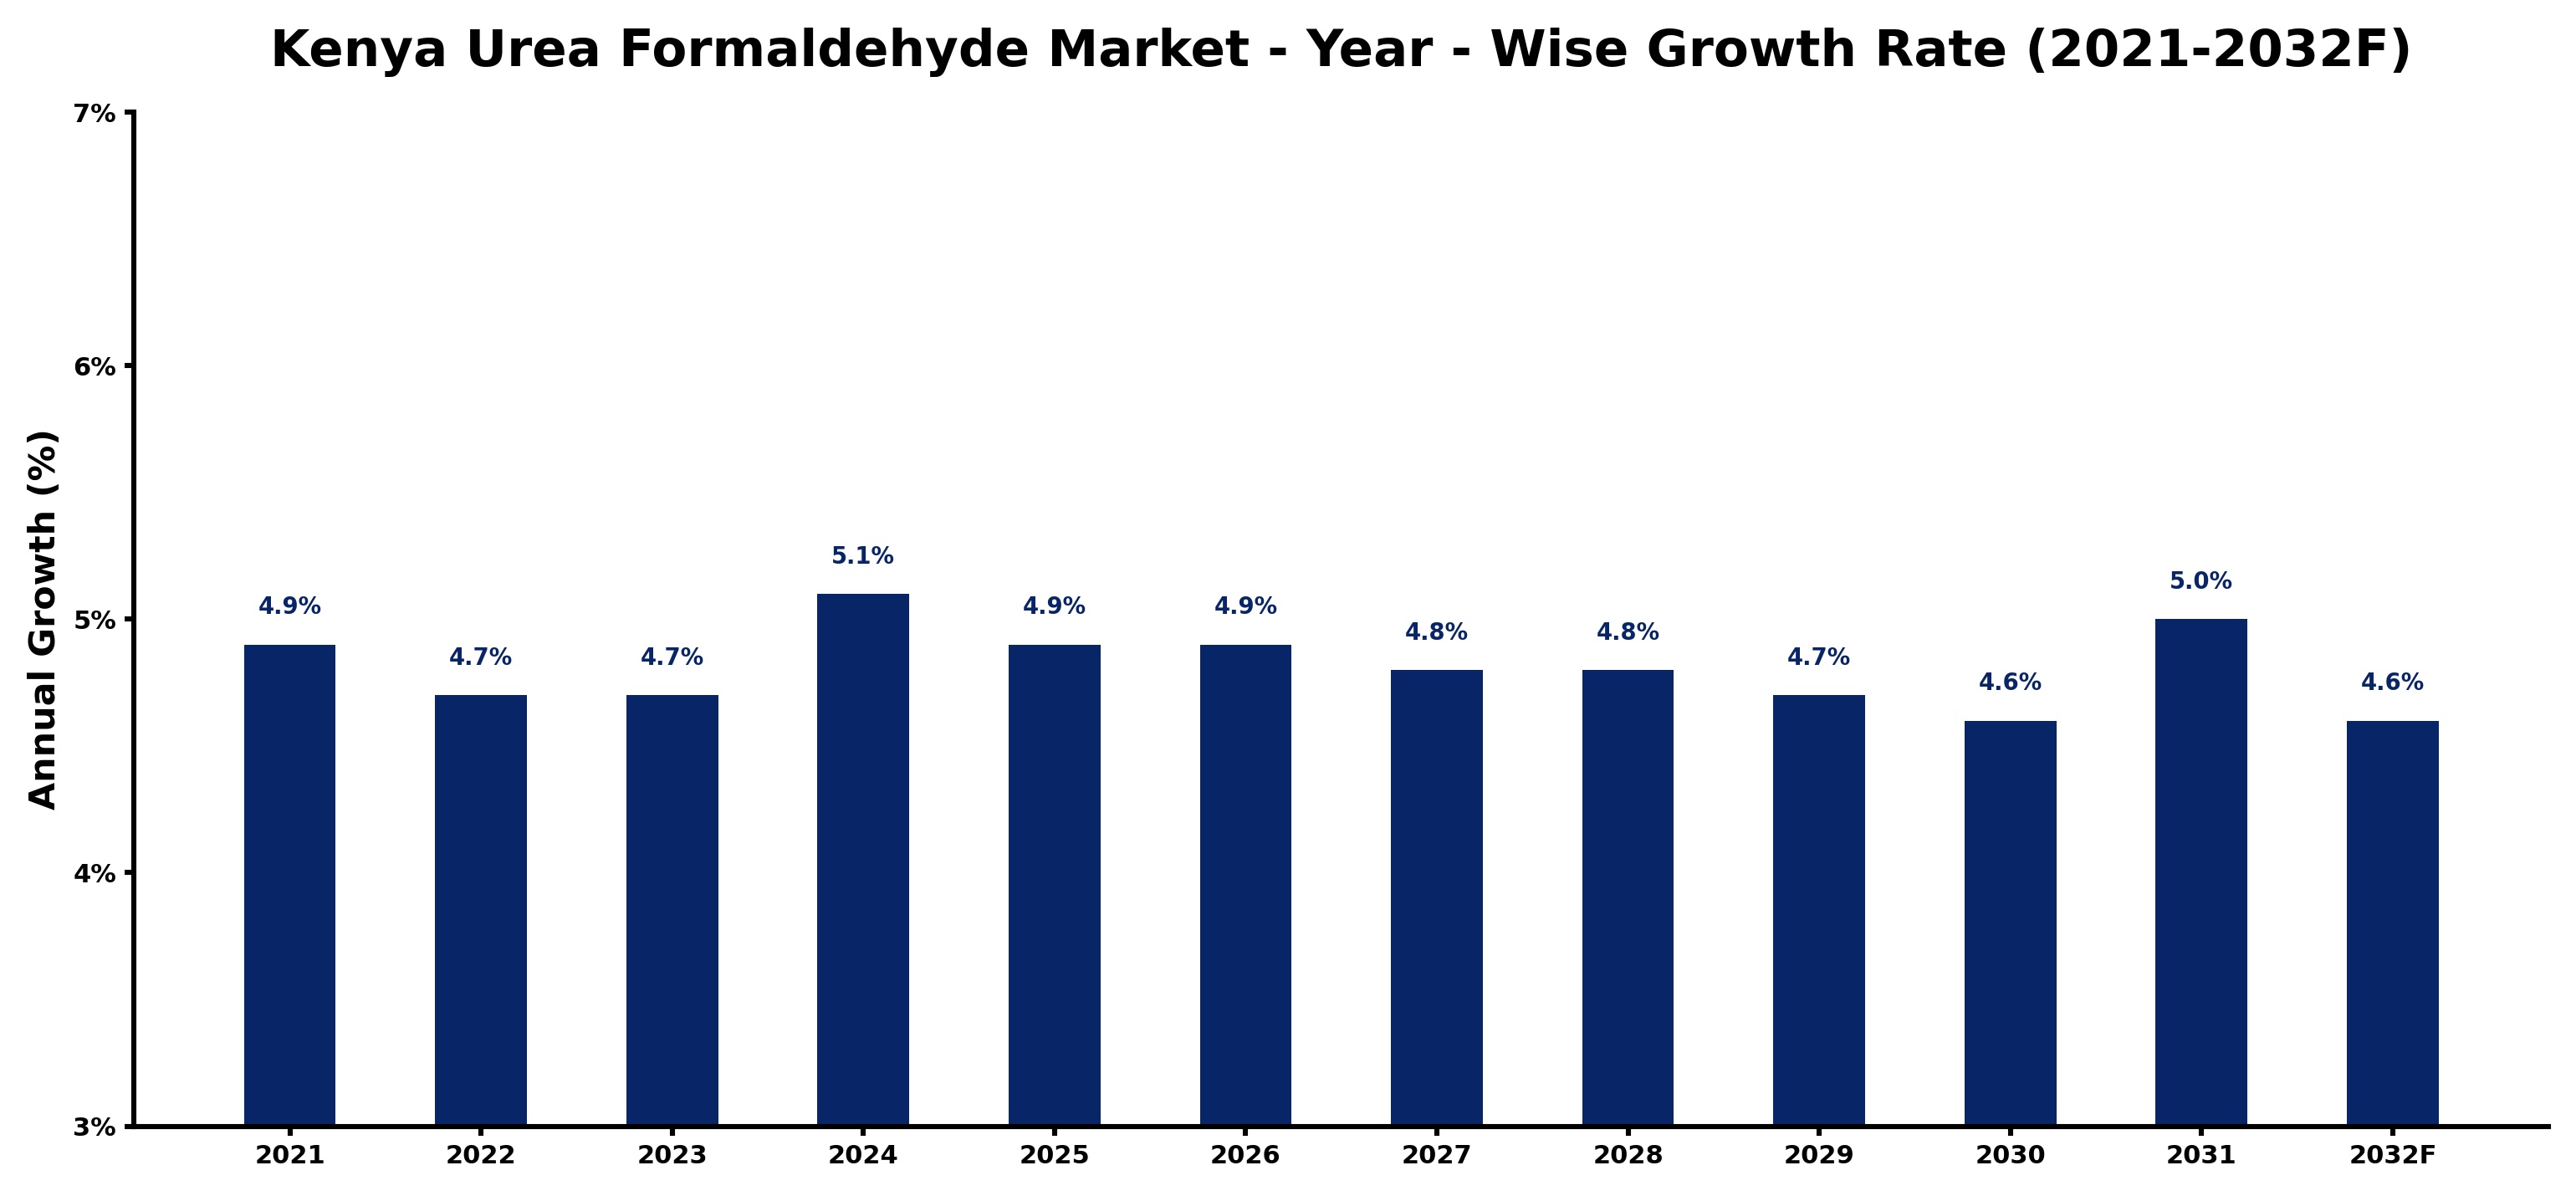
Kenya Urea Formaldehyde Market Growth Rate Analysis (2021-2032)
The Kenya Urea Formaldehyde Market has shown a stable growth pattern, with increases of 4.9% in 2021 and 4.7% in subsequent years, indicating steady demand within the construction and furniture industries as investments in infrastructure rise. The growth slightly accelerated to 5.1% in 2024, driven by heightened consumer demand and advancements in manufacturing technology. However, growth rates are projected to fluctuate slightly, with 4.8% expected in 2025 through 2028, as market saturation begins to set in. By 2031, a resurgence to 5.0% reflects renewed investment efforts in energy-efficient solutions and sustainable practices, aligning with Kenya's broader goals toward sustainable development.
Kenya Urea Formaldehyde Market Year-wise Growth Rate and Key Drivers
This graph highlights how the Kenya Urea Formaldehyde Market has steadily grown over the past five years, supported by major growth factors.
The table below presents the year‑wise growth rates along with the key drivers influencing the market
| Year | Growth Rate | Major Drivers |
| 2021 | 4.9% | Industrial modernization drives increased urea formaldehyde production capacity |
| 2022 | 4.7% | Manufacturing investments in renewable energy drive formaldehyde production capacity |
| 2023 | 4.7% | Strengthened local production facilities boosted urea formaldehyde output efficiency |
| 2024 | 5.1% | Local fertilizer plants enhanced urea formaldehyde production capabilities |
| 2025 | 4.9% | Technology integration in urea formaldehyde production boosted output efficiency |
| 2026 | 4.9% | Domestic construction projects spurred urea formaldehyde resin demand growth |
| 2027 | 4.8% | Local manufacturers boost urea formaldehyde output for construction projects |
| 2028 | 4.8% | Revitalized construction projects spurred demand for urea formaldehyde resins |
| 2029 | 4.7% | New manufacturing facilities boost urea formaldehyde production capacity in Kenya |
| 2030 | 4.6% | Technological upgrades in urea formaldehyde production boost manufacturing efficiency |
| 2031 | 5.0% | Investment in new urea formaldehyde production facilities boosts capacity |
| 2032 | 4.6% | Urea formaldehyde demand drives investments in local manufacturing capacity |
Note - Market size estimations and growth projections presented in this report are based on 6Wresearch’s advanced forecasting approach, validated with industry datasets as of June 2026.
Kenya Urea Formaldehyde Market Synopsis
The primary force driving the Kenya Urea Formaldehyde Market is the robust demand from the furniture and construction industries. Urea formaldehyde resins are favored for their excellent bonding capabilities, positioning them as a staple in composite wood production.
In addition to the industrial demand, a growing emphasis on sustainability is shaping the market landscape. Manufacturers are increasingly focused on developing low-emission urea formaldehyde resins, catering to both regulatory requirements and consumer preferences for greener alternatives.
Kenya Urea Formaldehyde Market Key Takeaways
- The market is forecasted to grow at a steady pace, driven by demand for adhesives in furniture and construction.
- Government initiatives aimed at environmental sustainability are influencing the development of low-emission resin products.
- Kenya's expanding construction industry presents significant opportunities for urea formaldehyde applications.
- Challenges related to health regulations and the need for safer alternatives may impact production costs.
- There is a burgeoning focus on composite materials, enhancing the appeal of urea formaldehyde resins in various applications.
Evaluation of Restraints in Kenya Urea Formaldehyde Market
Despite the growth potential, the Kenya Urea Formaldehyde Market is constrained by several factors. The potential toxicity of urea formaldehyde resins raises health concerns, compelling stringent regulations that manufacturers must navigate. These regulations not only increase compliance costs but also limit local innovation in safer production methods. Additionally, the market suffers from a lack of advanced manufacturing expertise, which hinders efforts to optimize production processes and innovate new products.
Kenya Urea Formaldehyde Market Trends
Currently, there is a notable trend towards the formulation of low-emission urea formaldehyde resins. This aligns with global sustainability movements, as both consumers and regulators demand products that minimize environmental impact. The increase in construction projects and the consequent need for high-quality wood products are also driving demand for robust adhesives. Furthermore, advancements in production technologies could enhance efficiency and product performance, thereby stimulating market growth.
Kenya Urea Formaldehyde Market Opportunities
There are ample opportunities for growth within the Kenya Urea Formaldehyde Market, particularly as new construction initiatives and urbanization projects continue to rise. The furniture industry, poised for expansion, offers a fertile ground for urea formaldehyde resins due to their cost-effectiveness and superior bonding characteristics. Moreover, manufacturers who invest in research and development for sustainable product alternatives stand to gain a competitive edge in a market that increasingly prioritizes environmental responsibility.
Government Initiatives in the Kenya Urea Formaldehyde Market
Government policies in Kenya significantly impact the Urea Formaldehyde Market. Regulatory bodies like the Ministry of Industrialization and the National Environment Management Authority (NEMA) enforce environmental regulations that are shaping the manufacturing processes. Initiatives aimed at enhancing agricultural productivity also have a beneficial ripple effect, as urea formaldehyde is utilized in agricultural fertilizers and as an adhesive in various wood-based products.
Future Insights of the Kenya Urea Formaldehyde Market
Looking forward to the 2026-2032 period, the Kenya Urea Formaldehyde Market is expected to navigate a path shaped by regulatory pressures and consumer demands for sustainability. The projected CAGR of 4.1% underscores a resilient market, bolstered by ongoing investments in the construction and furniture sectors. As local manufacturers adapt to these dynamics and innovate towards safer, low-emission products, the market's future appears promising.
Kenya Urea Formaldehyde Market Latest Developments (May 2025 - June 2026)
The industry has seen a shift towards sustainable practices, with several companies exploring eco-friendly formulations of urea formaldehyde. Research initiatives aimed at reducing emissions from traditional resins are gaining traction. Furthermore, collaboration between governmental bodies and private sector players is increasingly focusing on compliance with environmental standards, ensuring the safe manufacturing of urea formaldehyde products.
Kenya Urea Formaldehyde Market - Key Attractiveness of the Report
- 10 Years of Market Numbers
- Historical Data Starting from 2022 to 2025
- Base Year: 2025
- Forecast Data until 2032
- Key Performance Indicators Impacting the Market
- Major Upcoming Developments and Projects
Key Highlights of the Report:
- Kenya Urea Formaldehyde Market Outlook
- Market Size of Kenya Urea Formaldehyde Market, 2025
- Forecast of Kenya Urea Formaldehyde Market, 2032F
- Historical Data and Forecast of Kenya Urea Formaldehyde Revenues & Volume for the Period 2022-2032F
- Kenya Urea Formaldehyde Market Trend Evolution
- Kenya Urea Formaldehyde Market Drivers and Challenges
- Kenya Urea Formaldehyde Price Trends
- Kenya Urea Formaldehyde Porter's Five Forces
- Kenya Urea Formaldehyde Industry Life Cycle
- Historical Data and Forecast of Kenya Urea Formaldehyde Market Revenues & Volume By End-users for the Period 2022-2032F
- Historical Data and Forecast of Kenya Urea Formaldehyde Market Revenues & Volume By Automobiles for the Period 2022-2032F
- Historical Data and Forecast of Kenya Urea Formaldehyde Market Revenues & Volume By Electrical Appliances for the Period 2022-2032F
- Historical Data and Forecast of Kenya Urea Formaldehyde Market Revenues & Volume By Home Appliances (Furniture) for the Period 2022-2032F
- Historical Data and Forecast of Kenya Urea Formaldehyde Market Revenues & Volume By Agriculture for the Period 2022-2032F
- Historical Data and Forecast of Kenya Urea Formaldehyde Market Revenues & Volume By Others for the Period 2022-2032F
- Historical Data and Forecast of Kenya Urea Formaldehyde Market Revenues & Volume By Applications for the Period 2022-2032F
- Historical Data and Forecast of Kenya Urea Formaldehyde Market Revenues & Volume By Adhesives for the Period 2022-2032F
- Historical Data and Forecast of Kenya Urea Formaldehyde Market Revenues & Volume By Particle board for the Period 2022-2032F
- Historical Data and Forecast of Kenya Urea Formaldehyde Market Revenues & Volume By Plywood for the Period 2022-2032F
- Historical Data and Forecast of Kenya Urea Formaldehyde Market Revenues & Volume By Roofing mats for the Period 2022-2032F
- Historical Data and Forecast of Kenya Urea Formaldehyde Market Revenues & Volume By Others for the Period 2022-2032F
- Kenya Urea Formaldehyde Import Export Trade Statistics
- Market Opportunity Assessment By End-users
- Market Opportunity Assessment By Applications
- Kenya Urea Formaldehyde Top Companies Market Share
- Kenya Urea Formaldehyde Competitive Benchmarking By Technical and Operational Parameters
- Kenya Urea Formaldehyde Company Profiles
- Kenya Urea Formaldehyde Key Strategic Recommendations
Kenya Urea Formaldehyde Market - Frequently Asked Questions
The market is projected to grow at a CAGR of 4.1% from 2026 to 2032, reflecting increasing demand in construction and furniture industries.
The booming construction sector significantly increases demand for composite wood products, where urea formaldehyde resins are commonly used as adhesives.
Yes, stringent environmental regulations imposed by NEMA and the Ministry of Industrialization shape manufacturing practices and emissions in the urea formaldehyde sector.
Urea formaldehyde is primarily used in adhesives for composite wood products and furniture, as well as in agriculture for fertilizer applications.
The industry is likely to see developments in low-emission resins and other sustainable alternatives, driven by both regulatory pressures and consumer demand for eco-friendly products.
6Wresearch actively monitors the Kenya Urea Formaldehyde Market and publishes its comprehensive annual report, highlighting emerging trends, growth drivers, revenue analysis, and forecast outlook. Our insights help businesses to make data-backed strategic decisions with ongoing market dynamics. Our analysts track relevent industries related to the Kenya Urea Formaldehyde Market, allowing our clients with actionable intelligence and reliable forecasts tailored to emerging regional needs.
Yes, we provide customisation as per your requirements. To learn more, feel free to contact us on sales@6wresearch.com
1 Executive Summary |
2 Introduction |
2.1 Key Highlights of the Report |
2.2 Report Description |
2.3 Market Scope & Segmentation |
2.4 Research Methodology |
2.5 Assumptions |
3 Kenya Urea Formaldehyde Market Overview |
3.1 Kenya Country Macro Economic Indicators |
3.2 Kenya Urea Formaldehyde Market Revenues & Volume, 2022 & 2032F |
3.3 Kenya Urea Formaldehyde Market - Industry Life Cycle |
3.4 Kenya Urea Formaldehyde Market - Porter's Five Forces |
3.5 Kenya Urea Formaldehyde Market Revenues & Volume Share, By End-users, 2022 & 2032F |
3.6 Kenya Urea Formaldehyde Market Revenues & Volume Share, By Applications, 2022 & 2032F |
4 Kenya Urea Formaldehyde Market Dynamics |
4.1 Impact Analysis |
4.2 Market Drivers |
4.3 Market Restraints |
5 Kenya Urea Formaldehyde Market Trends |
6 Kenya Urea Formaldehyde Market, By Types |
6.1 Kenya Urea Formaldehyde Market, By End-users |
6.1.1 Overview and Analysis |
6.1.2 Kenya Urea Formaldehyde Market Revenues & Volume, By End-users, 2022-2032F |
6.1.3 Kenya Urea Formaldehyde Market Revenues & Volume, By Automobiles, 2022-2032F |
6.1.4 Kenya Urea Formaldehyde Market Revenues & Volume, By Electrical Appliances, 2022-2032F |
6.1.5 Kenya Urea Formaldehyde Market Revenues & Volume, By Home Appliances (Furniture), 2022-2032F |
6.1.6 Kenya Urea Formaldehyde Market Revenues & Volume, By Agriculture, 2022-2032F |
6.1.7 Kenya Urea Formaldehyde Market Revenues & Volume, By Others, 2022-2032F |
6.2 Kenya Urea Formaldehyde Market, By Applications |
6.2.1 Overview and Analysis |
6.2.2 Kenya Urea Formaldehyde Market Revenues & Volume, By Adhesives, 2022-2032F |
6.2.3 Kenya Urea Formaldehyde Market Revenues & Volume, By Particle board, 2022-2032F |
6.2.4 Kenya Urea Formaldehyde Market Revenues & Volume, By Plywood, 2022-2032F |
6.2.5 Kenya Urea Formaldehyde Market Revenues & Volume, By Roofing mats, 2022-2032F |
6.2.6 Kenya Urea Formaldehyde Market Revenues & Volume, By Others, 2022-2032F |
7 Kenya Urea Formaldehyde Market Import-Export Trade Statistics |
7.1 Kenya Urea Formaldehyde Market Export to Major Countries |
7.2 Kenya Urea Formaldehyde Market Imports from Major Countries |
8 Kenya Urea Formaldehyde Market Key Performance Indicators |
9 Kenya Urea Formaldehyde Market - Opportunity Assessment |
9.1 Kenya Urea Formaldehyde Market Opportunity Assessment, By End-users, 2022 & 2032F |
9.2 Kenya Urea Formaldehyde Market Opportunity Assessment, By Applications, 2022 & 2032F |
10 Kenya Urea Formaldehyde Market - Competitive Landscape |
10.1 Kenya Urea Formaldehyde Market Revenue Share, By Companies, 2025 |
10.2 Kenya Urea Formaldehyde Market Competitive Benchmarking, By Operating and Technical Parameters |
11 Company Profiles |
12 Recommendations |
13 Disclaimer |
Global Go To Market Strategy - 2030
Export potential enables firms to identify high-growth global markets with greater confidence by combining advanced trade intelligence with a structured quantitative methodology. The framework analyzes emerging demand trends and country-level import patterns while integrating macroeconomic and trade datasets such as GDP and population forecasts, bilateral import–export flows, tariff structures, elasticity differentials between developed and developing economies, geographic distance, and import demand projections. Using weighted trade values from 2020–2024 as the base period to project country-to-country export potential for 2030, these inputs are operationalized through calculated drivers such as gravity model parameters, tariff impact factors, and projected GDP per-capita growth. Through an analysis of hidden potentials, demand hotspots, and market conditions that are most favorable to success, this method enables firms to focus on target countries, maximize returns, and global expansion with data, backed by accuracy.
By factoring in the projected importer demand gap that is currently unmet and could be potential opportunity, it identifies the potential for the Exporter (Country) among 190 countries, against the general trade analysis, which identifies the biggest importer or exporter.
To discover high-growth global markets and optimize your business strategy:
Click Here
Pricing
- Single User License$ 1,995
- Department License$ 2,400
- Site License$ 3,120
- Global License$ 3,795

Leadership Perspectives from Industry Events
Search
Thought Leadership and Analyst Meet


Our Clients
6WResearch In News
- India Air Conditioner Market Set for Strong Rebound in 2026 After Weather-Led Correction and GST-Driven Recovery: 6Wresearch
- ADAS in India: How Automatic Emergency Braking, Blind Spot Detection & Driver Monitoring are Transforming Road Safety
- Doha a strategic location for EV manufacturing hub: IPA Qatar
- Demand for luxury TVs surging in the GCC, says Samsung
- Empowering Growth: The Thriving Journey of Bangladesh’s Cable Industry
- Demand for luxury TVs surging in the GCC, says Samsung
Latest Reports
- Poland Fire Protection Systems Market (2026-2032)
- Cape Verde Portable Hand-Thrown Extinguisher Market (2026-2032)
- Canada Portable Hand-Thrown Extinguisher Market (2026-2032)
- Cameroon Portable Hand-Thrown Extinguisher Market (2026-2032)
- Burundi Portable Hand-Thrown Extinguisher Market (2026-2032)
- Burkina Faso Portable Hand-Thrown Extinguisher Market (2026-2032)
- Bulgaria Portable Hand-Thrown Extinguisher Market (2026-2032)
- Brunei Portable Hand-Thrown Extinguisher Market (2026-2032)
- Botswana Portable Hand-Thrown Extinguisher Market (2026-2032)
- Bosnia and Herzegovina Portable Hand-Thrown Extinguisher Market (2026-2032)
Industry Events and Analyst Meet

HIMTEX 2026

India Refining Summit 2026

India EV Show 2026

EV tech India Expo 2026

Auto Tech Asia 2026
Whitepaper
- Middle East & Africa Commercial Security Market Click here to view more.
- Middle East & Africa Fire Safety Systems & Equipment Market Click here to view more.
- GCC Drone Market Click here to view more.
- Middle East Lighting Fixture Market Click here to view more.
- GCC Physical & Perimeter Security Market Click here to view more.