Kenya Zinc Market (2026-2032) | Analysis, Industry, Value, Outlook, Size, Trends, COVID-19 IMPACT, Growth, Forecast, Revenue, Share & Companies
Market Forecast By Applications (Galvanizing, Die casting, Brass and bronze, Others), By End-users (Construction, Transportation, Consumer goods, Others) And Competitive Landscape
| Product Code: ETC007870 | Publication Date: Sep 2020 | Updated Date: Jun 2026 | Product Type: Report | |
| Publisher: 6Wresearch | Author: Ravi Bhandari | No. of Pages: 70 | No. of Figures: 35 | No. of Tables: 5 |
Kenya Zinc Market Summary
The kenya zinc market was estimated at USD 1219 Million in 2025 and is projected to reach USD 1735 Million by 2032, growing at a CAGR of 6.3% from 2026 to 2032.
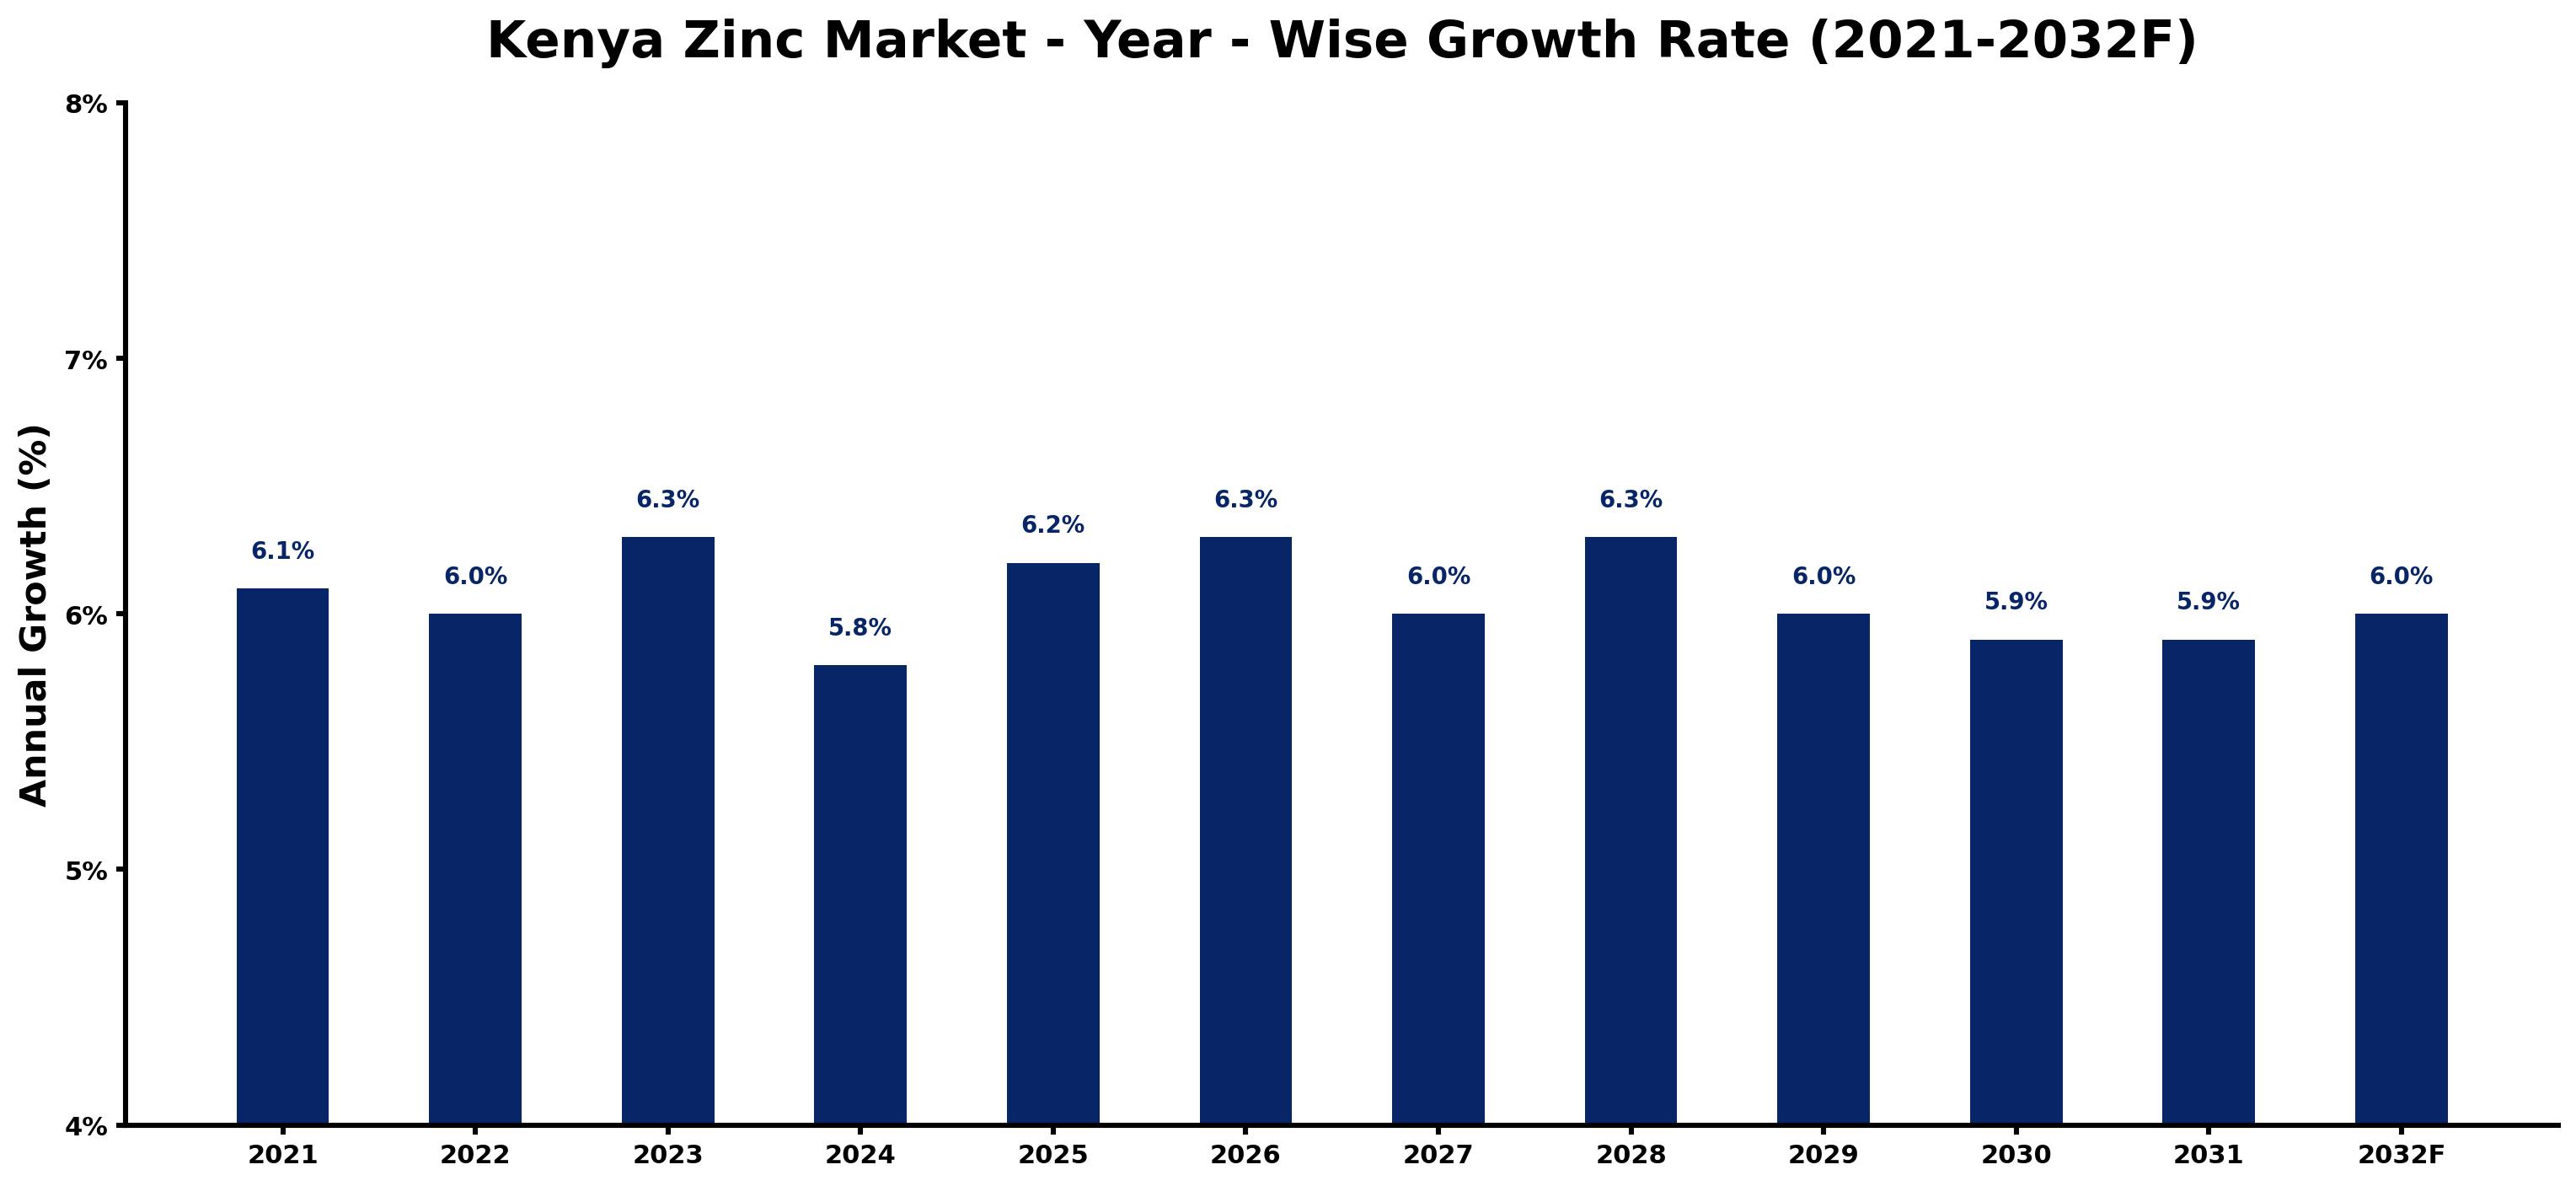
Kenya Zinc Market Growth Rate Analysis (2021-2032)
The Kenya zinc market has demonstrated stable growth, reflecting a yearly uptick of 6.1% in 2021 and further maintaining momentum with a growth rate of 6.0% in 2022. This trend continues with 6.3% in 2023, driven largely by increasing demand in sectors such as construction and automotive. However, projected growth slightly dips to 5.8% in 2024, likely influenced by fluctuating raw material prices and supply chain disruptions. The market rebounds in subsequent years, with 6.2% in 2025 and 6.3% in 2026, as investments in mining infrastructure and energy transition initiatives bolster production. Factors like digitalization further enhance operational efficiencies, underpinning a robust outlook through 2032.
Kenya Zinc Market Year-wise Growth Rate and Key Drivers
This graph highlights how the Kenya Zinc Market has steadily grown over the past five years, supported by major growth factors.
The table below presents the year wise growth rates along with the key drivers influencing the market
| Year | Growth Rate | Major Drivers |
| 2021 | 6.1% | Economic recovery post-COVID spurred construction activity across urban centers in Kenya. |
| 2022 | 6.0% | Local manufacturing initiatives began addressing zinc product shortages in the construction sector. |
| 2023 | 6.3% | Infrastructure projects gained momentum, with increased funding from private and public sectors. |
| 2024 | 5.8% | Zinc's critical role in galvanization enhanced its application in Kenyan agriculture machinery. |
| 2025 | 6.2% | Investment in renewable energy systems generated new demand for zinc in battery storage. |
| 2026 | 6.3% | Emerging technologies in mining started improving zinc extraction efficiency and sustainability. |
| 2027 | 6.0% | Emerging housing demands led to a surge in zinc use for roofing materials. |
| 2028 | 6.3% | Climate resilience frameworks began emphasizing zinc as a metal for durable construction. |
| 2029 | 6.0% | Regional trade agreements facilitated easier access to zinc imports and competitive pricing. |
| 2030 | 5.9% | Rising urbanization trends in Nairobi increased the need for durable construction materials. |
| 2031 | 5.9% | Supply chain innovations reduced zinc production costs, stimulating market dynamics further. |
| 2032 | 6.0% | Collaborative ventures between local firms and international suppliers bolstered zinc market stability. |
Note - Market size estimations and growth projections presented in this report are based on 6Wresearch's advanced forecasting approach, validated with industry datasets as of June 2026.
Kenya Zinc Market Synopsis
The Kenya Zinc Market is projected to reach 6.3% and witness significant growth during the forecast period (2026-2032). The demand for zinc in Kenya is experiencing an upward trend, primarily driven by the metal's essential applications in various sectors, including construction, automotive, and electronics. This report explores the multifaceted dynamics of the Kenya zinc market, focusing on growth drivers, challenges, governmental policies, and recent developments that shape its future trajectory.
Kenya Zinc Market Growth Drivers
The expansion of the Kenya zinc market is significantly influenced by several key growth drivers:
- The ongoing industrialization in Kenya enhances the demand for zinc, particularly in infrastructure projects, where zinc is vital for galvanizing steel and iron to ensure durability and corrosion resistance.
- The automotive sector's increasing reliance on zinc in manufacturing processes, such as die-casting alloys and battery production, contributes to market growth.
- The rising population and urban migration are spurring construction activities, necessitating the use of zinc for various applications, including roofing sheets and structural components.
- Government initiatives aimed at promoting infrastructural development are fostering a conducive environment for zinc utilization across various industries.
- As global trends shift toward sustainable and durable materials, the demand for zinc alloys and chemicals in industries such as electronics is expected to rise, further bolstering the market.
Kenya Zinc Market Challenges and Restraints
Despite the positive outlook for the Kenya zinc market, several challenges hinder its growth:
- Fluctuations in global zinc prices can create uncertainty for local producers and consumers, impacting profitability and investment decisions.
- The limited local production capacity of zinc often results in reliance on imports, which can be disrupted by external factors such as trade policies and geopolitical tensions.
- Infrastructure limitations, including inadequate transportation and logistical challenges, impede the efficient distribution of zinc products within the country.
- Regulatory hurdles, including stringent environmental regulations and complex permitting processes, can delay projects and increase operational costs for zinc companies.
- The need for technological advancements in mining and processing is critical, as outdated practices could hinder productivity and competitiveness in the global market.
Kenya Zinc Market Government Investment and Initiatives
Kenya's government has instituted a variety of policies and initiatives to nurture the growth of the zinc market:
- Strategic partnerships with mining companies focus on promoting sustainable mining practices and responsible extraction of zinc ore, ensuring environmental protection while meeting industry needs.
- Government incentives, including tax breaks and subsidies for zinc mining and processing operations, are designed to attract both local and foreign investment into the sector.
- Public spending on infrastructure development projects is aimed at enhancing transportation networks, which is crucial for the efficient distribution of zinc products across various regions.
- The establishment of regulatory bodies ensures adherence to quality and environmental standards in the mining and processing of zinc, which is vital for maintaining market integrity.
- By supporting research and development in zinc applications, the government aims to enhance the competitiveness of local industries in the global market.
Kenya Zinc Market Latest Developments (May 2025 - June 2026)
In the recent period from May 2025 to June 2026, the Kenya zinc market has experienced significant shifts that may impact its future direction:
- Increased collaboration between the government and industry stakeholders has been noted, aiming to boost local production capacity and reduce reliance on imports.
- New infrastructure initiatives have been launched, focusing on enhancing road and rail networks, which are essential for the transportation of zinc products and raw materials.
- Advancements in mining technologies are being implemented to improve efficiency and sustainability in zinc extraction and processing, addressing previous challenges associated with local production.
- The demand for zinc in the electronics sector is rising, spurred by innovations in technology and the increasing need for corrosion-resistant materials.
- Ongoing dialogues concerning regulatory frameworks aim to simplify procedures related to zinc production and trade, potentially catalyzing market growth.
Kenya Zinc Market - Key Attractiveness of the Report
- 10 Years of Market Numbers
- Historical Data Starting from 2022 to 2025
- Base Year: 2025
- Forecast Data until 2032
- Key Performance Indicators Impacting the Market
- Major Upcoming Developments and Projects
Key Highlights of the Report:
- Kenya Zinc Market Outlook
- Market Size of Kenya Zinc Market, 2025
- Forecast of Kenya Zinc Market, 2032F
- Historical Data and Forecast of Kenya Zinc Revenues & Volume for the Period 2022-2032F
- Kenya Zinc Market Trend Evolution
- Kenya Zinc Market Drivers and Challenges
- Kenya Zinc Price Trends
- Kenya Zinc Porter's Five Forces
- Kenya Zinc Industry Life Cycle
- Historical Data and Forecast of Kenya Zinc Market Revenues & Volume By Applications for the Period 2022-2032F
- Historical Data and Forecast of Kenya Zinc Market Revenues & Volume By Galvanizing? for the Period 2022-2032F
- Historical Data and Forecast of Kenya Zinc Market Revenues & Volume By Die casting for the Period 2022-2032F
- Historical Data and Forecast of Kenya Zinc Market Revenues & Volume By Brass and bronze for the Period 2022-2032F
- Historical Data and Forecast of Kenya Zinc Market Revenues & Volume By Others? for the Period 2022-2032F
- Historical Data and Forecast of Kenya Zinc Market Revenues & Volume By End-users for the Period 2022-2032F
- Historical Data and Forecast of Kenya Zinc Market Revenues & Volume By Construction? for the Period 2022-2032F
- Historical Data and Forecast of Kenya Zinc Market Revenues & Volume By Transportation? for the Period 2022-2032F
- Historical Data and Forecast of Kenya Zinc Market Revenues & Volume By Consumer goods for the Period 2022-2032F
- Historical Data and Forecast of Kenya Zinc Market Revenues & Volume By Others? for the Period 2022-2032F
- Kenya Zinc Import Export Trade Statistics
- Market Opportunity Assessment By Applications
- Market Opportunity Assessment By End-users
- Kenya Zinc Top Companies Market Share
- Kenya Zinc Competitive Benchmarking By Technical and Operational Parameters
- Kenya Zinc Company Profiles
- Kenya Zinc Key Strategic Recommendations
Frequently Asked Questions About the Market Study (FAQs):
A1: Zinc is primarily used in galvanizing steel and iron, die-casting alloys, and battery manufacturing, with applications spanning the construction, automotive, and electronics sectors.
A2: The market faces challenges such as fluctuating global prices, limited local production capacity, regulatory hurdles, and infrastructure limitations that impact supply chains.
A3: The government is promoting industrial applications through incentives, partnerships with mining companies, and investment in infrastructure projects aimed at enhancing the efficiency of zinc supply.
A4: The Kenya zinc market is expected to grow significantly due to industrialization, infrastructural development, and increased demand for sustainable materials across various sectors.
6Wresearch actively monitors the Kenya Zinc Market and publishes its comprehensive annual report, highlighting emerging trends, growth drivers, revenue analysis, and forecast outlook. Our insights help businesses to make data-backed strategic decisions with ongoing market dynamics. Our analysts track relevent industries related to the Kenya Zinc Market, allowing our clients with actionable intelligence and reliable forecasts tailored to emerging regional needs.
Yes, we provide customisation as per your requirements. To learn more, feel free to contact us on sales@6wresearch.com
1 Executive Summary |
2 Introduction |
2.1 Key Highlights of the Report |
2.2 Report Description |
2.3 Market Scope & Segmentation |
2.4 Research Methodology |
2.5 Assumptions |
3 Kenya Zinc Market Overview |
3.1 Kenya Country Macro Economic Indicators |
3.2 Kenya Zinc Market Revenues & Volume, 2022 & 2032F |
3.3 Kenya Zinc Market - Industry Life Cycle |
3.4 Kenya Zinc Market - Porter's Five Forces |
3.5 Kenya Zinc Market Revenues & Volume Share, By Applications, 2022 & 2032F |
3.6 Kenya Zinc Market Revenues & Volume Share, By End-users, 2022 & 2032F |
4 Kenya Zinc Market Dynamics |
4.1 Impact Analysis |
4.2 Market Drivers |
4.3 Market Restraints |
5 Kenya Zinc Market Trends |
6 Kenya Zinc Market, By Types |
6.1 Kenya Zinc Market, By Applications |
6.1.1 Overview and Analysis |
6.1.2 Kenya Zinc Market Revenues & Volume, By Applications, 2022-2032F |
6.1.3 Kenya Zinc Market Revenues & Volume, By Galvanizing , 2022-2032F |
6.1.4 Kenya Zinc Market Revenues & Volume, By Die casting, 2022-2032F |
6.1.5 Kenya Zinc Market Revenues & Volume, By Brass and bronze, 2022-2032F |
6.1.6 Kenya Zinc Market Revenues & Volume, By Others , 2022-2032F |
6.2 Kenya Zinc Market, By End-users |
6.2.1 Overview and Analysis |
6.2.2 Kenya Zinc Market Revenues & Volume, By Construction , 2022-2032F |
6.2.3 Kenya Zinc Market Revenues & Volume, By Transportation , 2022-2032F |
6.2.4 Kenya Zinc Market Revenues & Volume, By Consumer goods, 2022-2032F |
6.2.5 Kenya Zinc Market Revenues & Volume, By Others , 2022-2032F |
7 Kenya Zinc Market Import-Export Trade Statistics |
7.1 Kenya Zinc Market Export to Major Countries |
7.2 Kenya Zinc Market Imports from Major Countries |
8 Kenya Zinc Market Key Performance Indicators |
9 Kenya Zinc Market - Opportunity Assessment |
9.1 Kenya Zinc Market Opportunity Assessment, By Applications, 2022 & 2032F |
9.2 Kenya Zinc Market Opportunity Assessment, By End-users, 2022 & 2032F |
10 Kenya Zinc Market - Competitive Landscape |
10.1 Kenya Zinc Market Revenue Share, By Companies, 2025 |
10.2 Kenya Zinc Market Competitive Benchmarking, By Operating and Technical Parameters |
11 Company Profiles |
12 Recommendations |
13 Disclaimer |
Global Go To Market Strategy - 2030
Export potential enables firms to identify high-growth global markets with greater confidence by combining advanced trade intelligence with a structured quantitative methodology. The framework analyzes emerging demand trends and country-level import patterns while integrating macroeconomic and trade datasets such as GDP and population forecasts, bilateral import–export flows, tariff structures, elasticity differentials between developed and developing economies, geographic distance, and import demand projections. Using weighted trade values from 2020–2024 as the base period to project country-to-country export potential for 2030, these inputs are operationalized through calculated drivers such as gravity model parameters, tariff impact factors, and projected GDP per-capita growth. Through an analysis of hidden potentials, demand hotspots, and market conditions that are most favorable to success, this method enables firms to focus on target countries, maximize returns, and global expansion with data, backed by accuracy.
By factoring in the projected importer demand gap that is currently unmet and could be potential opportunity, it identifies the potential for the Exporter (Country) among 190 countries, against the general trade analysis, which identifies the biggest importer or exporter.
To discover high-growth global markets and optimize your business strategy:
Click Here
Pricing
- Single User License$ 1,995
- Department License$ 2,400
- Site License$ 3,120
- Global License$ 3,795

Leadership Perspectives from Industry Events
Search
Thought Leadership and Analyst Meet


Our Clients
6WResearch In News
- India Air Conditioner Market Set for Strong Rebound in 2026 After Weather-Led Correction and GST-Driven Recovery: 6Wresearch
- ADAS in India: How Automatic Emergency Braking, Blind Spot Detection & Driver Monitoring are Transforming Road Safety
- Doha a strategic location for EV manufacturing hub: IPA Qatar
- Demand for luxury TVs surging in the GCC, says Samsung
- Empowering Growth: The Thriving Journey of Bangladesh’s Cable Industry
- Demand for luxury TVs surging in the GCC, says Samsung
Latest Reports
- Poland Fire Protection Systems Market (2026-2032)
- Cape Verde Portable Hand-Thrown Extinguisher Market (2026-2032)
- Canada Portable Hand-Thrown Extinguisher Market (2026-2032)
- Cameroon Portable Hand-Thrown Extinguisher Market (2026-2032)
- Burundi Portable Hand-Thrown Extinguisher Market (2026-2032)
- Burkina Faso Portable Hand-Thrown Extinguisher Market (2026-2032)
- Bulgaria Portable Hand-Thrown Extinguisher Market (2026-2032)
- Brunei Portable Hand-Thrown Extinguisher Market (2026-2032)
- Botswana Portable Hand-Thrown Extinguisher Market (2026-2032)
- Bosnia and Herzegovina Portable Hand-Thrown Extinguisher Market (2026-2032)
Industry Events and Analyst Meet

HIMTEX 2026

India Refining Summit 2026

India EV Show 2026

EV tech India Expo 2026

Auto Tech Asia 2026
Whitepaper
- Middle East & Africa Commercial Security Market Click here to view more.
- Middle East & Africa Fire Safety Systems & Equipment Market Click here to view more.
- GCC Drone Market Click here to view more.
- Middle East Lighting Fixture Market Click here to view more.
- GCC Physical & Perimeter Security Market Click here to view more.