Kuwait Bottled Water Market (2020-2026) | Size, Growth, Value, Share, Companies, Analysis, Forecast, COVID-19 IMPACT, Trends, Revenue, Outlook & Industry
Market Forecast By Quality (Premium, Non-Premium), By Type (Still Water, Spring Water, SparklingWater, Purified Water, Mineral Water), By Product (Still Bottle Water, Packaged Drinking Water, Functional Water Bottle, Flavored Bottled Water, Distilled Bottled Water, arbonated Bottle Water), By Material (Polyethylene Terephthalate (PET), Glass), By Purchasing Sources (Supermarket/Hypermarket, Online Retail Stores, Grocery Stores, Food Serving Places, E-retailers, Clubs, Home and Office Delivery, Others), By Pack Size (1501 ml and above, 1001 ml - 1500 ml, 501 ml - 1000 ml, 331 ml - 500ml, 330 ml), By End-user Packaging (Plastic Bottle, Glass Bottle, Drum (Bulk), Can) And Competitive Landscape
| Product Code: ETC015602 | Publication Date: Jun 2023 | Updated Date: Feb 2026 | Product Type: Report | |
| Publisher: 6Wresearch | Author: Ravi Bhandari | No. of Pages: 70 | No. of Figures: 35 | No. of Tables: 5 |
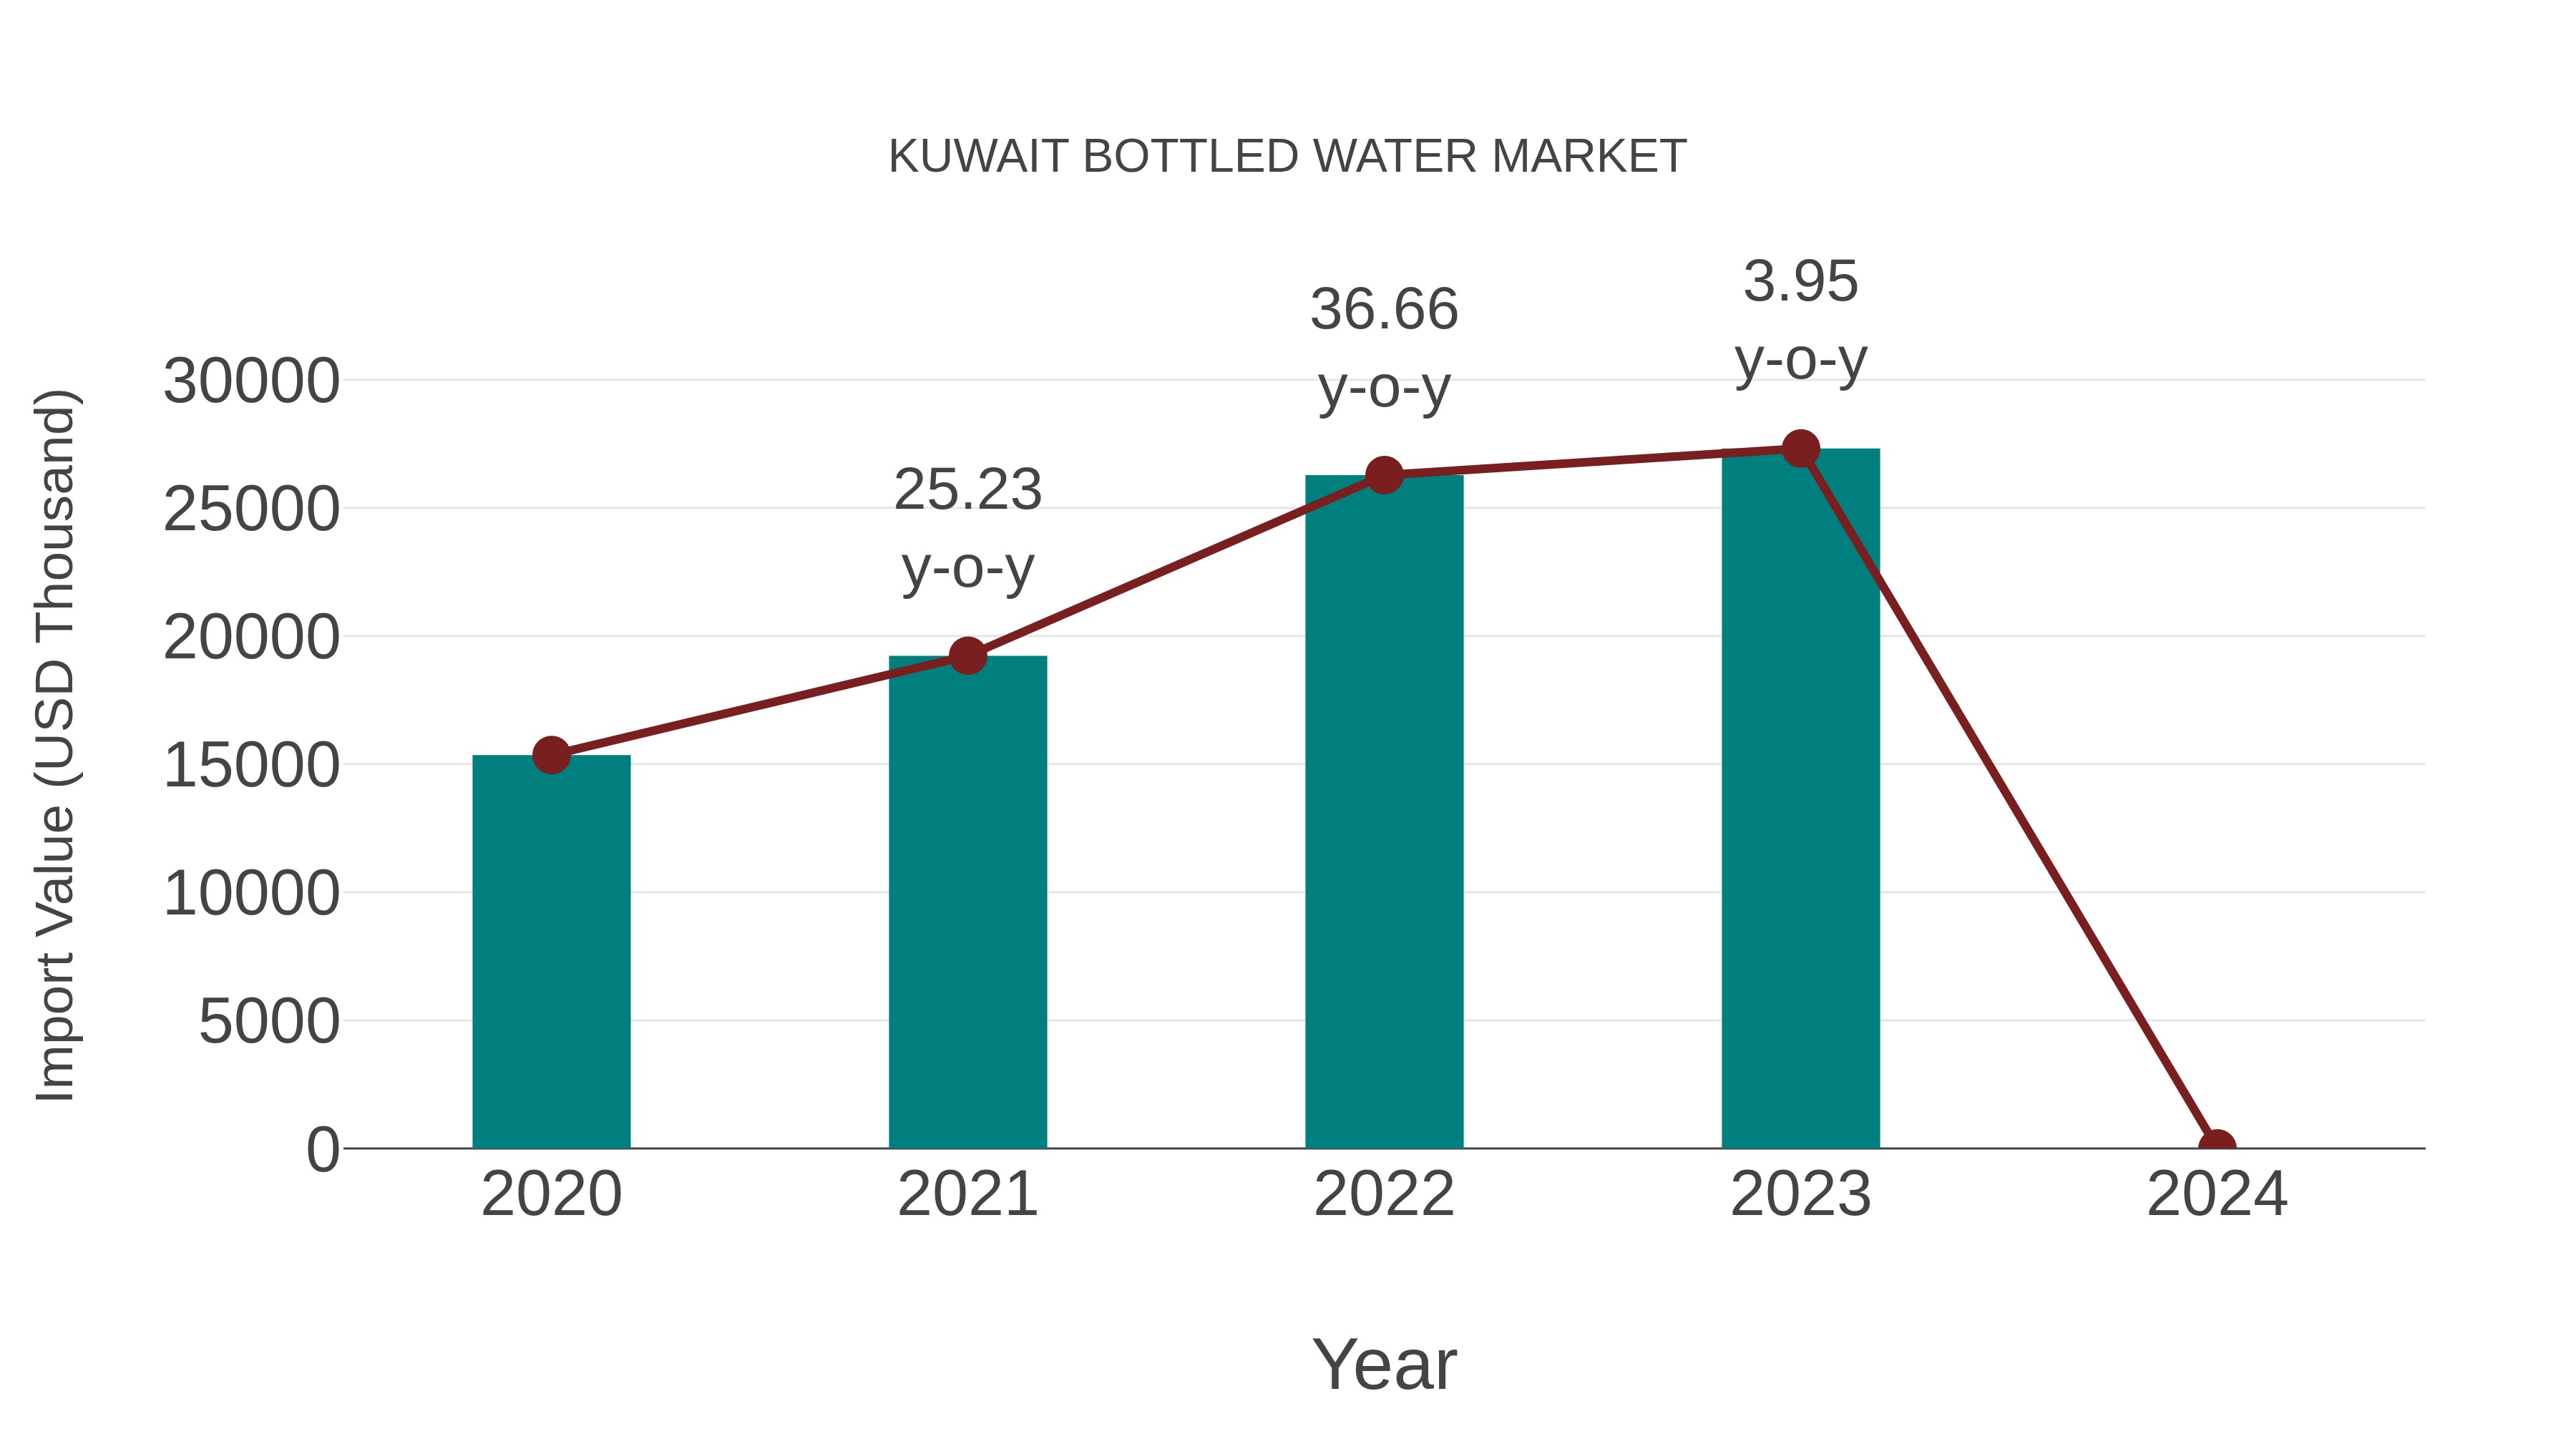
Kuwait Bottled Water Market: Import Trend Analysis
Kuwait bottled water market witnessed a significant import trend from 2020 to 2024, with a Compound Annual Growth Rate (CAGR) of 21.17%. This robust import momentum indicates a strong demand shift towards bottled water products, highlighting the market`s stability and attractiveness for international trade.
Kuwait Bottled Water Market Synopsis
The Kuwait bottled water market is expected to reach a value of US$ 72.7 million by 2026, growing at a CAGR of 4.6% during the forecast period (2020-2026). The increasing health consciousness among consumers will be driving the growth of this market over the forecast period. High levels of pollution as well as contamination in tap water have increased demand for packaged and safe drinking water in Kuwait, thereby driving the growth of this market. In addition to this, rising disposable incomes coupled with an increase in different flavors and packaging options available are further augmenting the sale of bottled water in Kuwait. Furthermore, increasing awareness about environmental issues has spurred demand for recyclable bottles that contain less plastic content compared to conventional bottles. Companies operating in this market such as Nestle Waters Middle East LLC have started using recycled PET materials for producing their bottles which is likely to drive sales going forward
Key Highlights of the Report:
- Kuwait Bottled Water Market Outlook
- Market Size of Kuwait Bottled Water Market, 2019
- Forecast of Kuwait Bottled Water Market, 2026
- Historical Data and Forecast of Kuwait Bottled Water Revenues & Volume for the Period 2016 - 2026
- Kuwait Bottled Water Market Trend Evolution
- Kuwait Bottled Water Market Drivers and Challenges
- Kuwait Bottled Water Price Trends
- Kuwait Bottled Water Porter's Five Forces
- Kuwait Bottled Water Industry Life Cycle
- Historical Data and Forecast of Kuwait Bottled Water Market Revenues & Volume By Quality for the Period 2016 - 2026
- Historical Data and Forecast of Kuwait Bottled Water Market Revenues & Volume By Premium for the Period 2016 - 2026
- Historical Data and Forecast of Kuwait Bottled Water Market Revenues & Volume By Non-Premium for the Period 2016 - 2026
- Historical Data and Forecast of Kuwait Bottled Water Market Revenues & Volume By Type for the Period 2016 - 2026
- Historical Data and Forecast of Kuwait Bottled Water Market Revenues & Volume By Still Water for the Period 2016 - 2026
- Historical Data and Forecast of Kuwait Bottled Water Market Revenues & Volume By Spring Water for the Period 2016 - 2026
- Historical Data and Forecast of Kuwait Bottled Water Market Revenues & Volume By Sparkling Water for the Period 2016 - 2026
- Historical Data and Forecast of Kuwait Bottled Water Market Revenues & Volume By Purified Water for the Period 2016 - 2026
- Historical Data and Forecast of Kuwait Bottled Water Market Revenues & Volume By Mineral Water for the Period 2016 - 2026
- Historical Data and Forecast of Kuwait Bottled Water Market Revenues & Volume By Product for the Period 2016 - 2026
- Historical Data and Forecast of Kuwait Bottled Water Market Revenues & Volume By Still Bottle Water for the Period 2016 - 2026
- Historical Data and Forecast of Kuwait Bottled Water Market Revenues & Volume By Packaged Drinking Water for the Period 2016 - 2026
- Historical Data and Forecast of Kuwait Bottled Water Market Revenues & Volume By Functional Water Bottle for the Period 2016 - 2026
- Historical Data and Forecast of Kuwait Bottled Water Market Revenues & Volume By Flavored Bottled Water for the Period 2016 - 2026
- Historical Data and Forecast of Kuwait Bottled Water Market Revenues & Volume By Distilled Bottled Water for the Period 2016 - 2026
- Historical Data and Forecast of Kuwait Bottled Water Market Revenues & Volume By arbonated Bottle Water for the Period 2016 - 2026
- Historical Data and Forecast of Kuwait Bottled Water Market Revenues & Volume By Material for the Period 2016 - 2026
- Historical Data and Forecast of Kuwait Bottled Water Market Revenues & Volume By Polyethylene Terephthalate (PET) for the Period 2016 - 2026
- Historical Data and Forecast of Kuwait Bottled Water Market Revenues & Volume By Glass for the Period 2016 - 2026
- Historical Data and Forecast of Kuwait Bottled Water Market Revenues & Volume By Purchasing Sources for the Period 2016 - 2026
- Historical Data and Forecast of Kuwait Bottled Water Market Revenues & Volume By Supermarket/Hypermarket for the Period 2016 - 2026
- Historical Data and Forecast of Kuwait Bottled Water Market Revenues & Volume By Online Retail Stores for the Period 2016 - 2026
- Historical Data and Forecast of Kuwait Bottled Water Market Revenues & Volume By Grocery Stores for the Period 2016 - 2026
- Historical Data and Forecast of Kuwait Bottled Water Market Revenues & Volume By Food Serving Places for the Period 2016 - 2026
- Historical Data and Forecast of Kuwait Bottled Water Market Revenues & Volume By E-retailers for the Period 2016 - 2026
- Historical Data and Forecast of Kuwait Bottled Water Market Revenues & Volume By Clubs for the Period 2016 - 2026
- Historical Data and Forecast of Kuwait Bottled Water Market Revenues & Volume By Home and Office Delivery for the Period 2016 - 2026
- Historical Data and Forecast of Kuwait Bottled Water Market Revenues & Volume By Others for the Period 2016 - 2026
- Historical Data and Forecast of Kuwait Bottled Water Market Revenues & Volume By Origin of Product for the Period 2016 - 2026
- Historical Data and Forecast of Kuwait Bottled Water Market Revenues & Volume By Imported for the Period 2016 - 2026
- Historical Data and Forecast of Kuwait Bottled Water Market Revenues & Volume By Domestic for the Period 2016 - 2026
- Historical Data and Forecast of Kuwait Bottled Water Market Revenues & Volume By Pack Size for the Period 2016 - 2026
- Historical Data and Forecast of Kuwait Bottled Water Market Revenues & Volume By 1501 ml and above for the Period 2016 - 2026
- Historical Data and Forecast of Kuwait Bottled Water Market Revenues & Volume By 1001 ml - 1500 ml for the Period 2016 - 2026
- Historical Data and Forecast of Kuwait Bottled Water Market Revenues & Volume By 501 ml - 1000 ml for the Period 2016 - 2026
- Historical Data and Forecast of Kuwait Bottled Water Market Revenues & Volume By 331 ml - 500ml for the Period 2016 - 2026
- Historical Data and Forecast of Kuwait Bottled Water Market Revenues & Volume By 330 ml for the Period 2016 - 2026
- Historical Data and Forecast of Kuwait Bottled Water Market Revenues & Volume By End-user Packaging for the Period 2016 - 2026
- Historical Data and Forecast of Kuwait Bottled Water Market Revenues & Volume By Plastic Bottle for the Period 2016 - 2026
- Historical Data and Forecast of Kuwait Bottled Water Market Revenues & Volume By Glass Bottle for the Period 2016 - 2026
- Historical Data and Forecast of Kuwait Bottled Water Market Revenues & Volume By Drum (Bulk) for the Period 2016 - 2026
- Historical Data and Forecast of Kuwait Bottled Water Market Revenues & Volume By Can for the Period 2016 - 2026
- Kuwait Bottled Water Import Export Trade Statistics
- Market Opportunity Assessment By Quality
- Market Opportunity Assessment By Type
- Market Opportunity Assessment By Product
- Market Opportunity Assessment By Material
- Market Opportunity Assessment By Purchasing Sources
- Market Opportunity Assessment By Origin of Product
- Market Opportunity Assessment By Pack Size
- Market Opportunity Assessment By End-user Packaging
- Kuwait Bottled Water Top Companies Market Share
- Kuwait Bottled Water Competitive Benchmarking By Technical and Operational Parameters
- Kuwait Bottled Water Company Profiles
- Kuwait Bottled Water Key Strategic Recommendations
Frequently Asked Questions About the Market Study (FAQs):
6Wresearch actively monitors the Kuwait Bottled Water Market and publishes its comprehensive annual report, highlighting emerging trends, growth drivers, revenue analysis, and forecast outlook. Our insights help businesses to make data-backed strategic decisions with ongoing market dynamics. Our analysts track relevent industries related to the Kuwait Bottled Water Market, allowing our clients with actionable intelligence and reliable forecasts tailored to emerging regional needs.
Yes, we provide customisation as per your requirements. To learn more, feel free to contact us on sales@6wresearch.com
1 Executive Summary |
2 Introduction |
2.1 Key Highlights of the Report |
2.2 Report Description |
2.3 Market Scope & Segmentation |
2.4 Research Methodology |
2.5 Assumptions |
3 Kuwait Bottled Water Market Overview |
3.1 Kuwait Country Macro Economic Indicators |
3.2 Kuwait Bottled Water Market Revenues & Volume, 2019 & 2026F |
3.3 Kuwait Bottled Water Market - Industry Life Cycle |
3.4 Kuwait Bottled Water Market - Porter's Five Forces |
3.5 Kuwait Bottled Water Market Revenues & Volume Share, By Quality, 2019 & 2026F |
3.6 Kuwait Bottled Water Market Revenues & Volume Share, By Type, 2019 & 2026F |
3.7 Kuwait Bottled Water Market Revenues & Volume Share, By Product, 2019 & 2026F |
3.8 Kuwait Bottled Water Market Revenues & Volume Share, By Material, 2019 & 2026F |
3.9 Kuwait Bottled Water Market Revenues & Volume Share, By Purchasing Sources, 2019 & 2026F |
3.10 Kuwait Bottled Water Market Revenues & Volume Share, By Origin of Product, 2019 & 2026F |
3.11 Kuwait Bottled Water Market Revenues & Volume Share, By Pack Size, 2019 & 2026F |
4 Kuwait Bottled Water Market Dynamics |
4.1 Impact Analysis |
4.2 Market Drivers |
4.3 Market Restraints |
5 Kuwait Bottled Water Market Trends |
6 Kuwait Bottled Water Market, By Types |
6.1 Kuwait Bottled Water Market, By Quality |
6.1.1 Overview and Analysis |
6.1.2 Kuwait Bottled Water Market Revenues & Volume, By Quality, 2016 - 2026F |
6.1.3 Kuwait Bottled Water Market Revenues & Volume, By Premium, 2016 - 2026F |
6.1.4 Kuwait Bottled Water Market Revenues & Volume, By Non-Premium, 2016 - 2026F |
6.2 Kuwait Bottled Water Market, By Type |
6.2.1 Overview and Analysis |
6.2.2 Kuwait Bottled Water Market Revenues & Volume, By Still Water, 2016 - 2026F |
6.2.3 Kuwait Bottled Water Market Revenues & Volume, By Spring Water, 2016 - 2026F |
6.2.4 Kuwait Bottled Water Market Revenues & Volume, By Sparkling Water, 2016 - 2026F |
6.2.5 Kuwait Bottled Water Market Revenues & Volume, By Purified Water, 2016 - 2026F |
6.2.6 Kuwait Bottled Water Market Revenues & Volume, By Mineral Water, 2016 - 2026F |
6.3 Kuwait Bottled Water Market, By Product |
6.3.1 Overview and Analysis |
6.3.2 Kuwait Bottled Water Market Revenues & Volume, By Still Bottle Water, 2016 - 2026F |
6.3.3 Kuwait Bottled Water Market Revenues & Volume, By Packaged Drinking Water, 2016 - 2026F |
6.3.4 Kuwait Bottled Water Market Revenues & Volume, By Functional Water Bottle, 2016 - 2026F |
6.3.5 Kuwait Bottled Water Market Revenues & Volume, By Flavored Bottled Water, 2016 - 2026F |
6.3.6 Kuwait Bottled Water Market Revenues & Volume, By Distilled Bottled Water, 2016 - 2026F |
6.3.7 Kuwait Bottled Water Market Revenues & Volume, By arbonated Bottle Water, 2016 - 2026F |
6.4 Kuwait Bottled Water Market, By Material |
6.4.1 Overview and Analysis |
6.4.2 Kuwait Bottled Water Market Revenues & Volume, By Polyethylene Terephthalate (PET), 2016 - 2026F |
6.4.3 Kuwait Bottled Water Market Revenues & Volume, By Glass, 2016 - 2026F |
6.5 Kuwait Bottled Water Market, By Purchasing Sources |
6.5.1 Overview and Analysis |
6.5.2 Kuwait Bottled Water Market Revenues & Volume, By Supermarket/Hypermarket, 2016 - 2026F |
6.5.3 Kuwait Bottled Water Market Revenues & Volume, By Online Retail Stores, 2016 - 2026F |
6.5.4 Kuwait Bottled Water Market Revenues & Volume, By Grocery Stores, 2016 - 2026F |
6.5.5 Kuwait Bottled Water Market Revenues & Volume, By Food Serving Places, 2016 - 2026F |
6.5.6 Kuwait Bottled Water Market Revenues & Volume, By E-retailers, 2016 - 2026F |
6.5.7 Kuwait Bottled Water Market Revenues & Volume, By Clubs, 2016 - 2026F |
6.5.8 Kuwait Bottled Water Market Revenues & Volume, By Others, 2016 - 2026F |
6.5.9 Kuwait Bottled Water Market Revenues & Volume, By Others, 2016 - 2026F |
6.6 Kuwait Bottled Water Market, By Origin of Product |
6.6.1 Overview and Analysis |
6.6.2 Kuwait Bottled Water Market Revenues & Volume, By Imported, 2016 - 2026F |
6.6.3 Kuwait Bottled Water Market Revenues & Volume, By Domestic, 2016 - 2026F |
6.7 Kuwait Bottled Water Market, By Pack Size |
6.7.1 Overview and Analysis |
6.7.2 Kuwait Bottled Water Market Revenues & Volume, By 1501 ml and above, 2016 - 2026F |
6.7.3 Kuwait Bottled Water Market Revenues & Volume, By 1001 ml - 1500 ml, 2016 - 2026F |
6.7.4 Kuwait Bottled Water Market Revenues & Volume, By 331 ml - 500ml, 2016 - 2026F |
6.7.5 Kuwait Bottled Water Market Revenues & Volume, By 331 ml - 500ml, 2016 - 2026F |
6.7.6 Kuwait Bottled Water Market Revenues & Volume, By 330 ml, 2016 - 2026F |
6.8 Kuwait Bottled Water Market, By End-user Packaging |
6.8.1 Overview and Analysis |
6.8.2 Kuwait Bottled Water Market Revenues & Volume, By Plastic Bottle, 2016 - 2026F |
6.8.3 Kuwait Bottled Water Market Revenues & Volume, By Glass Bottle, 2016 - 2026F |
6.8.4 Kuwait Bottled Water Market Revenues & Volume, By Can, 2016 - 2026F |
6.8.5 Kuwait Bottled Water Market Revenues & Volume, By Can, 2016 - 2026F |
7 Kuwait Bottled Water Market Import-Export Trade Statistics |
7.1 Kuwait Bottled Water Market Export to Major Countries |
7.2 Kuwait Bottled Water Market Imports from Major Countries |
8 Kuwait Bottled Water Market Key Performance Indicators |
9 Kuwait Bottled Water Market - Opportunity Assessment |
9.1 Kuwait Bottled Water Market Opportunity Assessment, By Quality, 2019 & 2026F |
9.2 Kuwait Bottled Water Market Opportunity Assessment, By Type, 2019 & 2026F |
9.3 Kuwait Bottled Water Market Opportunity Assessment, By Product, 2019 & 2026F |
9.4 Kuwait Bottled Water Market Opportunity Assessment, By Material, 2019 & 2026F |
9.5 Kuwait Bottled Water Market Opportunity Assessment, By Purchasing Sources, 2019 & 2026F |
9.6 Kuwait Bottled Water Market Opportunity Assessment, By Origin of Product, 2019 & 2026F |
9.7 Kuwait Bottled Water Market Opportunity Assessment, By Pack Size, 2019 & 2026F |
9.7 Kuwait Bottled Water Market Opportunity Assessment, By End-user Packaging, 2019 & 2026F |
10 Kuwait Bottled Water Market - Competitive Landscape |
10.1 Kuwait Bottled Water Market Revenue Share, By Companies, 2019 |
10.2 Kuwait Bottled Water Market Competitive Benchmarking, By Operating and Technical Parameters |
11 Company Profiles |
12 Recommendations |
13 Disclaimer |
Global Go To Market Strategy - 2030
Export potential enables firms to identify high-growth global markets with greater confidence by combining advanced trade intelligence with a structured quantitative methodology. The framework analyzes emerging demand trends and country-level import patterns while integrating macroeconomic and trade datasets such as GDP and population forecasts, bilateral import–export flows, tariff structures, elasticity differentials between developed and developing economies, geographic distance, and import demand projections. Using weighted trade values from 2020–2024 as the base period to project country-to-country export potential for 2030, these inputs are operationalized through calculated drivers such as gravity model parameters, tariff impact factors, and projected GDP per-capita growth. Through an analysis of hidden potentials, demand hotspots, and market conditions that are most favorable to success, this method enables firms to focus on target countries, maximize returns, and global expansion with data, backed by accuracy.
By factoring in the projected importer demand gap that is currently unmet and could be potential opportunity, it identifies the potential for the Exporter (Country) among 190 countries, against the general trade analysis, which identifies the biggest importer or exporter.
To discover high-growth global markets and optimize your business strategy:
Click Here
Pricing
- Single User License$ 1,995
- Department License$ 2,400
- Site License$ 3,120
- Global License$ 3,795

Leadership Perspectives from Industry Events
Search
Thought Leadership and Analyst Meet


Our Clients
6WResearch In News
- India Air Conditioner Market Set for Strong Rebound in 2026 After Weather-Led Correction and GST-Driven Recovery: 6Wresearch
- ADAS in India: How Automatic Emergency Braking, Blind Spot Detection & Driver Monitoring are Transforming Road Safety
- Doha a strategic location for EV manufacturing hub: IPA Qatar
- Demand for luxury TVs surging in the GCC, says Samsung
- Empowering Growth: The Thriving Journey of Bangladesh’s Cable Industry
- Demand for luxury TVs surging in the GCC, says Samsung
Latest Reports
- Poland Fire Protection Systems Market (2026-2032)
- Cape Verde Portable Hand-Thrown Extinguisher Market (2026-2032)
- Canada Portable Hand-Thrown Extinguisher Market (2026-2032)
- Cameroon Portable Hand-Thrown Extinguisher Market (2026-2032)
- Burundi Portable Hand-Thrown Extinguisher Market (2026-2032)
- Burkina Faso Portable Hand-Thrown Extinguisher Market (2026-2032)
- Bulgaria Portable Hand-Thrown Extinguisher Market (2026-2032)
- Brunei Portable Hand-Thrown Extinguisher Market (2026-2032)
- Botswana Portable Hand-Thrown Extinguisher Market (2026-2032)
- Bosnia and Herzegovina Portable Hand-Thrown Extinguisher Market (2026-2032)
Industry Events and Analyst Meet

HIMTEX 2026

India Refining Summit 2026

India EV Show 2026

EV tech India Expo 2026

Auto Tech Asia 2026
Whitepaper
- Middle East & Africa Commercial Security Market Click here to view more.
- Middle East & Africa Fire Safety Systems & Equipment Market Click here to view more.
- GCC Drone Market Click here to view more.
- Middle East Lighting Fixture Market Click here to view more.
- GCC Physical & Perimeter Security Market Click here to view more.