Latvia Wire Drawing Machine Market (2026-2032) | Revenue, Analysis, Outlook, Companies, Trends, Forecast, Growth, Share, Segmentation, Value, Industry & Size
Market Forecast By Distribution channel (Direct sales, Indirect sales), By Application (Electrical wiring, Cables, Tension-loaded structural components, Springs, Paper clips, Spokes for wheels, Stringed musical instruments), By End User Industry (Construction, Automotive, Media & Entertainment, Machinery & Heavy equipment, Marine industry, Manufacturing, Industrial, Consumer Goods) And Competitive Landscape
| Product Code: ETC5238126 | Publication Date: Nov 2023 | Updated Date: Apr 2026 | Product Type: Market Research Report | |
| Publisher: 6Wresearch | Author: Shubham Padhi | No. of Pages: 60 | No. of Figures: 30 | No. of Tables: 5 |
Latvia Wire Drawing Machine Market Size (2020-2030)
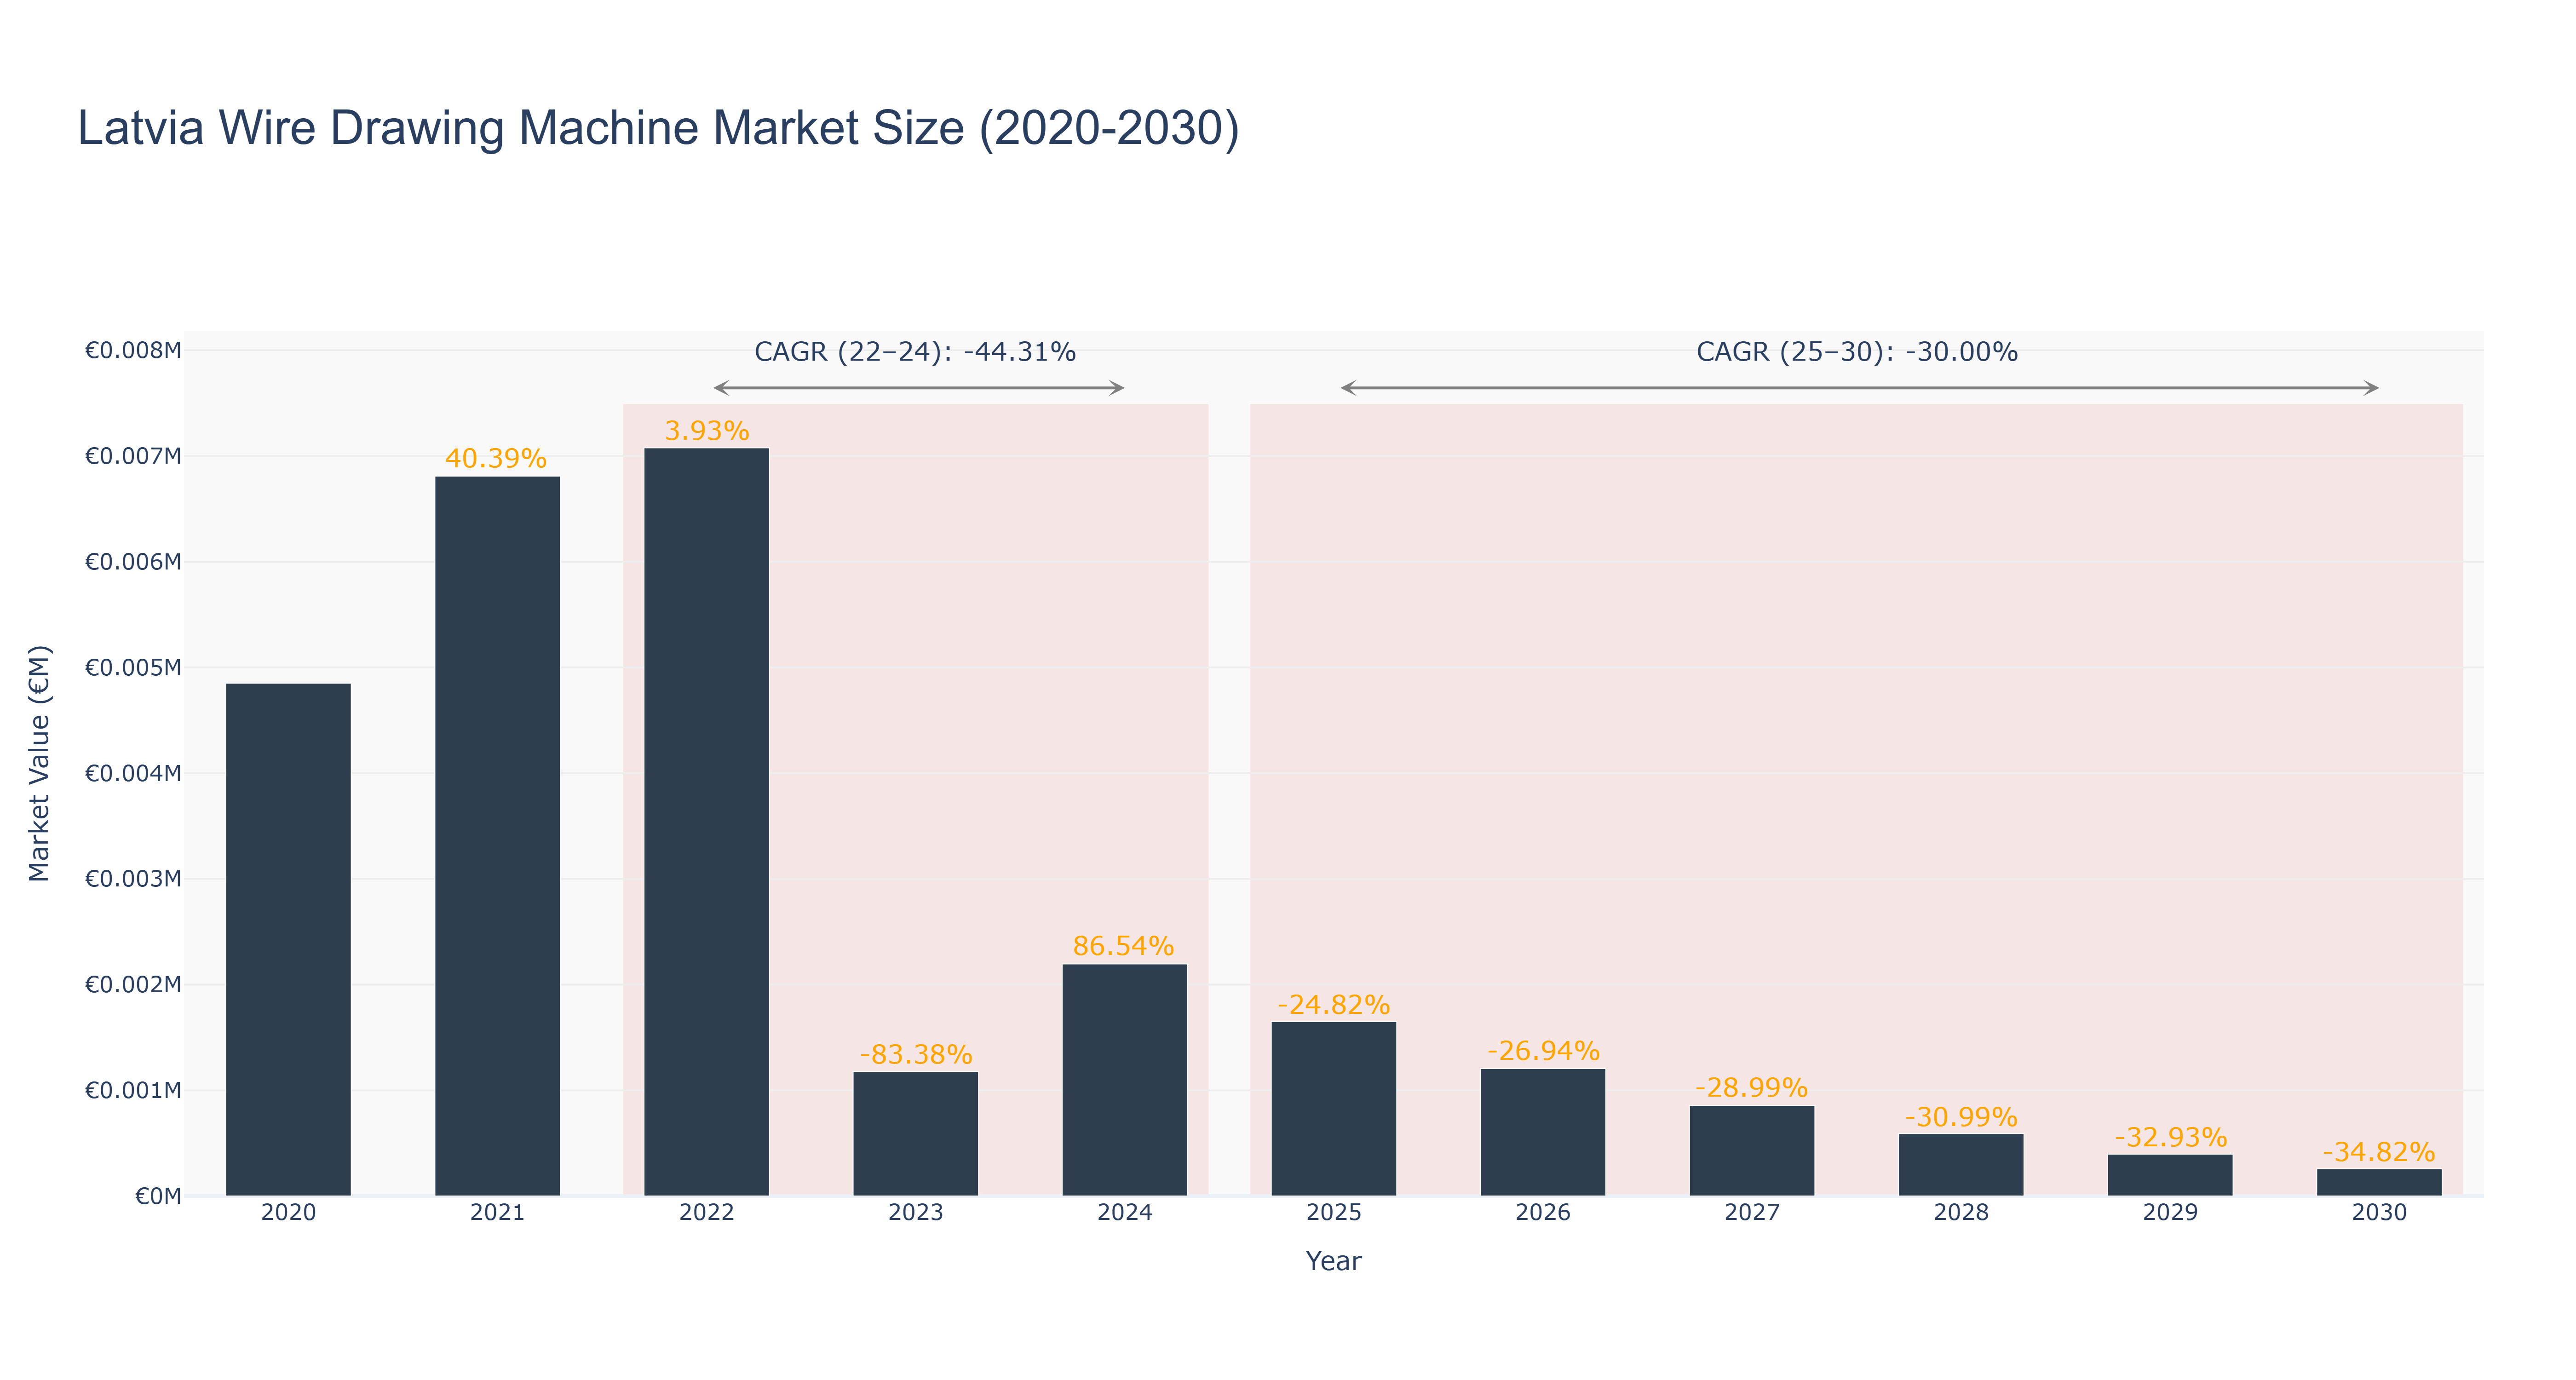
The Latvia Wire Drawing Machine Market has experienced significant fluctuations in its trajectory, marked by a peak market size of €7.08 thousand in 2022. The actual data from 2022 to 2024 reveals a CAGR of -44.31%, with market sizes declining sharply from €7.08 thousand in 2022 to €2.19 thousand in 2024, largely driven by economic uncertainties and reduced industrial demand. The forecasted period from 2025 to 2030 anticipates continued contraction, with a projected CAGR of -30.00%. Market sizes are expected to decrease from €1.65 thousand in 2025 to €258.22 thousand by 2030, reflecting ongoing challenges such as technological shifts and market saturation. While there are no specific upcoming projects highlighted, macroeconomic factors, including potential shifts in manufacturing and export strategies, may influence future recovery efforts. Overall, the market faces a challenging landscape, necessitating strategic adjustments by industry stakeholders.
Latvia Wire Drawing Machine Market: Production & Trade Performance (2019-2025)
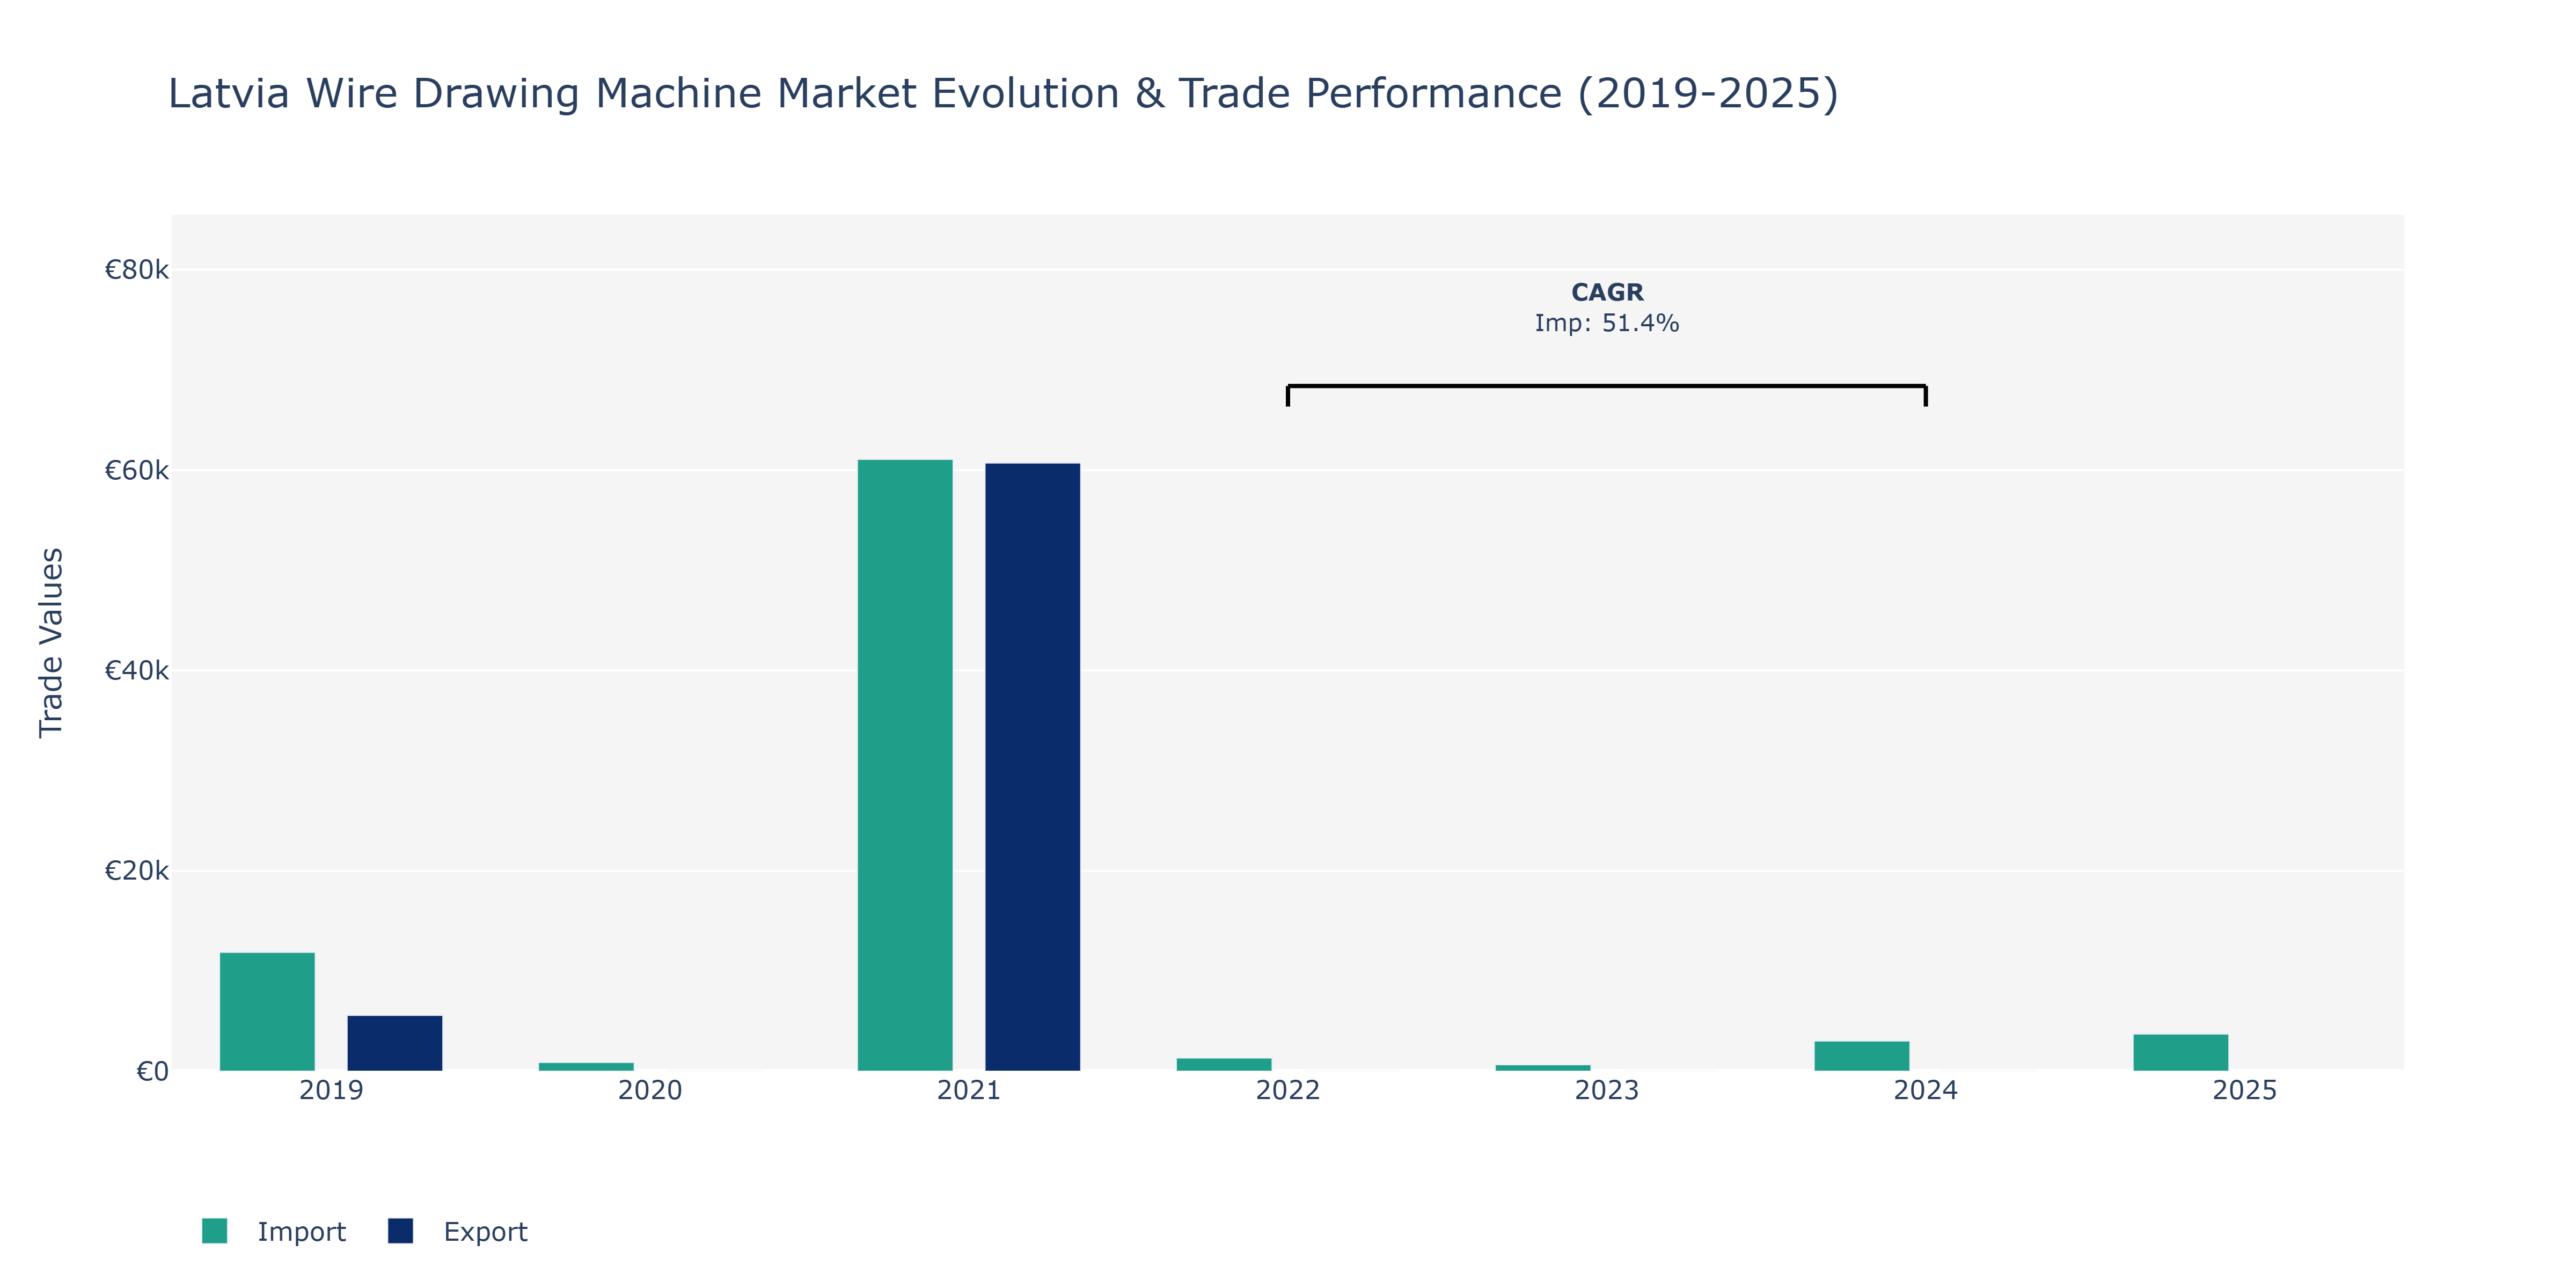
In the Latvia Wire Drawing Machine Market, exports experienced a substantial rise from €5.57 thousand in 2019 to €60.7 thousand in 2021, showcasing an extraordinary upward trajectory. This surge could be attributed to increased global demand for wire drawing machines, potentially fueled by advancements in technology and a growing emphasis on automation in various industries. On the other hand, imports fluctuated over the years, starting at €11.86 thousand in 2019, dropping to €866 in 2020, and gradually increasing in the following years, reaching €3.71 thousand in 2025. The fluctuations in imports could be influenced by factors such as changing trade policies, supply chain disruptions, and market dynamics impacting the procurement strategies of businesses operating in the wire drawing machine industry. The notable compound annual growth rate of 51.44% in imports from 2022 to 2024 indicates a rapid expansion in the market's appetite for imported wire drawing machines, possibly driven by the need for modernization and capacity enhancement in Latvia's manufacturing sector.
Key Highlights of the Report:
- Latvia Wire Drawing Machine Market Outlook
- Market Size of Latvia Wire Drawing Machine Market, 2025
- Forecast of Latvia Wire Drawing Machine Market, 2032
- Historical Data and Forecast of Latvia Wire Drawing Machine Revenues & Volume for the Period 2022 - 2032F
- Latvia Wire Drawing Machine Market Trend Evolution
- Latvia Wire Drawing Machine Market Drivers and Challenges
- Latvia Wire Drawing Machine Price Trends
- Latvia Wire Drawing Machine Porter`s Five Forces
- Latvia Wire Drawing Machine Industry Life Cycle
- Historical Data and Forecast of Latvia Wire Drawing Machine Market Revenues & Volume By Distribution channel for the Period 2022 - 2032F
- Historical Data and Forecast of Latvia Wire Drawing Machine Market Revenues & Volume By Direct sales for the Period 2022 - 2032F
- Historical Data and Forecast of Latvia Wire Drawing Machine Market Revenues & Volume By Indirect sales for the Period 2022 - 2032F
- Historical Data and Forecast of Latvia Wire Drawing Machine Market Revenues & Volume By Application for the Period 2022 - 2032F
- Historical Data and Forecast of Latvia Wire Drawing Machine Market Revenues & Volume By Electrical wiring for the Period 2022 - 2032F
- Historical Data and Forecast of Latvia Wire Drawing Machine Market Revenues & Volume By Cables for the Period 2022 - 2032F
- Historical Data and Forecast of Latvia Wire Drawing Machine Market Revenues & Volume By Tension-loaded structural components for the Period 2022 - 2032F
- Historical Data and Forecast of Latvia Wire Drawing Machine Market Revenues & Volume By Springs for the Period 2022 - 2032F
- Historical Data and Forecast of Latvia Wire Drawing Machine Market Revenues & Volume By Paper clips for the Period 2022 - 2032F
- Historical Data and Forecast of Latvia Wire Drawing Machine Market Revenues & Volume By Spokes for wheels for the Period 2022 - 2032F
- Historical Data and Forecast of Latvia Wire Drawing Machine Market Revenues & Volume By Stringed musical instruments for the Period 2022 - 2032F
- Historical Data and Forecast of Latvia Wire Drawing Machine Market Revenues & Volume By End User Industry for the Period 2022 - 2032F
- Historical Data and Forecast of Latvia Wire Drawing Machine Market Revenues & Volume By Construction for the Period 2022 - 2032F
- Historical Data and Forecast of Latvia Wire Drawing Machine Market Revenues & Volume By Automotive for the Period 2022 - 2032F
- Historical Data and Forecast of Latvia Wire Drawing Machine Market Revenues & Volume By Media & Entertainment for the Period 2022 - 2032F
- Historical Data and Forecast of Latvia Wire Drawing Machine Market Revenues & Volume By Machinery & Heavy equipment for the Period 2022 - 2032F
- Historical Data and Forecast of Latvia Wire Drawing Machine Market Revenues & Volume By Marine industry for the Period 2022 - 2032F
- Historical Data and Forecast of Latvia Wire Drawing Machine Market Revenues & Volume By Manufacturing for the Period 2022 - 2032F
- Historical Data and Forecast of Latvia Wire Drawing Machine Market Revenues & Volume By Industrial for the Period 2022 - 2032F
- Historical Data and Forecast of Latvia Wire Drawing Machine Market Revenues & Volume By Consumer Goods for the Period 2022 - 2032F
- Latvia Wire Drawing Machine Import Export Trade Statistics
- Market Opportunity Assessment By Distribution channel
- Market Opportunity Assessment By Application
- Market Opportunity Assessment By End User Industry
- Latvia Wire Drawing Machine Top Companies Market Share
- Latvia Wire Drawing Machine Competitive Benchmarking By Technical and Operational Parameters
- Latvia Wire Drawing Machine Company Profiles
- Latvia Wire Drawing Machine Key Strategic Recommendations
Frequently Asked Questions About the Market Study (FAQs):
6Wresearch actively monitors the Latvia Wire Drawing Machine Market and publishes its comprehensive annual report, highlighting emerging trends, growth drivers, revenue analysis, and forecast outlook. Our insights help businesses to make data-backed strategic decisions with ongoing market dynamics. Our analysts track relevent industries related to the Latvia Wire Drawing Machine Market, allowing our clients with actionable intelligence and reliable forecasts tailored to emerging regional needs.
Yes, we provide customisation as per your requirements. To learn more, feel free to contact us on sales@6wresearch.com
1 Executive Summary |
2 Introduction |
2.1 Key Highlights of the Report |
2.2 Report Description |
2.3 Market Scope & Segmentation |
2.4 Research Methodology |
2.5 Assumptions |
3 Latvia Wire Drawing Machine Market Overview |
3.1 Latvia Country Macro Economic Indicators |
3.2 Latvia Wire Drawing Machine Market Revenues & Volume, 2022 & 2032F |
3.3 Latvia Wire Drawing Machine Market - Industry Life Cycle |
3.4 Latvia Wire Drawing Machine Market - Porter's Five Forces |
3.5 Latvia Wire Drawing Machine Market Revenues & Volume Share, By Distribution channel, 2022 & 2032F |
3.6 Latvia Wire Drawing Machine Market Revenues & Volume Share, By Application, 2022 & 2032F |
3.7 Latvia Wire Drawing Machine Market Revenues & Volume Share, By End User Industry, 2022 & 2032F |
4 Latvia Wire Drawing Machine Market Dynamics |
4.1 Impact Analysis |
4.2 Market Drivers |
4.2.1 Increasing demand for high-quality wire products in various industries such as automotive, construction, and electronics. |
4.2.2 Technological advancements in wire drawing machines leading to improved efficiency and productivity. |
4.2.3 Government initiatives to promote domestic manufacturing and industrial growth in Latvia. |
4.3 Market Restraints |
4.3.1 High initial investment cost for setting up wire drawing machine manufacturing facilities. |
4.3.2 Fluctuations in raw material prices, such as steel and copper, impacting the production cost of wire drawing machines. |
4.3.3 Intense competition from established global wire drawing machine manufacturers. |
5 Latvia Wire Drawing Machine Market Trends |
6 Latvia Wire Drawing Machine Market Segmentations |
6.1 Latvia Wire Drawing Machine Market, By Distribution channel |
6.1.1 Overview and Analysis |
6.1.2 Latvia Wire Drawing Machine Market Revenues & Volume, By Direct sales, 2022 - 2032F |
6.1.3 Latvia Wire Drawing Machine Market Revenues & Volume, By Indirect sales, 2022 - 2032F |
6.2 Latvia Wire Drawing Machine Market, By Application |
6.2.1 Overview and Analysis |
6.2.2 Latvia Wire Drawing Machine Market Revenues & Volume, By Electrical wiring, 2022 - 2032F |
6.2.3 Latvia Wire Drawing Machine Market Revenues & Volume, By Cables, 2022 - 2032F |
6.2.4 Latvia Wire Drawing Machine Market Revenues & Volume, By Tension-loaded structural components, 2022 - 2032F |
6.2.5 Latvia Wire Drawing Machine Market Revenues & Volume, By Springs, 2022 - 2032F |
6.2.6 Latvia Wire Drawing Machine Market Revenues & Volume, By Paper clips, 2022 - 2032F |
6.2.7 Latvia Wire Drawing Machine Market Revenues & Volume, By Spokes for wheels, 2022 - 2032F |
6.3 Latvia Wire Drawing Machine Market, By End User Industry |
6.3.1 Overview and Analysis |
6.3.2 Latvia Wire Drawing Machine Market Revenues & Volume, By Construction, 2022 - 2032F |
6.3.3 Latvia Wire Drawing Machine Market Revenues & Volume, By Automotive, 2022 - 2032F |
6.3.4 Latvia Wire Drawing Machine Market Revenues & Volume, By Media & Entertainment, 2022 - 2032F |
6.3.5 Latvia Wire Drawing Machine Market Revenues & Volume, By Machinery & Heavy equipment, 2022 - 2032F |
6.3.6 Latvia Wire Drawing Machine Market Revenues & Volume, By Marine industry, 2022 - 2032F |
6.3.7 Latvia Wire Drawing Machine Market Revenues & Volume, By Manufacturing, 2022 - 2032F |
6.3.8 Latvia Wire Drawing Machine Market Revenues & Volume, By Consumer Goods, 2022 - 2032F |
6.3.9 Latvia Wire Drawing Machine Market Revenues & Volume, By Consumer Goods, 2022 - 2032F |
7 Latvia Wire Drawing Machine Market Import-Export Trade Statistics |
7.1 Latvia Wire Drawing Machine Market Export to Major Countries |
7.2 Latvia Wire Drawing Machine Market Imports from Major Countries |
8 Latvia Wire Drawing Machine Market Key Performance Indicators |
8.1 Average machine uptime percentage, indicating the efficiency and reliability of wire drawing machines. |
8.2 Adoption rate of Industry 4.0 technologies in wire drawing machines, reflecting the market's readiness for advanced manufacturing practices. |
8.3 Percentage of repeat customers or customer retention rate, showcasing customer satisfaction and loyalty towards wire drawing machine suppliers. |
8.4 Number of patents or innovations introduced by local wire drawing machine manufacturers, highlighting technological advancements and competitiveness in the market. |
8.5 Rate of skill development programs or workforce training initiatives in the wire drawing machine industry, indicating the sector's capability to meet evolving market demands. |
9 Latvia Wire Drawing Machine Market - Opportunity Assessment |
9.1 Latvia Wire Drawing Machine Market Opportunity Assessment, By Distribution channel, 2022 & 2032F |
9.2 Latvia Wire Drawing Machine Market Opportunity Assessment, By Application, 2022 & 2032F |
9.3 Latvia Wire Drawing Machine Market Opportunity Assessment, By End User Industry, 2022 & 2032F |
10 Latvia Wire Drawing Machine Market - Competitive Landscape |
10.1 Latvia Wire Drawing Machine Market Revenue Share, By Companies, 2025 |
10.2 Latvia Wire Drawing Machine Market Competitive Benchmarking, By Operating and Technical Parameters |
11 Company Profiles |
12 Recommendations | 13 Disclaimer |
Global Go To Market Strategy - 2030
Export potential enables firms to identify high-growth global markets with greater confidence by combining advanced trade intelligence with a structured quantitative methodology. The framework analyzes emerging demand trends and country-level import patterns while integrating macroeconomic and trade datasets such as GDP and population forecasts, bilateral import–export flows, tariff structures, elasticity differentials between developed and developing economies, geographic distance, and import demand projections. Using weighted trade values from 2020–2024 as the base period to project country-to-country export potential for 2030, these inputs are operationalized through calculated drivers such as gravity model parameters, tariff impact factors, and projected GDP per-capita growth. Through an analysis of hidden potentials, demand hotspots, and market conditions that are most favorable to success, this method enables firms to focus on target countries, maximize returns, and global expansion with data, backed by accuracy.
By factoring in the projected importer demand gap that is currently unmet and could be potential opportunity, it identifies the potential for the Exporter (Country) among 190 countries, against the general trade analysis, which identifies the biggest importer or exporter.
To discover high-growth global markets and optimize your business strategy:
Click Here
Pricing
- Single User License$ 1,995
- Department License$ 2,400
- Site License$ 3,120
- Global License$ 3,795

Leadership Perspectives from Industry Events
Search
Thought Leadership and Analyst Meet


Our Clients
6WResearch In News
- India Export Attractiveness Tracker 2026
- India Air Conditioner Market Set for Strong Rebound in 2026 After Weather-Led Correction and GST-Driven Recovery: 6Wresearch
- ADAS in India: How Automatic Emergency Braking, Blind Spot Detection & Driver Monitoring are Transforming Road Safety
- Doha a strategic location for EV manufacturing hub: IPA Qatar
- Demand for luxury TVs surging in the GCC, says Samsung
- Empowering Growth: The Thriving Journey of Bangladesh’s Cable Industry
Latest Reports
- Qatar Access and Home Network Market (2026-2032)
- Nicaragua RPG Gaming Market (2026-2032)
- New Zealand RPG Gaming Market (2026-2032)
- Netherlands RPG Gaming Market (2026-2032)
- Nauru RPG Gaming Market (2026-2032)
- Namibia RPG Gaming Market (2026-2032)
- Mozambique RPG Gaming Market (2026-2032)
- Montenegro RPG Gaming Market (2026-2032)
- Mongolia RPG Gaming Market (2026-2032)
- Monaco RPG Gaming Market (2026-2032)
Industry Events and Analyst Meet

EV India Expo 2026

HIMTEX 2026

India Refining Summit 2026

India EV Show 2026

EV tech India Expo 2026
Whitepaper
- Middle East & Africa Commercial Security Market Click here to view more.
- Middle East & Africa Fire Safety Systems & Equipment Market Click here to view more.
- GCC Drone Market Click here to view more.
- Middle East Lighting Fixture Market Click here to view more.
- GCC Physical & Perimeter Security Market Click here to view more.