Lebanon Water Treatment Market (2026-2032) | Size, Trends, Growth, Industry, Analysis, Revenue, Forecast, Companies, Share, Outlook & Value
Market Forecast By Types (Distillation, Filtration, Disinfection, Reverse Osmosis), By Applications (Residential, Non-Residential), By Installations (Point Of Use , Point Of Entry) And Competitive Landscape
| Product Code: ETC007687 | Publication Date: Sep 2020 | Updated Date: Jun 2026 | Product Type: Report | |
| Publisher: 6Wresearch | Author: Ravi Bhandari | No. of Pages: 70 | No. of Figures: 35 | No. of Tables: 5 |
Lebanon Water Treatment Market Summary
The lebanon water treatment market was estimated at USD 1490 Million in 2025 and is projected to reach USD 2153 Million by 2032, growing at a CAGR of 6.2% from 2026 to 2032.
Lebanon Water Treatment Market Year-wise Growth Rate and Key Drivers
This graph highlights how the Lebanon Water Treatment Market has steadily grown over the past five years, supported by major growth factors.
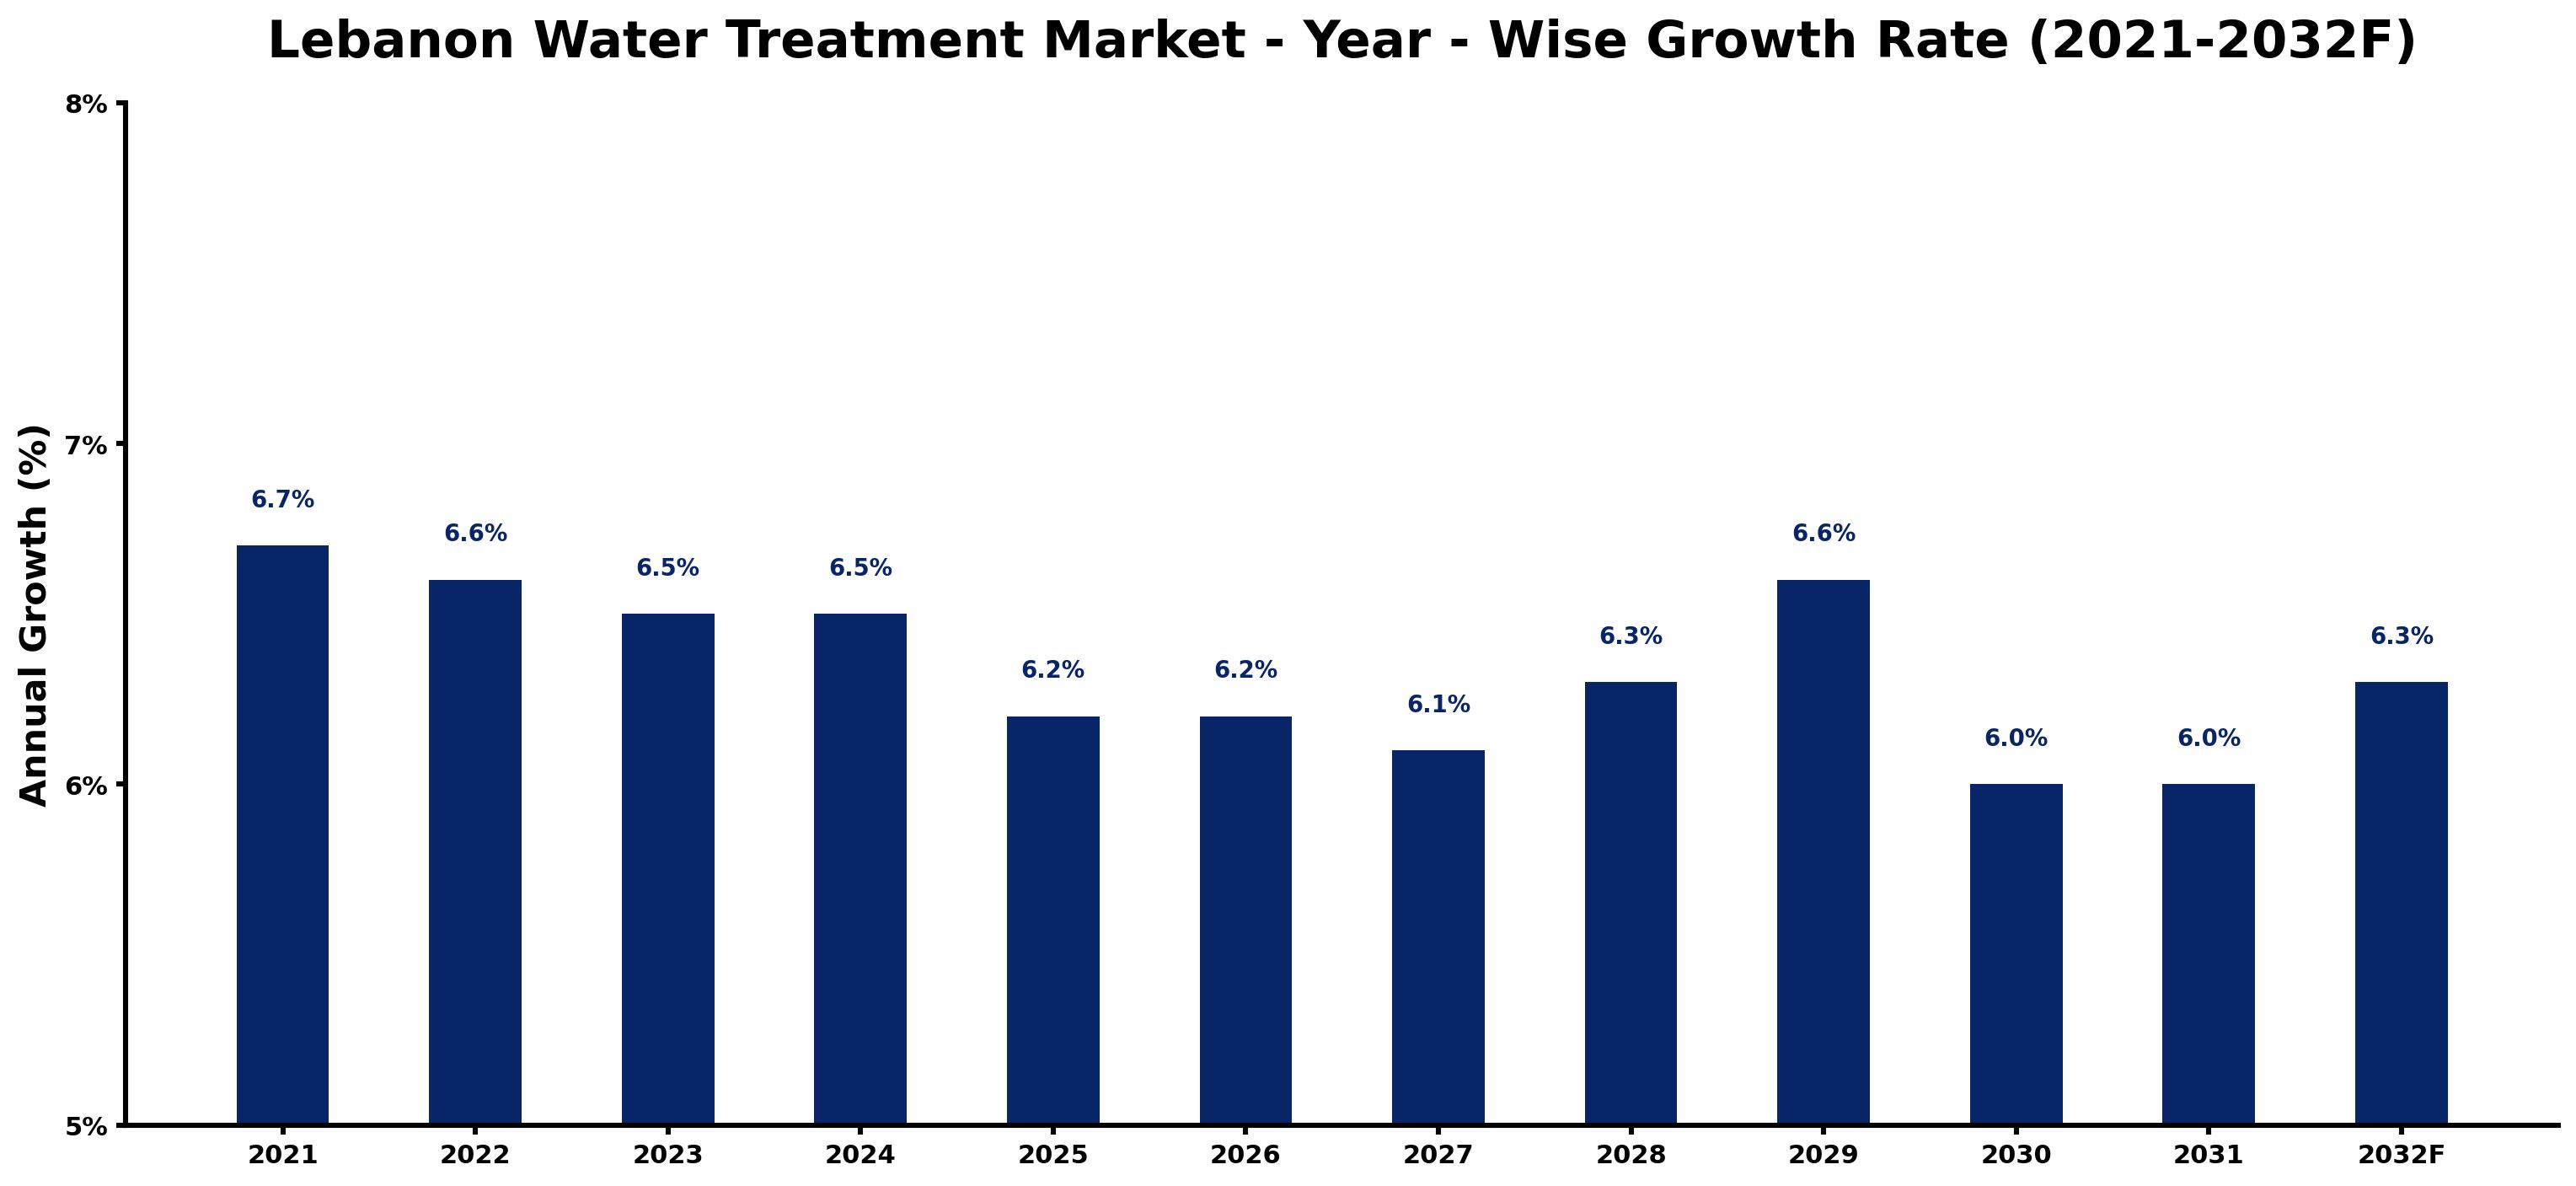
The table below presents the year wise growth rates along with the key drivers influencing the market
| Year | Growth Rate | Major Drivers |
| 2021 | 6.7% | Infrastructure investments gain momentum as Lebanon's recovery from economic troubles begins. |
| 2022 | 6.6% | Local companies pivot towards sustainable water solutions amidst environmental concerns rising. |
| 2023 | 6.5% | Focus on improving urban water systems becomes essential due to increasing population density. |
| 2024 | 6.5% | International collaborations emerge, enhancing technology transfer in the water treatment sector. |
| 2025 | 6.2% | New filtration technologies enter the market, promising better quality and efficiency. |
| 2026 | 6.2% | Public awareness campaigns highlight the importance of clean water for health and safety. |
| 2027 | 6.1% | Private sector involvement intensifies as investments in water infrastructure grow. |
| 2028 | 6.3% | Emerging startups introduce innovative approaches to tackle Lebanon's water scarcity challenges. |
| 2029 | 6.6% | Smart water management solutions become critical as climate change effects intensify. |
| 2030 | 6.0% | Partnerships with NGOs strengthen community-based water projects across rural areas. |
| 2031 | 6.0% | Urbanization continues, creating urgent demand for advanced wastewater treatment facilities. |
| 2032 | 6.3% | Long-term planning emphasizes resilience against climate variability and water quality issues. |
Note - Market size estimations and growth projections presented in this report are based on 6Wresearch's advanced forecasting approach, validated with industry datasets as of June 2026.
Key Highlights of the Report:
- Lebanon Water Treatment Market Outlook
- Market Size of Lebanon Water Treatment Market, 2025
- Forecast of Lebanon Water Treatment Market, 2032F
- Historical Data and Forecast of Lebanon Water Treatment Revenues & Volume for the Period 2022-2032F
- Lebanon Water Treatment Market Trend Evolution
- Lebanon Water Treatment Market Drivers and Challenges
- Lebanon Water Treatment Price Trends
- Lebanon Water Treatment Porter's Five Forces
- Lebanon Water Treatment Industry Life Cycle
- Historical Data and Forecast of Lebanon Water Treatment Market Revenues & Volume By Types for the Period 2022-2032F
- Historical Data and Forecast of Lebanon Water Treatment Market Revenues & Volume By Distillation? for the Period 2022-2032F
- Historical Data and Forecast of Lebanon Water Treatment Market Revenues & Volume By Filtration? for the Period 2022-2032F
- Historical Data and Forecast of Lebanon Water Treatment Market Revenues & Volume By Disinfection for the Period 2022-2032F
- Historical Data and Forecast of Lebanon Water Treatment Market Revenues & Volume By Reverse Osmosis for the Period 2022-2032F
- Historical Data and Forecast of Lebanon Water Treatment Market Revenues & Volume By Applications for the Period 2022-2032F
- Historical Data and Forecast of Lebanon Water Treatment Market Revenues & Volume By Residential? for the Period 2022-2032F
- Historical Data and Forecast of Lebanon Water Treatment Market Revenues & Volume By Non-Residential? for the Period 2022-2032F
- Historical Data and Forecast of Lebanon Water Treatment Market Revenues & Volume By Installations for the Period 2022-2032F
- Historical Data and Forecast of Lebanon Water Treatment Market Revenues & Volume By Point Of Use for the Period 2022-2032F
- Historical Data and Forecast of Lebanon Water Treatment Market Revenues & Volume By Point Of Entry for the Period 2022-2032F
- Lebanon Water Treatment Import Export Trade Statistics
- Market Opportunity Assessment By Types
- Market Opportunity Assessment By Applications
- Market Opportunity Assessment By Installations
- Lebanon Water Treatment Top Companies Market Share
- Lebanon Water Treatment Competitive Benchmarking By Technical and Operational Parameters
- Lebanon Water Treatment Company Profiles
- Lebanon Water Treatment Key Strategic Recommendations
Frequently Asked Questions About the Market Study (FAQs):
6Wresearch actively monitors the Lebanon Water Treatment Market and publishes its comprehensive annual report, highlighting emerging trends, growth drivers, revenue analysis, and forecast outlook. Our insights help businesses to make data-backed strategic decisions with ongoing market dynamics. Our analysts track relevent industries related to the Lebanon Water Treatment Market, allowing our clients with actionable intelligence and reliable forecasts tailored to emerging regional needs.
Yes, we provide customisation as per your requirements. To learn more, feel free to contact us on sales@6wresearch.com
1 Executive Summary |
2 Introduction |
2.1 Key Highlights of the Report |
2.2 Report Description |
2.3 Market Scope & Segmentation |
2.4 Research Methodology |
2.5 Assumptions |
3 Lebanon Water Treatment Market Overview |
3.1 Lebanon Country Macro Economic Indicators |
3.2 Lebanon Water Treatment Market Revenues & Volume, 2022 & 2032F |
3.3 Lebanon Water Treatment Market - Industry Life Cycle |
3.4 Lebanon Water Treatment Market - Porter's Five Forces |
3.5 Lebanon Water Treatment Market Revenues & Volume Share, By Types, 2022 & 2032F |
3.6 Lebanon Water Treatment Market Revenues & Volume Share, By Applications, 2022 & 2032F |
3.7 Lebanon Water Treatment Market Revenues & Volume Share, By Installations, 2022 & 2032F |
4 Lebanon Water Treatment Market Dynamics |
4.1 Impact Analysis |
4.2 Market Drivers |
4.3 Market Restraints |
5 Lebanon Water Treatment Market Trends |
6 Lebanon Water Treatment Market, By Types |
6.1 Lebanon Water Treatment Market, By Types |
6.1.1 Overview and Analysis |
6.1.2 Lebanon Water Treatment Market Revenues & Volume, By Types, 2022 - 2032F |
6.1.3 Lebanon Water Treatment Market Revenues & Volume, By Distillation , 2022 - 2032F |
6.1.4 Lebanon Water Treatment Market Revenues & Volume, By Filtration , 2022 - 2032F |
6.1.5 Lebanon Water Treatment Market Revenues & Volume, By Disinfection, 2022 - 2032F |
6.1.6 Lebanon Water Treatment Market Revenues & Volume, By Reverse Osmosis, 2022 - 2032F |
6.2 Lebanon Water Treatment Market, By Applications |
6.2.1 Overview and Analysis |
6.2.2 Lebanon Water Treatment Market Revenues & Volume, By Residential , 2022 - 2032F |
6.2.3 Lebanon Water Treatment Market Revenues & Volume, By Non-Residential , 2022 - 2032F |
6.3 Lebanon Water Treatment Market, By Installations |
6.3.1 Overview and Analysis |
6.3.2 Lebanon Water Treatment Market Revenues & Volume, By Point Of Use , 2022 - 2032F |
6.3.3 Lebanon Water Treatment Market Revenues & Volume, By Point Of Entry, 2022 - 2032F |
7 Lebanon Water Treatment Market Import-Export Trade Statistics |
7.1 Lebanon Water Treatment Market Export to Major Countries |
7.2 Lebanon Water Treatment Market Imports from Major Countries |
8 Lebanon Water Treatment Market Key Performance Indicators |
9 Lebanon Water Treatment Market - Opportunity Assessment |
9.1 Lebanon Water Treatment Market Opportunity Assessment, By Types, 2022 & 2032F |
9.2 Lebanon Water Treatment Market Opportunity Assessment, By Applications, 2022 & 2032F |
9.3 Lebanon Water Treatment Market Opportunity Assessment, By Installations, 2022 & 2032F |
10 Lebanon Water Treatment Market - Competitive Landscape |
10.1 Lebanon Water Treatment Market Revenue Share, By Companies, 2025 |
10.2 Lebanon Water Treatment Market Competitive Benchmarking, By Operating and Technical Parameters |
11 Company Profiles |
12 Recommendations |
13 Disclaimer |
Global Go To Market Strategy - 2030
Export potential enables firms to identify high-growth global markets with greater confidence by combining advanced trade intelligence with a structured quantitative methodology. The framework analyzes emerging demand trends and country-level import patterns while integrating macroeconomic and trade datasets such as GDP and population forecasts, bilateral import–export flows, tariff structures, elasticity differentials between developed and developing economies, geographic distance, and import demand projections. Using weighted trade values from 2020–2024 as the base period to project country-to-country export potential for 2030, these inputs are operationalized through calculated drivers such as gravity model parameters, tariff impact factors, and projected GDP per-capita growth. Through an analysis of hidden potentials, demand hotspots, and market conditions that are most favorable to success, this method enables firms to focus on target countries, maximize returns, and global expansion with data, backed by accuracy.
By factoring in the projected importer demand gap that is currently unmet and could be potential opportunity, it identifies the potential for the Exporter (Country) among 190 countries, against the general trade analysis, which identifies the biggest importer or exporter.
To discover high-growth global markets and optimize your business strategy:
Click Here
Pricing
- Single User License$ 1,995
- Department License$ 2,400
- Site License$ 3,120
- Global License$ 3,795

Leadership Perspectives from Industry Events
Search
Thought Leadership and Analyst Meet


Our Clients
6WResearch In News
- India Air Conditioner Market Set for Strong Rebound in 2026 After Weather-Led Correction and GST-Driven Recovery: 6Wresearch
- ADAS in India: How Automatic Emergency Braking, Blind Spot Detection & Driver Monitoring are Transforming Road Safety
- Doha a strategic location for EV manufacturing hub: IPA Qatar
- Demand for luxury TVs surging in the GCC, says Samsung
- Empowering Growth: The Thriving Journey of Bangladesh’s Cable Industry
- Demand for luxury TVs surging in the GCC, says Samsung
Latest Reports
- Nicaragua RPG Gaming Market (2026-2032)
- New Zealand RPG Gaming Market (2026-2032)
- Netherlands RPG Gaming Market (2026-2032)
- Nauru RPG Gaming Market (2026-2032)
- Namibia RPG Gaming Market (2026-2032)
- Mozambique RPG Gaming Market (2026-2032)
- Montenegro RPG Gaming Market (2026-2032)
- Mongolia RPG Gaming Market (2026-2032)
- Monaco RPG Gaming Market (2026-2032)
- Micronesia RPG Gaming Market (2026-2032)
Industry Events and Analyst Meet

EV India Expo 2026

HIMTEX 2026

India Refining Summit 2026

India EV Show 2026

EV tech India Expo 2026
Whitepaper
- Middle East & Africa Commercial Security Market Click here to view more.
- Middle East & Africa Fire Safety Systems & Equipment Market Click here to view more.
- GCC Drone Market Click here to view more.
- Middle East Lighting Fixture Market Click here to view more.
- GCC Physical & Perimeter Security Market Click here to view more.