Lebanon Wine Market (2026-2032) | Trends, Analysis, COVID-19 IMPACT, Companies, Size, Forecast, Growth, Share, Outlook, Revenue, Value & Industry
Market Forecast By Product Types (Still Wine, Sparkling Wine, Dessert Wine, Fortified Wine), By Colors (Red Wine, Rose Wine, White Wine, Other Colors), By Distribution Channel (Offline , Online ) And Competitive Landscape
| Product Code: ETC018847 | Publication Date: Jun 2023 | Updated Date: Jun 2026 | Product Type: Report | |
| Publisher: 6Wresearch | Author: Ravi Bhandari | No. of Pages: 70 | No. of Figures: 35 | No. of Tables: 5 |
Lebanon Wine Market Summary
The lebanon wine market was estimated at USD 369 Million in 2025 and is projected to reach USD 501 Million by 2032, growing at a CAGR of 5.1% from 2026 to 2032.
Lebanon Wine Market Growth Rate Analysis (2021-2032)
The Lebanon wine market has shown stable growth, with yearly increases of 5.3% in both 2021 and 2022, reflecting robust consumer demand and a resurgence in tourism. This momentum continued into 2023 with a slight moderation to 5.0%, attributed to global economic conditions affecting discretionary spending. As the market adjusts, growth is expected to stabilize around 5.4% in 2027 and 5.5% in 2028, driven by investments in technology and infrastructure to enhance production efficiency and quality. However, fluctuations in growth rates are projected through 2029 and 2030, influenced by evolving consumer preferences and regional economic stability. By 2032, the market may again reach a growth rate of 5.4%, signaling a resilient demand for Lebanon's wine amidst a dynamic environment.
Lebanon Wine Market Year-wise Growth Rate and Key Drivers
This graph highlights how the Lebanon Wine Market has steadily grown over the past five years, supported by major growth factors.
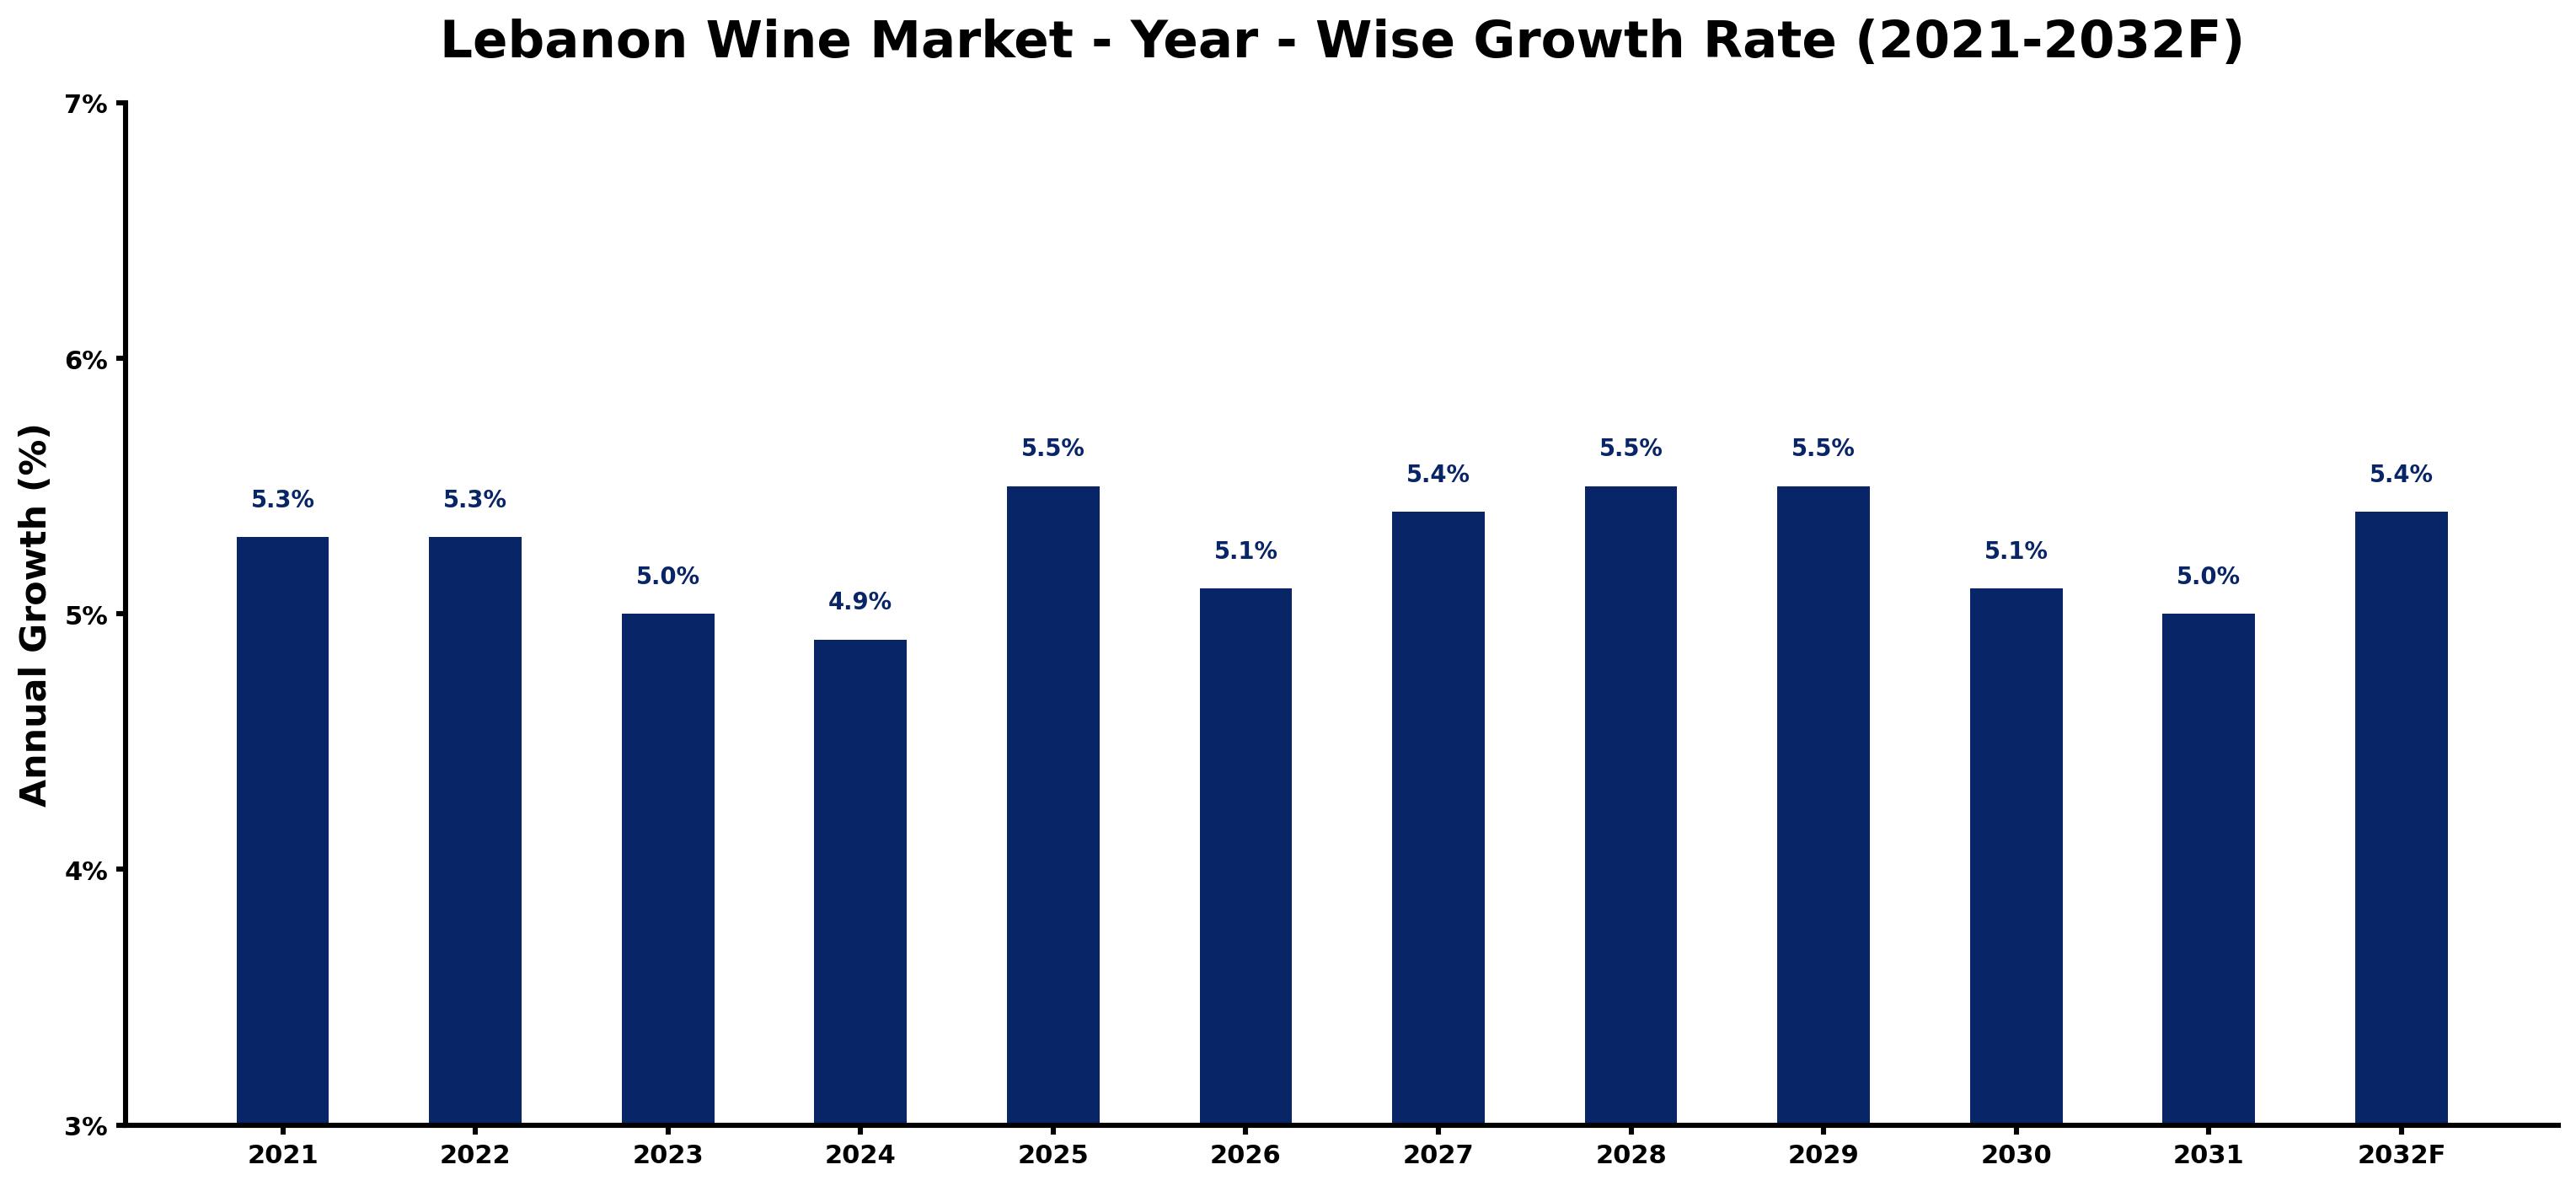
The table below presents the year wise growth rates along with the key drivers influencing the market
| Year | Growth Rate | Major Drivers |
| 2021 | 5.3% | Lebanon's wine industry sees a resurgence due to renewed international interest. |
| 2022 | 5.3% | Local vineyards improve production techniques, enhancing quality and consistency in wines. |
| 2023 | 5.0% | Tourism initiatives highlight Lebanon's unique wine culture, attracting global wine enthusiasts. |
| 2024 | 4.9% | Increased collaboration among winemakers fosters innovation and diverse product offerings. |
| 2025 | 5.5% | Emergence of boutique wineries captures young consumers seeking unique experiences. |
| 2026 | 5.1% | Lebanese wines gain recognition in international competitions, boosting export opportunities. |
| 2027 | 5.4% | Digital marketing strategies enhance brand visibility, engaging a broader audience online. |
| 2028 | 5.5% | Sustainable practices adopted by vineyards resonate with environmentally conscious consumers. |
| 2029 | 5.5% | Culinary tourism grows, integrating wine tastings with gastronomic experiences in Lebanon. |
| 2030 | 5.1% | Local grape varieties gain popularity, promoting cultural heritage within the wine sector. |
| 2031 | 5.0% | Investment in wine tourism infrastructure supports the growing number of international visitors. |
| 2032 | 5.4% | Innovative wine festivals emerge, celebrating Lebanon's diverse wine industry and traditions. |
Note - Market size estimations and growth projections presented in this report are based on 6Wresearch's advanced forecasting approach, validated with industry datasets as of June 2026.
Lebanon Wine Market Synopsis
The Lebanon Wine Market is projected to reach 5.1% and witness significant growth during the forecast period (2026-2032). This projected growth is underpinned by several key factors, including a rise in tourism, enhanced winemaking infrastructure, and increasing disposable incomes among consumers. Over recent years, Lebanon's wine production has been bolstered by investments from various stakeholders, aiming to elevate both domestic and export markets. The confluence of these elements is expected to cultivate a fertile environment for the Lebanon Wine Market to flourish in the years ahead.
Lebanon Wine Market Growth Drivers
The growth of the Lebanon Wine Market is primarily driven by an uptick in tourism, which fosters greater wine consumption. The following are pivotal growth drivers shaping this market:
- The influx of international tourists has led to increased sales of Lebanese wines, as visitors often seek to sample local products.
- Investments by both local and foreign companies have resulted in the establishment of new vineyards and upgrades to existing winemaking facilities, enhancing production capabilities.
- Growing disposable incomes among the Lebanese population are encouraging consumers to explore premium wine options, thereby boosting domestic consumption.
- Lebanon's distinctive terroir offers unique varietals that appeal to both local and international wine enthusiasts, driving demand for its wines.
- The improvement of distribution networks has facilitated better access to wine retailers and consumers, further enhancing market reach.
Lebanon Wine Market Trends and Opportunities
Several key trends and opportunities are emerging within the Lebanon Wine Market. These factors present promising avenues for growth and development:
- There is a growing interest in organic and biodynamic wines, creating opportunities for producers to differentiate their offerings and cater to health-conscious consumers.
- With the increasing popularity of wine tourism, more wineries are designing experiential offerings that entice visitors and create brand loyalty.
- Social media and digital marketing are becoming essential tools for winemakers to engage with consumers and promote their products, significantly affecting purchasing decisions.
- Strategic collaborations with restaurants and hotels to feature local wines can enhance brand visibility and drive sales.
- As global wine consumption continues to rise, there is a potential for Lebanese wines to carve a niche in international markets, enhancing export potential.
Lebanon Wine Market Challenges and Restraints
Despite the favorable outlook for the Lebanon Wine Market, several challenges could impede its growth trajectory:
- Stringent government regulations regarding the taxation of imported alcoholic beverages may deter foreign competition while impacting local producers adversely.
- The social stigma surrounding alcohol consumption in certain segments of Lebanese society could hinder broader market acceptance and growth.
- Political instability in the region presents risks that could affect tourism and, consequently, wine sales.
- Climate change poses potential threats to grape cultivation, necessitating adaptive practices that may not be immediately viable for all producers.
- Market saturation in certain segments may lead to heightened competition, creating price pressures that could affect profitability.
Lebanon Wine Market Government Investment and Initiatives
The government of Lebanon has recognized the potential of the wine sector as a vital component of the national economy and is actively implementing supportive initiatives. These include:
- Development plans focused on enhancing agricultural practices related to viticulture, aimed at improving grape quality and yield.
- Public spending initiatives directed towards infrastructure improvements that support the entire wine production process, from vineyard establishment to distribution.
- Incentives for winemakers to adopt sustainable practices, which align with global trends and enhance the appeal of Lebanese wines in international markets.
- Promotion of wine tourism as part of broader tourism strategies, which includes marketing campaigns to attract both local and international visitors.
- Collaboration with educational institutions to provide training and resources for aspiring winemakers and vineyard managers, ensuring a skilled workforce in the sector.
Lebanon Wine Market Latest Developments (May 2025 - June 2026)
In the period from May 2025 to June 2026, the Lebanon Wine Market has witnessed several noteworthy developments. The global appreciation for Lebanese wines has been bolstered by increased participation in international wine competitions, garnering accolades that enhance the country's reputation on the world stage. Additionally, various wineries have reported positive trends in their export activities, indicating a growing interest from overseas markets. Furthermore, numerous initiatives promoting wine tourism have emerged, with new vineyard tours and tasting experiences designed to engage both local and international visitors. Infrastructure improvements aimed at streamlining production and distribution processes have also been implemented, laying the groundwork for future growth in the sector. These developments underscore a dynamic landscape for the Lebanon Wine Market as stakeholders strive to capitalize on emerging opportunities.
Lebanon Wine Market - Key Attractiveness of the Report
- 10 Years of Market Numbers
- Historical Data Starting from 2022 to 2025
- Base Year: 2025
- Forecast Data until 2032
- Key Performance Indicators Impacting the Market
- Major Upcoming Developments and Projects
Key Highlights of the Report:
- Lebanon Wine Market Outlook
- Market Size of Lebanon Wine Market, 2025
- Forecast of Lebanon Wine Market, 2032F
- Historical Data and Forecast of Lebanon Wine Revenues & Volume for the Period 2022-2032F
- Lebanon Wine Market Trend Evolution
- Lebanon Wine Market Drivers and Challenges
- Lebanon Wine Price Trends
- Lebanon Wine Porter's Five Forces
- Lebanon Wine Industry Life Cycle
- Historical Data and Forecast of Lebanon Wine Market Revenues & Volume By Product Types for the Period 2022-2032F
- Historical Data and Forecast of Lebanon Wine Market Revenues & Volume By Still Wine for the Period 2022-2032F
- Historical Data and Forecast of Lebanon Wine Market Revenues & Volume By Sparkling Wine for the Period 2022-2032F
- Historical Data and Forecast of Lebanon Wine Market Revenues & Volume By Dessert Wine for the Period 2022-2032F
- Historical Data and Forecast of Lebanon Wine Market Revenues & Volume By Fortified Wine for the Period 2022-2032F
- Historical Data and Forecast of Lebanon Wine Market Revenues & Volume By Colors for the Period 2022-2032F
- Historical Data and Forecast of Lebanon Wine Market Revenues & Volume By Red Wine for the Period 2022-2032F
- Historical Data and Forecast of Lebanon Wine Market Revenues & Volume By Rose Wine for the Period 2022-2032F
- Historical Data and Forecast of Lebanon Wine Market Revenues & Volume By White Wine for the Period 2022-2032F
- Historical Data and Forecast of Lebanon Wine Market Revenues & Volume By Other Colors for the Period 2022-2032F
- Historical Data and Forecast of Lebanon Wine Market Revenues & Volume By Distribution Channel for the Period 2022-2032F
- Historical Data and Forecast of Lebanon Wine Market Revenues & Volume By Offline for the Period 2022-2032F
- Historical Data and Forecast of Lebanon Wine Market Revenues & Volume By Online for the Period 2022-2032F
- Lebanon Wine Import Export Trade Statistics
- Market Opportunity Assessment By Product Types
- Market Opportunity Assessment By Colors
- Market Opportunity Assessment By Distribution Channel
- Lebanon Wine Top Companies Market Share
- Lebanon Wine Competitive Benchmarking By Technical and Operational Parameters
- Lebanon Wine Company Profiles
- Lebanon Wine Key Strategic Recommendations
Frequently Asked Questions About the Market Study (FAQs):
The Lebanon Wine Market is anticipated to witness a compound annual growth rate (CAGR) of 2.8% during the forecast period of 2026-2032.
The primary factors include increased tourism, enhanced winemaking infrastructure, and rising disposable incomes among consumers, along with the remarkable quality of Lebanese wines.
Yes, challenges including stringent government regulations, social stigma around alcohol consumption, and potential political instability could impact market growth.
The government is investing in infrastructure improvements, promoting wine tourism, providing incentives for sustainable practices, and enhancing agricultural practices in viticulture.
6Wresearch actively monitors the Lebanon Wine Market and publishes its comprehensive annual report, highlighting emerging trends, growth drivers, revenue analysis, and forecast outlook. Our insights help businesses to make data-backed strategic decisions with ongoing market dynamics. Our analysts track relevent industries related to the Lebanon Wine Market, allowing our clients with actionable intelligence and reliable forecasts tailored to emerging regional needs.
Yes, we provide customisation as per your requirements. To learn more, feel free to contact us on sales@6wresearch.com
1 Executive Summary |
2 Introduction |
2.1 Key Highlights of the Report |
2.2 Report Description |
2.3 Market Scope & Segmentation |
2.4 Research Methodology |
2.5 Assumptions |
3 Lebanon Wine Market Overview |
3.1 Lebanon Country Macro Economic Indicators |
3.2 Lebanon Wine Market Revenues & Volume, 2022 & 2032F |
3.3 Lebanon Wine Market - Industry Life Cycle |
3.4 Lebanon Wine Market - Porter's Five Forces |
3.5 Lebanon Wine Market Revenues & Volume Share, By Product Types, 2022 & 2032F |
3.6 Lebanon Wine Market Revenues & Volume Share, By Colors, 2022 & 2032F |
3.7 Lebanon Wine Market Revenues & Volume Share, By Distribution Channel, 2022 & 2032F |
4 Lebanon Wine Market Dynamics |
4.1 Impact Analysis |
4.2 Market Drivers |
4.3 Market Restraints |
5 Lebanon Wine Market Trends |
6 Lebanon Wine Market, By Types |
6.1 Lebanon Wine Market, By Product Types |
6.1.1 Overview and Analysis |
6.1.2 Lebanon Wine Market Revenues & Volume, By Product Types, 2022-2032F |
6.1.3 Lebanon Wine Market Revenues & Volume, By Still Wine, 2022-2032F |
6.1.4 Lebanon Wine Market Revenues & Volume, By Sparkling Wine, 2022-2032F |
6.1.5 Lebanon Wine Market Revenues & Volume, By Dessert Wine, 2022-2032F |
6.1.6 Lebanon Wine Market Revenues & Volume, By Fortified Wine, 2022-2032F |
6.2 Lebanon Wine Market, By Colors |
6.2.1 Overview and Analysis |
6.2.2 Lebanon Wine Market Revenues & Volume, By Red Wine, 2022-2032F |
6.2.3 Lebanon Wine Market Revenues & Volume, By Rose Wine, 2022-2032F |
6.2.4 Lebanon Wine Market Revenues & Volume, By White Wine, 2022-2032F |
6.2.5 Lebanon Wine Market Revenues & Volume, By Other Colors, 2022-2032F |
6.3 Lebanon Wine Market, By Distribution Channel |
6.3.1 Overview and Analysis |
6.3.2 Lebanon Wine Market Revenues & Volume, By Offline , 2022-2032F |
6.3.3 Lebanon Wine Market Revenues & Volume, By Online , 2022-2032F |
7 Lebanon Wine Market Import-Export Trade Statistics |
7.1 Lebanon Wine Market Export to Major Countries |
7.2 Lebanon Wine Market Imports from Major Countries |
8 Lebanon Wine Market Key Performance Indicators |
9 Lebanon Wine Market - Opportunity Assessment |
9.1 Lebanon Wine Market Opportunity Assessment, By Product Types, 2022 & 2032F |
9.2 Lebanon Wine Market Opportunity Assessment, By Colors, 2022 & 2032F |
9.3 Lebanon Wine Market Opportunity Assessment, By Distribution Channel, 2022 & 2032F |
10 Lebanon Wine Market - Competitive Landscape |
10.1 Lebanon Wine Market Revenue Share, By Companies, 2025 |
10.2 Lebanon Wine Market Competitive Benchmarking, By Operating and Technical Parameters |
11 Company Profiles |
12 Recommendations |
13 Disclaimer |
Global Go To Market Strategy - 2030
Export potential enables firms to identify high-growth global markets with greater confidence by combining advanced trade intelligence with a structured quantitative methodology. The framework analyzes emerging demand trends and country-level import patterns while integrating macroeconomic and trade datasets such as GDP and population forecasts, bilateral import–export flows, tariff structures, elasticity differentials between developed and developing economies, geographic distance, and import demand projections. Using weighted trade values from 2020–2024 as the base period to project country-to-country export potential for 2030, these inputs are operationalized through calculated drivers such as gravity model parameters, tariff impact factors, and projected GDP per-capita growth. Through an analysis of hidden potentials, demand hotspots, and market conditions that are most favorable to success, this method enables firms to focus on target countries, maximize returns, and global expansion with data, backed by accuracy.
By factoring in the projected importer demand gap that is currently unmet and could be potential opportunity, it identifies the potential for the Exporter (Country) among 190 countries, against the general trade analysis, which identifies the biggest importer or exporter.
To discover high-growth global markets and optimize your business strategy:
Click Here
Pricing
- Single User License$ 1,995
- Department License$ 2,400
- Site License$ 3,120
- Global License$ 3,795

Leadership Perspectives from Industry Events
Search
Thought Leadership and Analyst Meet


Our Clients
6WResearch In News
- India Air Conditioner Market Set for Strong Rebound in 2026 After Weather-Led Correction and GST-Driven Recovery: 6Wresearch
- ADAS in India: How Automatic Emergency Braking, Blind Spot Detection & Driver Monitoring are Transforming Road Safety
- Doha a strategic location for EV manufacturing hub: IPA Qatar
- Demand for luxury TVs surging in the GCC, says Samsung
- Empowering Growth: The Thriving Journey of Bangladesh’s Cable Industry
- Demand for luxury TVs surging in the GCC, says Samsung
Latest Reports
- Poland Fire Protection Systems Market (2026-2032)
- Cape Verde Portable Hand-Thrown Extinguisher Market (2026-2032)
- Canada Portable Hand-Thrown Extinguisher Market (2026-2032)
- Cameroon Portable Hand-Thrown Extinguisher Market (2026-2032)
- Burundi Portable Hand-Thrown Extinguisher Market (2026-2032)
- Burkina Faso Portable Hand-Thrown Extinguisher Market (2026-2032)
- Bulgaria Portable Hand-Thrown Extinguisher Market (2026-2032)
- Brunei Portable Hand-Thrown Extinguisher Market (2026-2032)
- Botswana Portable Hand-Thrown Extinguisher Market (2026-2032)
- Bosnia and Herzegovina Portable Hand-Thrown Extinguisher Market (2026-2032)
Industry Events and Analyst Meet

HIMTEX 2026

India Refining Summit 2026

India EV Show 2026

EV tech India Expo 2026

Auto Tech Asia 2026
Whitepaper
- Middle East & Africa Commercial Security Market Click here to view more.
- Middle East & Africa Fire Safety Systems & Equipment Market Click here to view more.
- GCC Drone Market Click here to view more.
- Middle East Lighting Fixture Market Click here to view more.
- GCC Physical & Perimeter Security Market Click here to view more.