Lithuania Antifreeze/Coolant Market (2026-2032) | Companies, Analysis, Forecast, Trends, Value, Growth, Industry, Segmentation, Size, Outlook, Share & Revenue
Market Forecast By Application (Automotive, Industrial), By Base Fluid (Ethylene Glycol, Propylene Glycol , Glycerine), By Technology (OAT, HOAT, IAT) And Competitive Landscape
| Product Code: ETC5670894 | Publication Date: Nov 2023 | Updated Date: Apr 2026 | Product Type: Market Research Report | |
| Publisher: 6Wresearch | Author: Ravi Bhandari | No. of Pages: 60 | No. of Figures: 30 | No. of Tables: 5 |
Lithuania Antifreeze/Coolant Market Size (2020-2030)
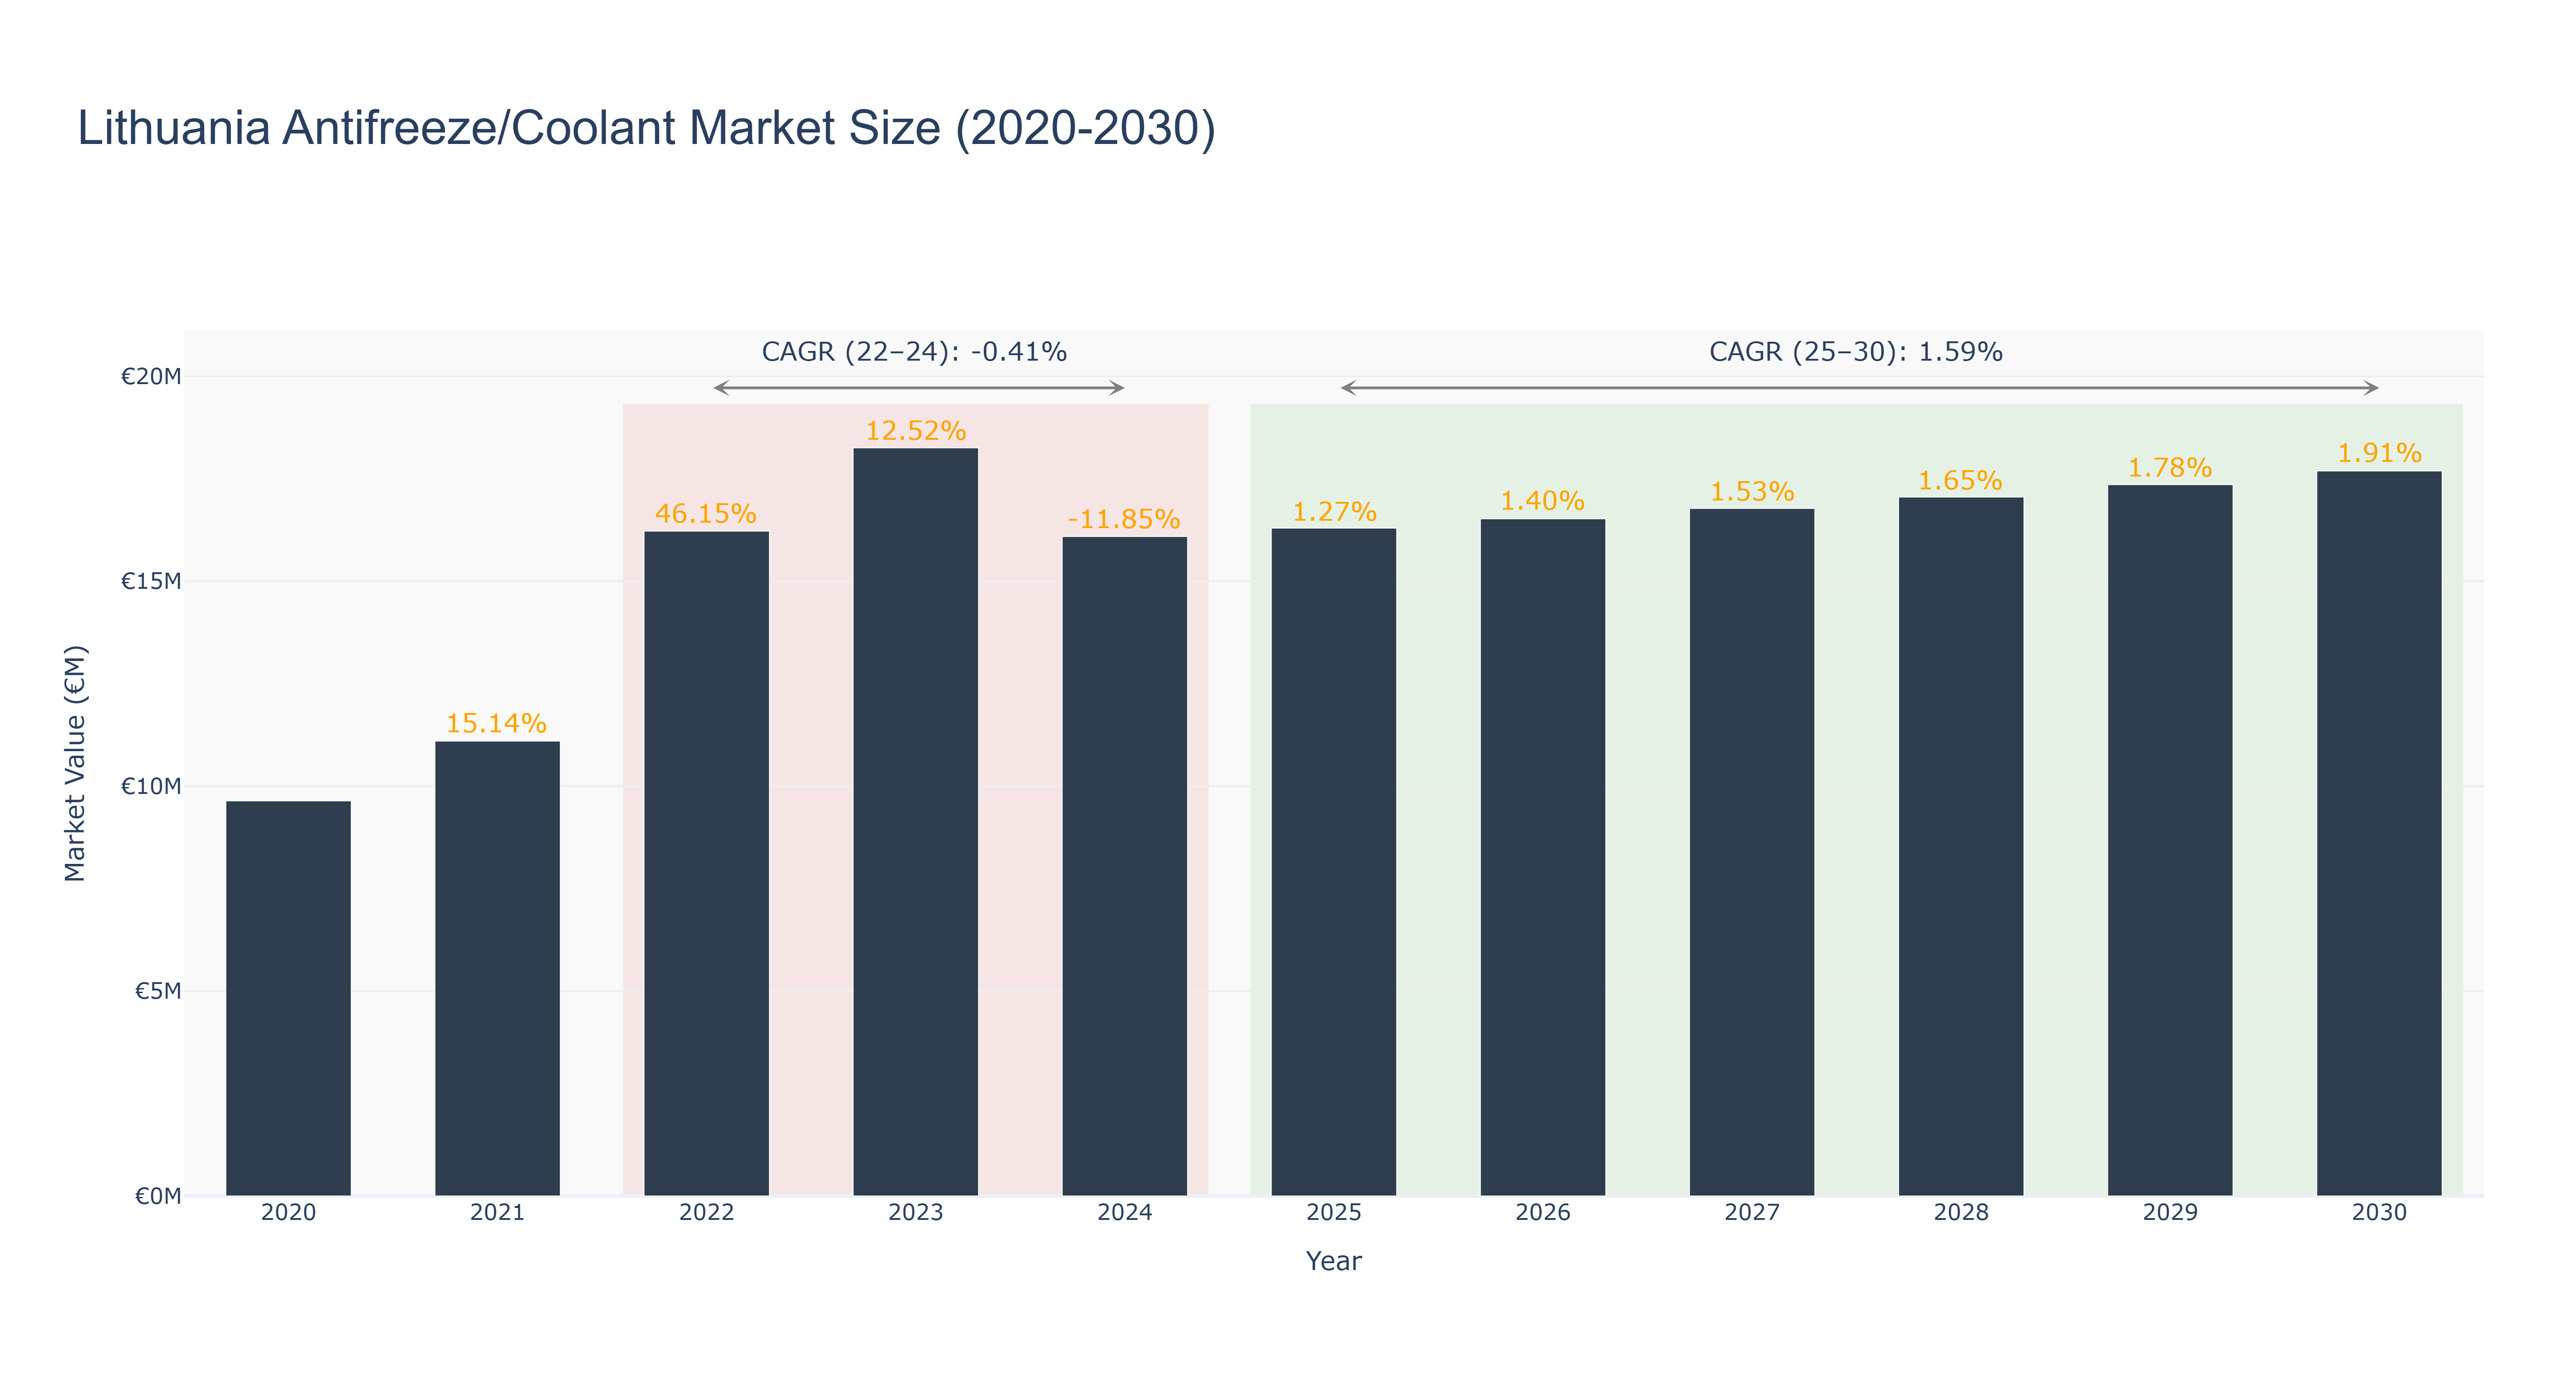
The Lithuania Antifreeze/Coolant Market has shown a fluctuating trend in recent years. The peak market size was €18.26 million in 2023, with a subsequent decline to €16.09 million in 2024. However, the market has since stabilized and is forecasted to grow steadily, reaching an estimated €17.69 million by 2030. The CAGR for the period 2022-24 was -0.41%, reflecting a temporary setback, while the CAGR for 2025-30 is projected at 1.59%, indicating a gradual recovery and growth trajectory. Industry drivers such as increasing vehicle ownership and maintenance needs are expected to support market expansion. Looking ahead, upcoming infrastructure projects in Lithuania, including the development of new automotive manufacturing facilities, are poised to further boost demand for antifreeze and coolant products in the country.
Lithuania Antifreeze/Coolant Market: Production & Trade Performance (2019-2025)
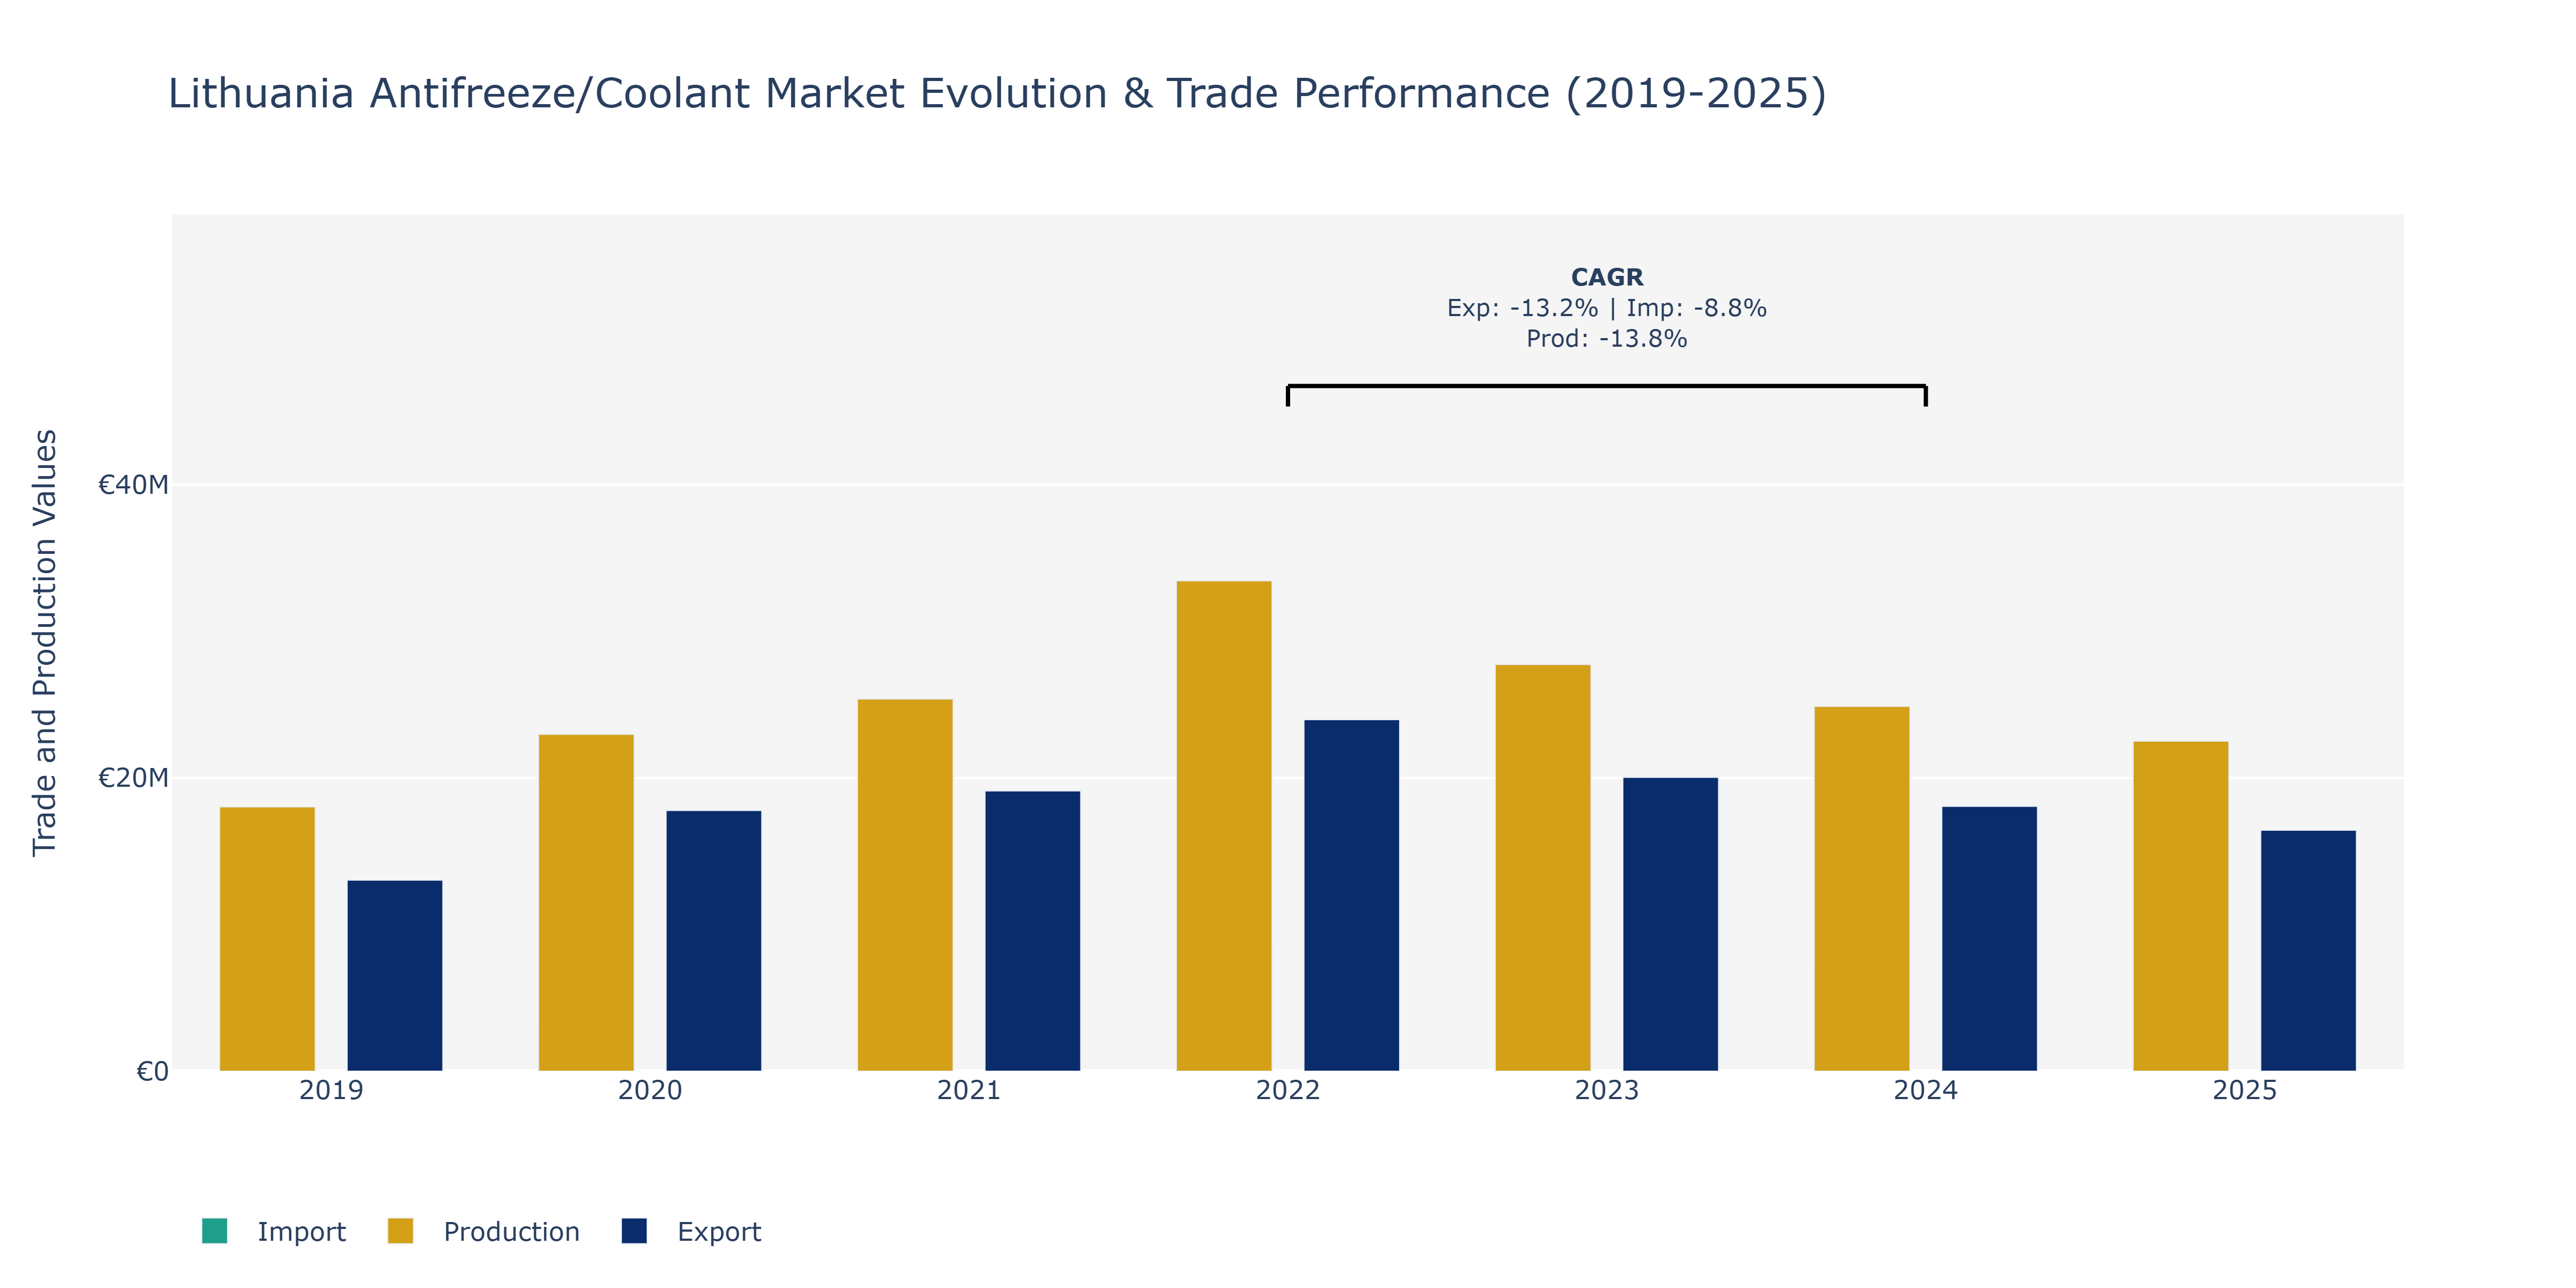
Between 2019 and 2025, the Lithuania Antifreeze/Coolant Market witnessed diverse trends across exports, imports, and production. Exports showed a fluctuating pattern, reaching a peak of €23.98 million in 2022 before declining to €16.43 million in 2025. In contrast, imports followed a similar trajectory, peaking at €8.29 million in 2022 and then decreasing to €6.52 million in 2025. Production levels also experienced fluctuations, with a peak of €33.45 million in 2022 and a low of €22.51 million in 2025. These variations can be attributed to factors such as shifts in global demand for antifreeze products, changes in manufacturing technologies, and fluctuations in raw material prices. The decline in production and export numbers from 2022 to 2025 could be influenced by evolving environmental regulations promoting the use of more sustainable coolant solutions, leading manufacturers to adjust their production and trade strategies accordingly.
Key Highlights of the Report:
- Lithuania Antifreeze/Coolant Market Outlook
- Market Size of Lithuania Antifreeze/Coolant Market, 2025
- Forecast of Lithuania Antifreeze/Coolant Market, 2032
- Historical Data and Forecast of Lithuania Antifreeze/Coolant Revenues & Volume for the Period 2022 - 2032F
- Lithuania Antifreeze/Coolant Market Trend Evolution
- Lithuania Antifreeze/Coolant Market Drivers and Challenges
- Lithuania Antifreeze/Coolant Price Trends
- Lithuania Antifreeze/Coolant Porter`s Five Forces
- Lithuania Antifreeze/Coolant Industry Life Cycle
- Historical Data and Forecast of Lithuania Antifreeze/Coolant Market Revenues & Volume By Application for the Period 2022 - 2032F
- Historical Data and Forecast of Lithuania Antifreeze/Coolant Market Revenues & Volume By Automotive for the Period 2022 - 2032F
- Historical Data and Forecast of Lithuania Antifreeze/Coolant Market Revenues & Volume By Industrial for the Period 2022 - 2032F
- Historical Data and Forecast of Lithuania Antifreeze/Coolant Market Revenues & Volume By Base Fluid for the Period 2022 - 2032F
- Historical Data and Forecast of Lithuania Antifreeze/Coolant Market Revenues & Volume By Ethylene Glycol for the Period 2022 - 2032F
- Historical Data and Forecast of Lithuania Antifreeze/Coolant Market Revenues & Volume By Propylene Glycol for the Period 2022 - 2032F
- Historical Data and Forecast of Lithuania Antifreeze/Coolant Market Revenues & Volume By Glycerine for the Period 2022 - 2032F
- Historical Data and Forecast of Lithuania Antifreeze/Coolant Market Revenues & Volume By Technology for the Period 2022 - 2032F
- Historical Data and Forecast of Lithuania Antifreeze/Coolant Market Revenues & Volume By OAT for the Period 2022 - 2032F
- Historical Data and Forecast of Lithuania Antifreeze/Coolant Market Revenues & Volume By HOAT for the Period 2022 - 2032F
- Historical Data and Forecast of Lithuania Antifreeze/Coolant Market Revenues & Volume By IAT for the Period 2022 - 2032F
- Lithuania Antifreeze/Coolant Import Export Trade Statistics
- Market Opportunity Assessment By Application
- Market Opportunity Assessment By Base Fluid
- Market Opportunity Assessment By Technology
- Lithuania Antifreeze/Coolant Top Companies Market Share
- Lithuania Antifreeze/Coolant Competitive Benchmarking By Technical and Operational Parameters
- Lithuania Antifreeze/Coolant Company Profiles
- Lithuania Antifreeze/Coolant Key Strategic Recommendations
Frequently Asked Questions About the Market Study (FAQs):
6Wresearch actively monitors the Lithuania Antifreeze/Coolant Market and publishes its comprehensive annual report, highlighting emerging trends, growth drivers, revenue analysis, and forecast outlook. Our insights help businesses to make data-backed strategic decisions with ongoing market dynamics. Our analysts track relevent industries related to the Lithuania Antifreeze/Coolant Market, allowing our clients with actionable intelligence and reliable forecasts tailored to emerging regional needs.
Yes, we provide customisation as per your requirements. To learn more, feel free to contact us on sales@6wresearch.com
1 Executive Summary |
2 Introduction |
2.1 Key Highlights of the Report |
2.2 Report Description |
2.3 Market Scope & Segmentation |
2.4 Research Methodology |
2.5 Assumptions |
3 Lithuania Antifreeze/Coolant Market Overview |
3.1 Lithuania Country Macro Economic Indicators |
3.2 Lithuania Antifreeze/Coolant Market Revenues & Volume, 2022 & 2032F |
3.3 Lithuania Antifreeze/Coolant Market - Industry Life Cycle |
3.4 Lithuania Antifreeze/Coolant Market - Porter's Five Forces |
3.5 Lithuania Antifreeze/Coolant Market Revenues & Volume Share, By Application, 2022 & 2032F |
3.6 Lithuania Antifreeze/Coolant Market Revenues & Volume Share, By Base Fluid, 2022 & 2032F |
3.7 Lithuania Antifreeze/Coolant Market Revenues & Volume Share, By Technology, 2022 & 2032F |
4 Lithuania Antifreeze/Coolant Market Dynamics |
4.1 Impact Analysis |
4.2 Market Drivers |
4.2.1 Increasing demand for automobiles in Lithuania |
4.2.2 Growing awareness about the importance of vehicle maintenance |
4.2.3 Stringent regulations regarding vehicle emissions and environmental protection |
4.3 Market Restraints |
4.3.1 Fluctuating raw material prices |
4.3.2 Intense competition from alternative cooling technologies |
4.3.3 Economic uncertainty impacting consumer spending on vehicle maintenance |
5 Lithuania Antifreeze/Coolant Market Trends |
6 Lithuania Antifreeze/Coolant Market Segmentations |
6.1 Lithuania Antifreeze/Coolant Market, By Application |
6.1.1 Overview and Analysis |
6.1.2 Lithuania Antifreeze/Coolant Market Revenues & Volume, By Automotive, 2022 - 2032F |
6.1.3 Lithuania Antifreeze/Coolant Market Revenues & Volume, By Industrial, 2022 - 2032F |
6.2 Lithuania Antifreeze/Coolant Market, By Base Fluid |
6.2.1 Overview and Analysis |
6.2.2 Lithuania Antifreeze/Coolant Market Revenues & Volume, By Ethylene Glycol, 2022 - 2032F |
6.2.3 Lithuania Antifreeze/Coolant Market Revenues & Volume, By Propylene Glycol , 2022 - 2032F |
6.2.4 Lithuania Antifreeze/Coolant Market Revenues & Volume, By Glycerine, 2022 - 2032F |
6.3 Lithuania Antifreeze/Coolant Market, By Technology |
6.3.1 Overview and Analysis |
6.3.2 Lithuania Antifreeze/Coolant Market Revenues & Volume, By OAT, 2022 - 2032F |
6.3.3 Lithuania Antifreeze/Coolant Market Revenues & Volume, By HOAT, 2022 - 2032F |
6.3.4 Lithuania Antifreeze/Coolant Market Revenues & Volume, By IAT, 2022 - 2032F |
7 Lithuania Antifreeze/Coolant Market Import-Export Trade Statistics |
7.1 Lithuania Antifreeze/Coolant Market Export to Major Countries |
7.2 Lithuania Antifreeze/Coolant Market Imports from Major Countries |
8 Lithuania Antifreeze/Coolant Market Key Performance Indicators |
8.1 Average age of vehicles in Lithuania |
8.2 Number of vehicle registrations in the country |
8.3 Environmental regulations compliance rate |
9 Lithuania Antifreeze/Coolant Market - Opportunity Assessment |
9.1 Lithuania Antifreeze/Coolant Market Opportunity Assessment, By Application, 2022 & 2032F |
9.2 Lithuania Antifreeze/Coolant Market Opportunity Assessment, By Base Fluid, 2022 & 2032F |
9.3 Lithuania Antifreeze/Coolant Market Opportunity Assessment, By Technology, 2022 & 2032F |
10 Lithuania Antifreeze/Coolant Market - Competitive Landscape |
10.1 Lithuania Antifreeze/Coolant Market Revenue Share, By Companies, 2025 |
10.2 Lithuania Antifreeze/Coolant Market Competitive Benchmarking, By Operating and Technical Parameters |
11 Company Profiles |
12 Recommendations | 13 Disclaimer |
Global Go To Market Strategy - 2030
Export potential enables firms to identify high-growth global markets with greater confidence by combining advanced trade intelligence with a structured quantitative methodology. The framework analyzes emerging demand trends and country-level import patterns while integrating macroeconomic and trade datasets such as GDP and population forecasts, bilateral import–export flows, tariff structures, elasticity differentials between developed and developing economies, geographic distance, and import demand projections. Using weighted trade values from 2020–2024 as the base period to project country-to-country export potential for 2030, these inputs are operationalized through calculated drivers such as gravity model parameters, tariff impact factors, and projected GDP per-capita growth. Through an analysis of hidden potentials, demand hotspots, and market conditions that are most favorable to success, this method enables firms to focus on target countries, maximize returns, and global expansion with data, backed by accuracy.
By factoring in the projected importer demand gap that is currently unmet and could be potential opportunity, it identifies the potential for the Exporter (Country) among 190 countries, against the general trade analysis, which identifies the biggest importer or exporter.
To discover high-growth global markets and optimize your business strategy:
Click Here
Pricing
- Single User License$ 1,995
- Department License$ 2,400
- Site License$ 3,120
- Global License$ 3,795

Leadership Perspectives from Industry Events
Search
Thought Leadership and Analyst Meet


Our Clients
6WResearch In News
- Doha a strategic location for EV manufacturing hub: IPA Qatar
- Demand for luxury TVs surging in the GCC, says Samsung
- Empowering Growth: The Thriving Journey of Bangladesh’s Cable Industry
- Demand for luxury TVs surging in the GCC, says Samsung
- Video call with a traditional healer? Once unthinkable, it’s now common in South Africa
- Intelligent Buildings To Smooth GCC’s Path To Net Zero
Latest Reports
- Cape Verde Portable Hand-Thrown Extinguisher Market (2026-2032)
- Canada Portable Hand-Thrown Extinguisher Market (2026-2032)
- Cameroon Portable Hand-Thrown Extinguisher Market (2026-2032)
- Burundi Portable Hand-Thrown Extinguisher Market (2026-2032)
- Burkina Faso Portable Hand-Thrown Extinguisher Market (2026-2032)
- Bulgaria Portable Hand-Thrown Extinguisher Market (2026-2032)
- Brunei Portable Hand-Thrown Extinguisher Market (2026-2032)
- Botswana Portable Hand-Thrown Extinguisher Market (2026-2032)
- Bosnia and Herzegovina Portable Hand-Thrown Extinguisher Market (2026-2032)
- Bolivia Portable Hand-Thrown Extinguisher Market (2026-2032)
Industry Events and Analyst Meet

HIMTEX 2026

India Refining Summit 2026

India EV Show 2026

EV tech India Expo 2026

Auto Tech Asia 2026
Whitepaper
- Middle East & Africa Commercial Security Market Click here to view more.
- Middle East & Africa Fire Safety Systems & Equipment Market Click here to view more.
- GCC Drone Market Click here to view more.
- Middle East Lighting Fixture Market Click here to view more.
- GCC Physical & Perimeter Security Market Click here to view more.