Lithuania Captive Power Plant Market (2026-2032) | Analysis, Industry, Share, Competitive Landscape, Value, Segmentation, Trends, Size & Revenue, Growth, Companies, Forecast, Outlook
Market Forecast By Fuel Source (Coal, Gas, Diesel, Renewable, Other Fuel Sources), By Industry (Cement, Steel, Metal & Minerals, Petrochemicals) And Competitive Landscape
| Product Code: ETC8036647 | Publication Date: Sep 2024 | Updated Date: Apr 2026 | Product Type: Market Research Report | |
| Publisher: 6Wresearch | Author: Sumit Sagar | No. of Pages: 75 | No. of Figures: 35 | No. of Tables: 20 |
Lithuania Captive Power Plant Market Size (2020-2030)
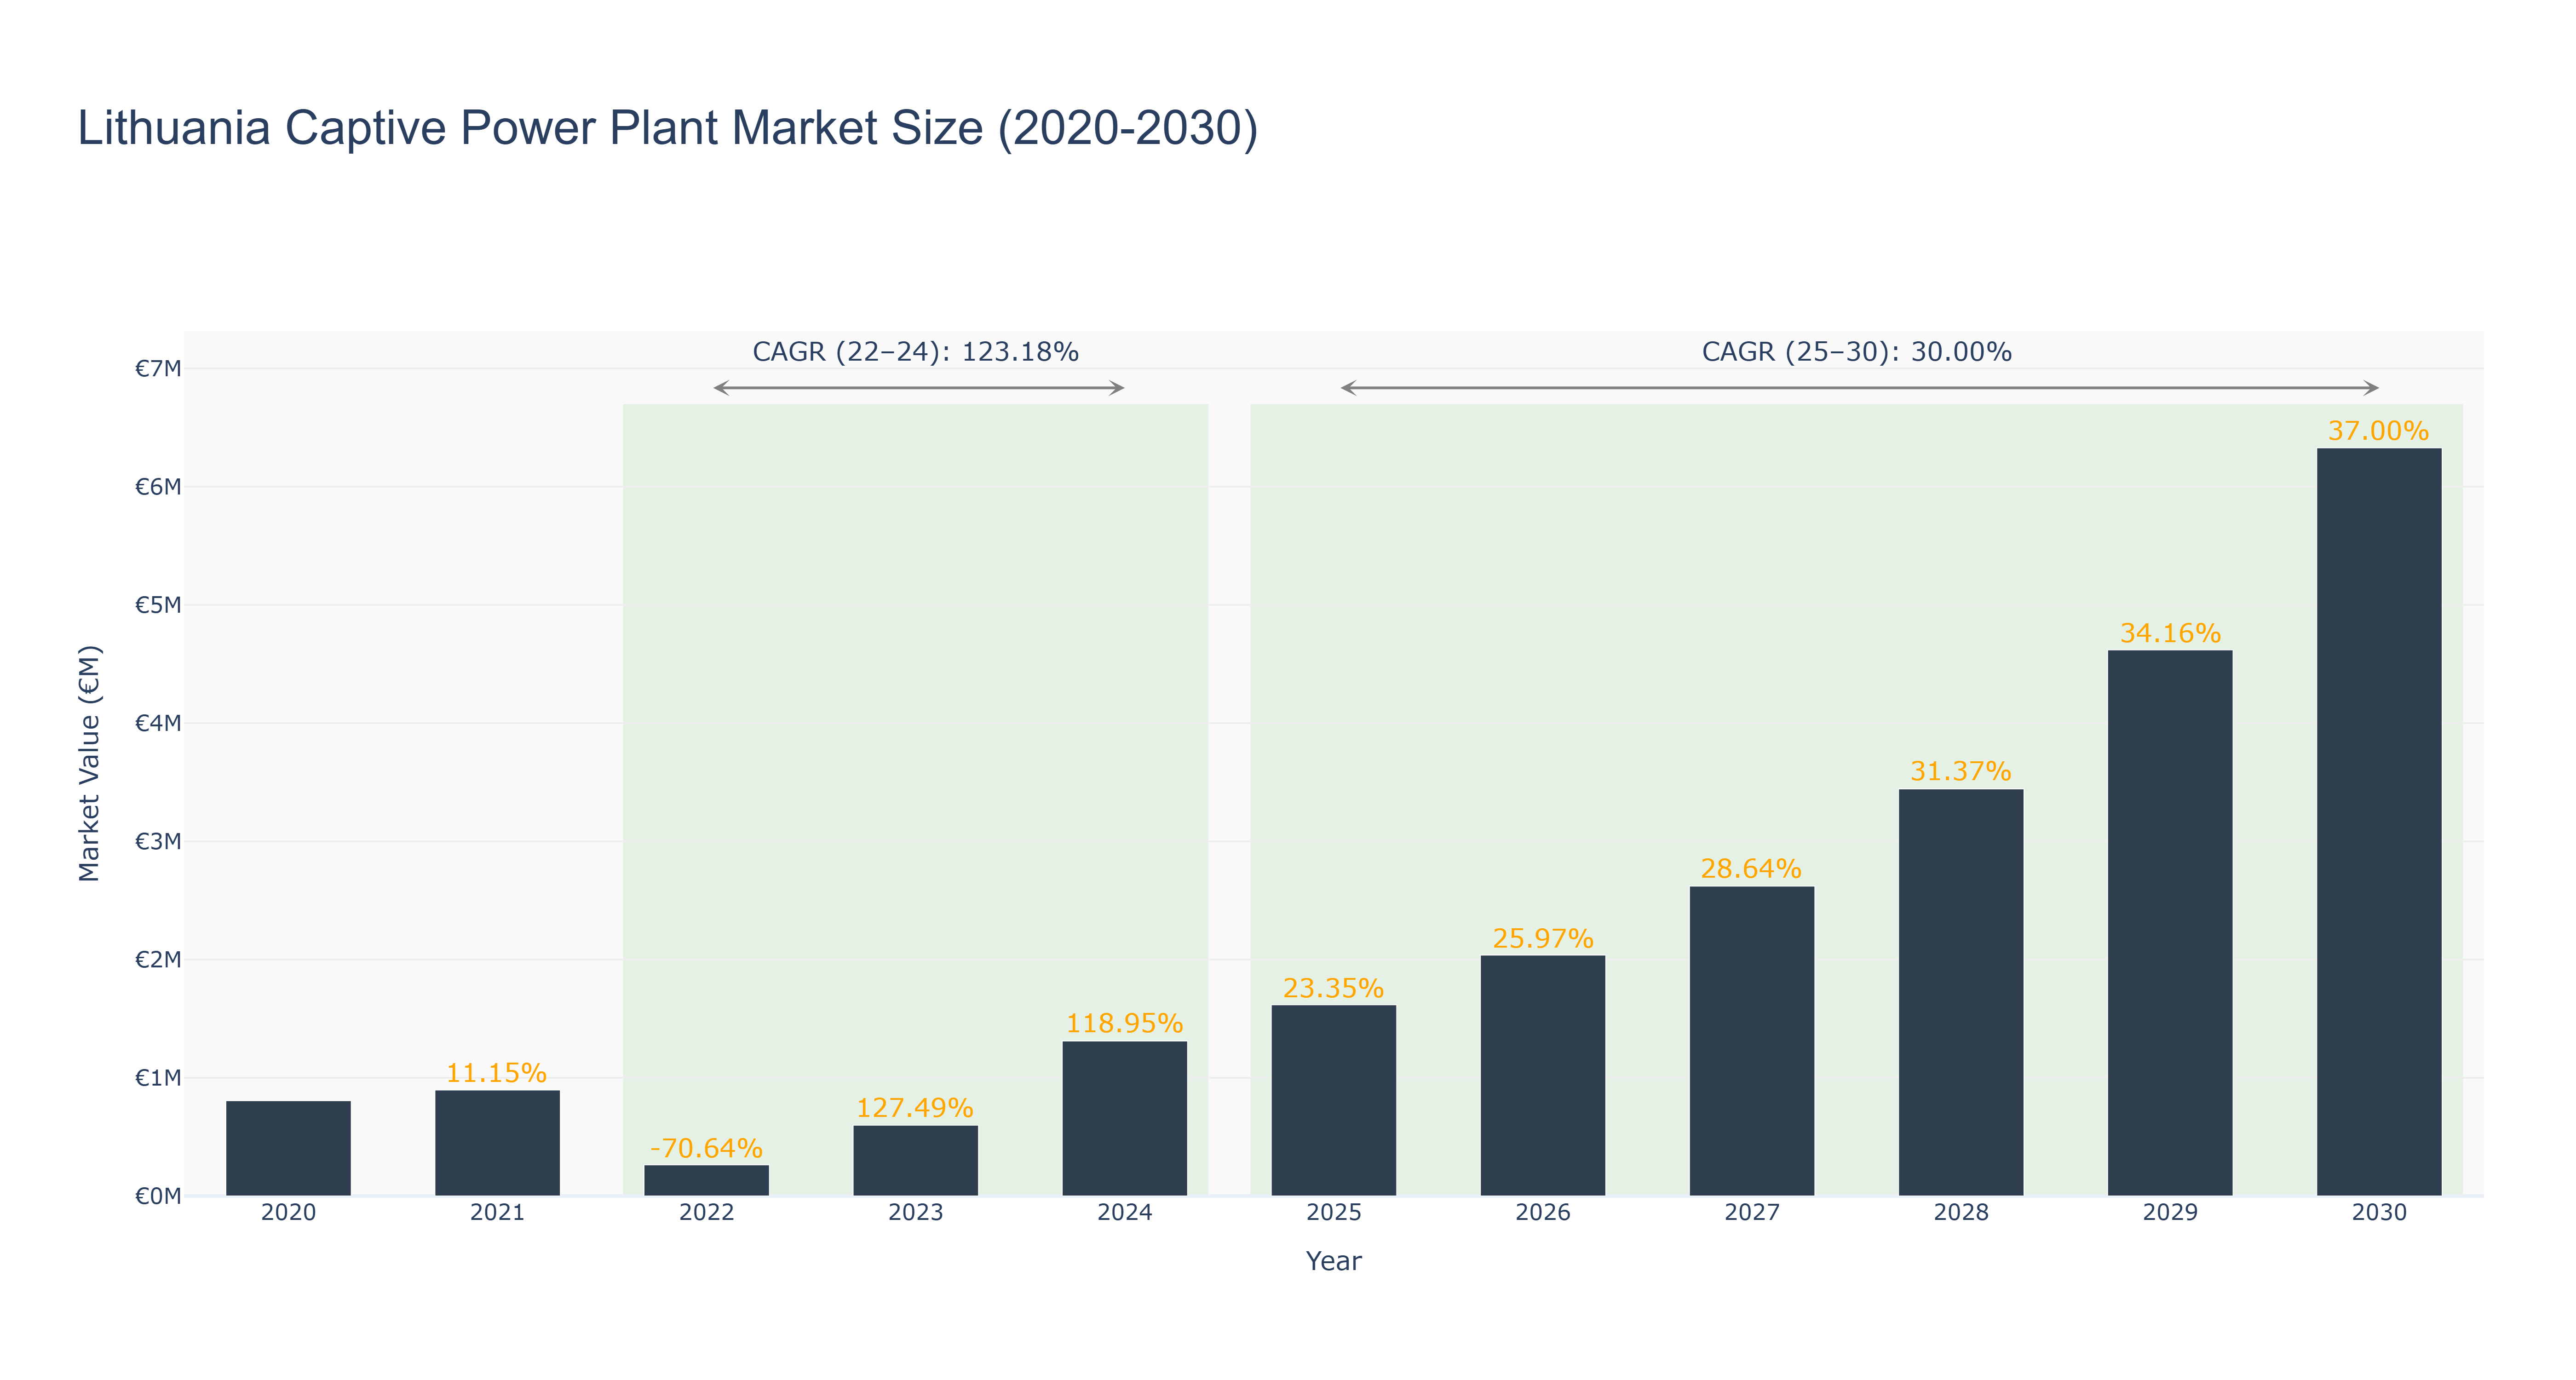
The Lithuania Captive Power Plant Market has shown significant growth over the years. The peak market size was €6.33 million in 2030, with a strong CAGR of 30.0% from 2025 to 2030. The actual market size saw a notable increase from €0.81 million in 2020 to €1.62 million in 2025. The forecasted market size is expected to continue its upward trajectory, driven by increasing demand for captive power solutions in the region. The market experienced a sharp decline in 2022 due to certain regulatory challenges, but quickly recovered and maintained steady growth thereafter. Recent developments include partnerships with renewable energy providers to enhance sustainability practices, while future projects focus on expanding capacity to meet growing energy needs in Lithuania. Industry drivers include the shift towards cleaner energy sources, government incentives for renewable energy projects, and the need for reliable power supply in industrial sectors. Looking ahead, the Lithuania Captive Power Plant Market is poised for further expansion through strategic collaborations and infrastructure investments to support the country's energy goals.
Lithuania Captive Power Plant Market: Production & Trade Performance (2019-2025)
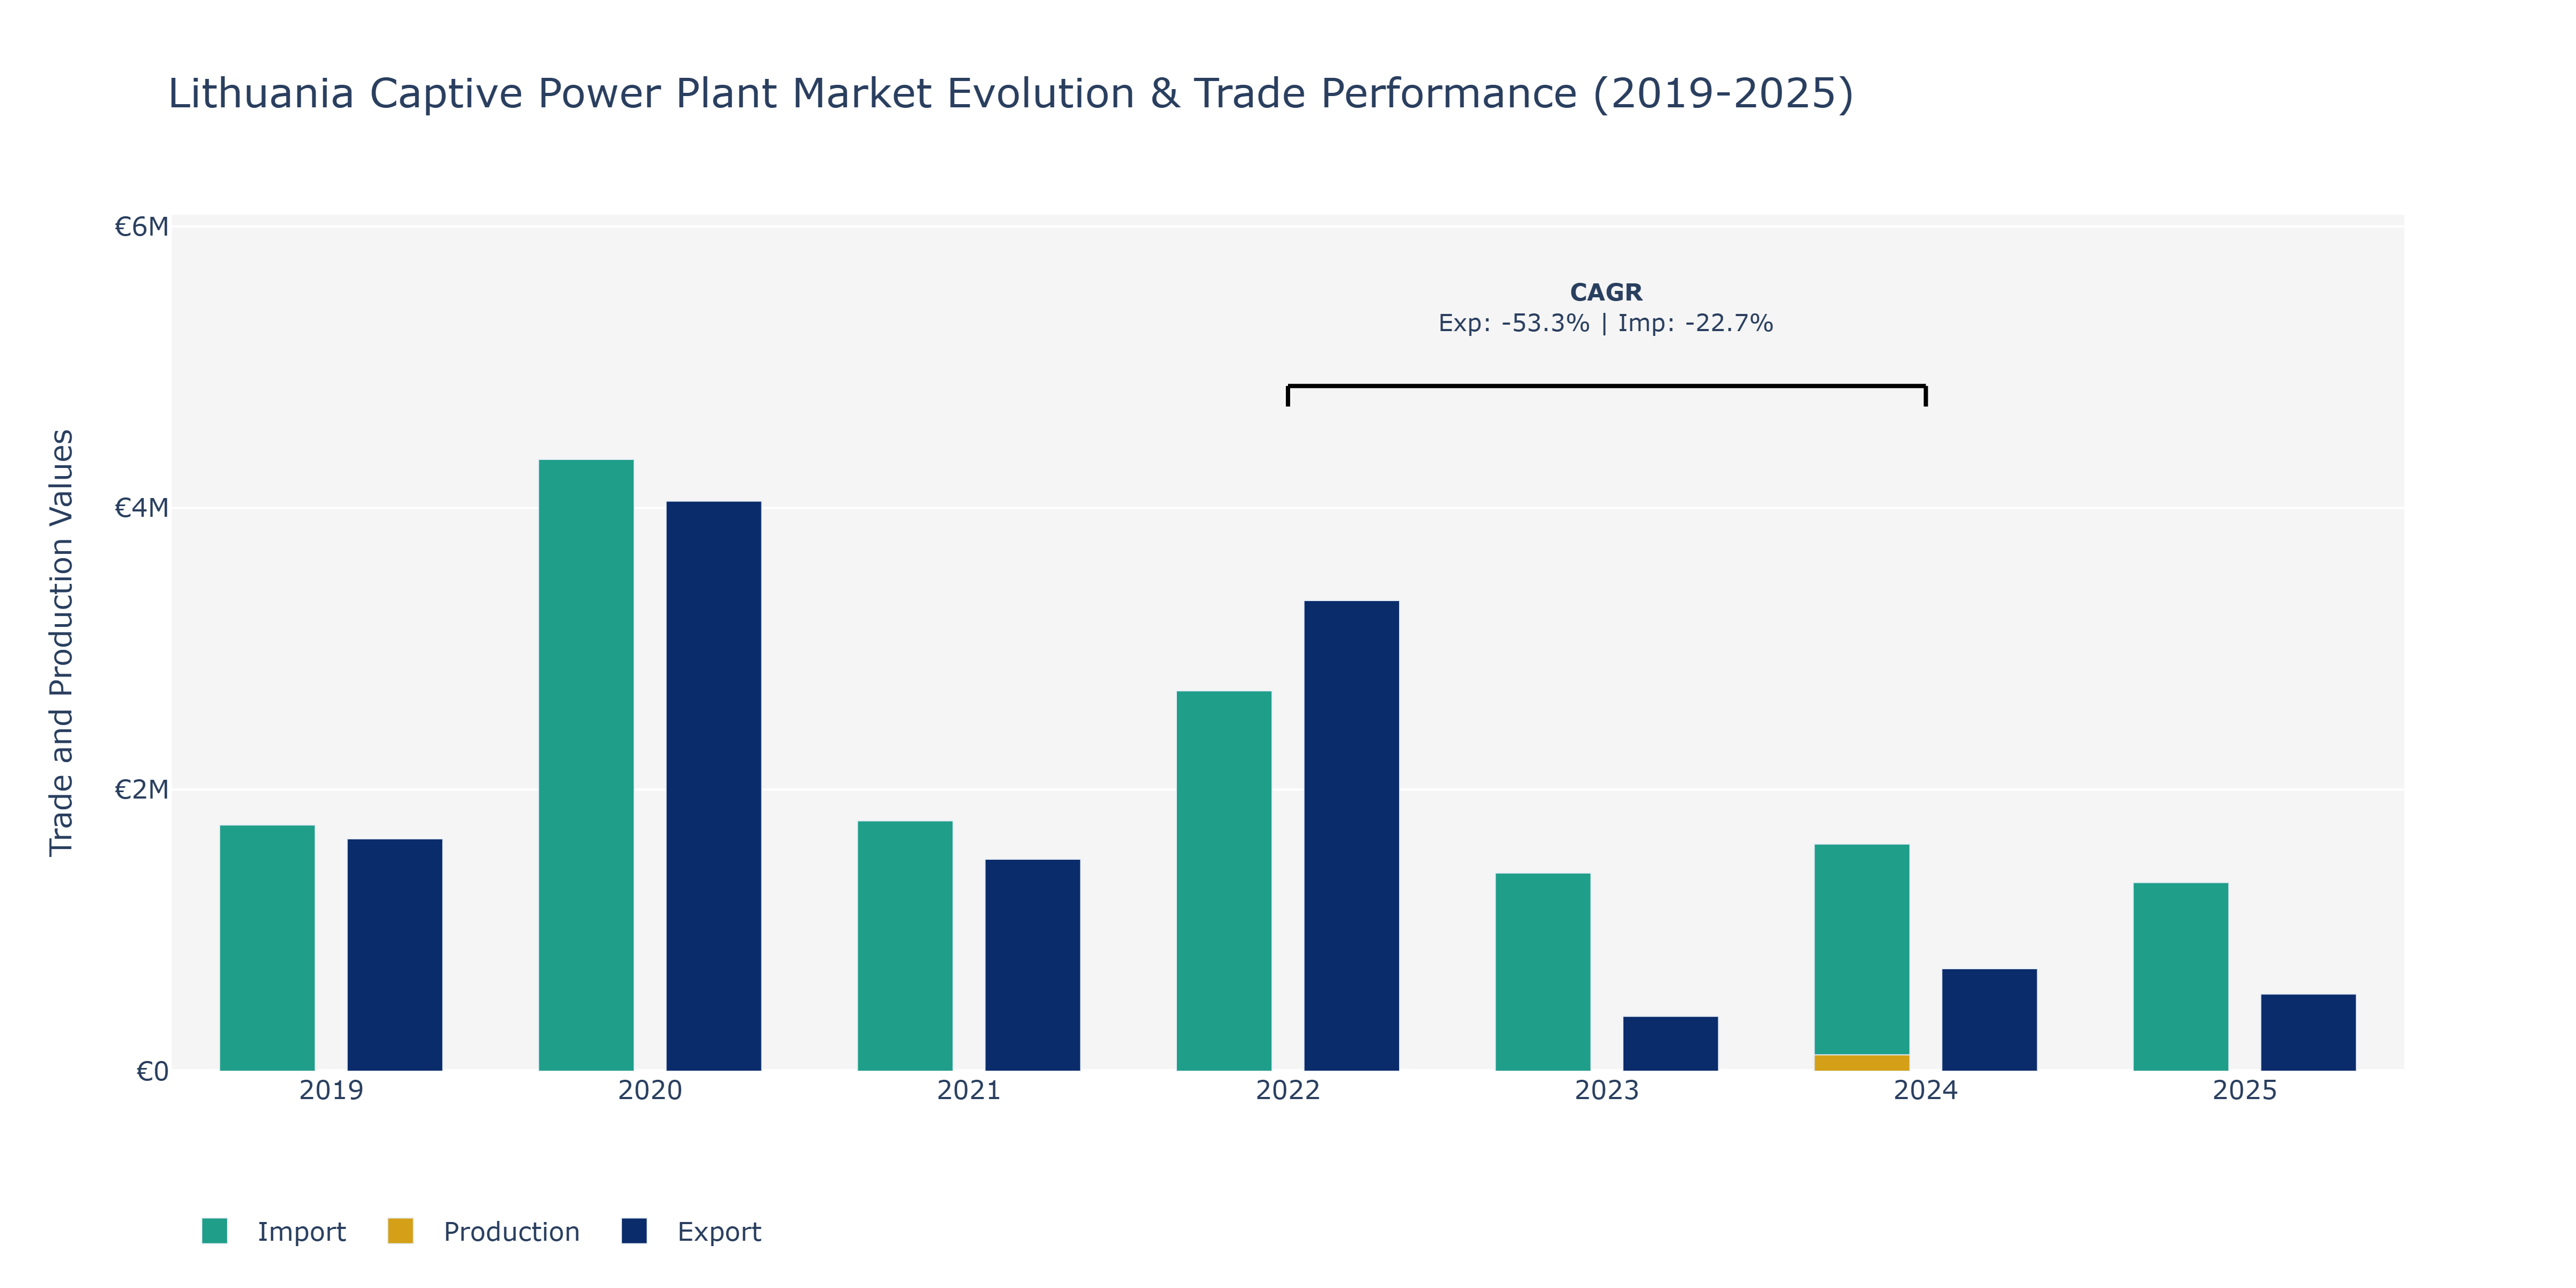
Between 2019 and 2025, Lithuania's Captive Power Plant Market witnessed notable fluctuations in Exports, Imports, and Production. Exports surged from €1.65 million in 2019 to a peak of €4.05 million in 2020 before sharply declining to €0.39 million in 2023. In 2025, exports slightly recovered to around €0.55 million. Imports followed a similar trend, increasing from €1.75 million in 2019 to €4.35 million in 2020, then decreasing to €1.34 million in 2025. The market's performance can be attributed to various factors such as changes in energy policies, global economic conditions impacting trade, and technological advancements in captive power generation. The decline in exports and imports post-2020 may reflect shifts in market demand, regulatory changes, or fluctuations in energy prices, influencing the dynamics of Lithuania's Captive Power Plant Market.
Key Highlights of the Report:
- Lithuania Captive Power Plant Market Outlook
- Market Size of Lithuania Captive Power Plant Market, 2025
- Forecast of Lithuania Captive Power Plant Market, 2032
- Historical Data and Forecast of Lithuania Captive Power Plant Revenues & Volume for the Period 2022 - 2032
- Lithuania Captive Power Plant Market Trend Evolution
- Lithuania Captive Power Plant Market Drivers and Challenges
- Lithuania Captive Power Plant Price Trends
- Lithuania Captive Power Plant Porter's Five Forces
- Lithuania Captive Power Plant Industry Life Cycle
- Historical Data and Forecast of Lithuania Captive Power Plant Market Revenues & Volume By Fuel Source for the Period 2022 - 2032
- Historical Data and Forecast of Lithuania Captive Power Plant Market Revenues & Volume By Coal for the Period 2022 - 2032
- Historical Data and Forecast of Lithuania Captive Power Plant Market Revenues & Volume By Gas for the Period 2022 - 2032
- Historical Data and Forecast of Lithuania Captive Power Plant Market Revenues & Volume By Diesel for the Period 2022 - 2032
- Historical Data and Forecast of Lithuania Captive Power Plant Market Revenues & Volume By Renewable for the Period 2022 - 2032
- Historical Data and Forecast of Lithuania Captive Power Plant Market Revenues & Volume By Other Fuel Sources for the Period 2022 - 2032
- Historical Data and Forecast of Lithuania Captive Power Plant Market Revenues & Volume By Industry for the Period 2022 - 2032
- Historical Data and Forecast of Lithuania Captive Power Plant Market Revenues & Volume By Cement for the Period 2022 - 2032
- Historical Data and Forecast of Lithuania Captive Power Plant Market Revenues & Volume By Steel for the Period 2022 - 2032
- Historical Data and Forecast of Lithuania Captive Power Plant Market Revenues & Volume By Metal & Minerals for the Period 2022 - 2032
- Historical Data and Forecast of Lithuania Captive Power Plant Market Revenues & Volume By Petrochemicals for the Period 2022 - 2032
- Lithuania Captive Power Plant Import Export Trade Statistics
- Market Opportunity Assessment By Fuel Source
- Market Opportunity Assessment By Industry
- Lithuania Captive Power Plant Top Companies Market Share
- Lithuania Captive Power Plant Competitive Benchmarking By Technical and Operational Parameters
- Lithuania Captive Power Plant Company Profiles
- Lithuania Captive Power Plant Key Strategic Recommendations
Frequently Asked Questions About the Market Study (FAQs):
6Wresearch actively monitors the Lithuania Captive Power Plant Market and publishes its comprehensive annual report, highlighting emerging trends, growth drivers, revenue analysis, and forecast outlook. Our insights help businesses to make data-backed strategic decisions with ongoing market dynamics. Our analysts track relevent industries related to the Lithuania Captive Power Plant Market, allowing our clients with actionable intelligence and reliable forecasts tailored to emerging regional needs.
Yes, we provide customisation as per your requirements. To learn more, feel free to contact us on sales@6wresearch.com
1 Executive Summary |
2 Introduction |
2.1 Key Highlights of the Report |
2.2 Report Description |
2.3 Market Scope & Segmentation |
2.4 Research Methodology |
2.5 Assumptions |
3 Lithuania Captive Power Plant Market Overview |
3.1 Lithuania Country Macro Economic Indicators |
3.2 Lithuania Captive Power Plant Market Revenues & Volume, 2022 & 2032F |
3.3 Lithuania Captive Power Plant Market - Industry Life Cycle |
3.4 Lithuania Captive Power Plant Market - Porter's Five Forces |
3.5 Lithuania Captive Power Plant Market Revenues & Volume Share, By Fuel Source, 2022 & 2032F |
3.6 Lithuania Captive Power Plant Market Revenues & Volume Share, By Industry, 2022 & 2032F |
4 Lithuania Captive Power Plant Market Dynamics |
4.1 Impact Analysis |
4.2 Market Drivers |
4.2.1 Increasing demand for reliable and uninterrupted power supply in Lithuania |
4.2.2 Government initiatives promoting energy independence and efficiency |
4.2.3 Growing industrial sector leading to higher electricity consumption |
4.3 Market Restraints |
4.3.1 High initial investment and operational costs for setting up captive power plants |
4.3.2 Regulatory challenges and compliance requirements |
4.3.3 Limited availability of natural resources for power generation |
5 Lithuania Captive Power Plant Market Trends |
6 Lithuania Captive Power Plant Market, By Types |
6.1 Lithuania Captive Power Plant Market, By Fuel Source |
6.1.1 Overview and Analysis |
6.1.2 Lithuania Captive Power Plant Market Revenues & Volume, By Fuel Source, 2022 - 2032F |
6.1.3 Lithuania Captive Power Plant Market Revenues & Volume, By Coal, 2022 - 2032F |
6.1.4 Lithuania Captive Power Plant Market Revenues & Volume, By Gas, 2022 - 2032F |
6.1.5 Lithuania Captive Power Plant Market Revenues & Volume, By Diesel, 2022 - 2032F |
6.1.6 Lithuania Captive Power Plant Market Revenues & Volume, By Renewable, 2022 - 2032F |
6.1.7 Lithuania Captive Power Plant Market Revenues & Volume, By Other Fuel Sources, 2022 - 2032F |
6.2 Lithuania Captive Power Plant Market, By Industry |
6.2.1 Overview and Analysis |
6.2.2 Lithuania Captive Power Plant Market Revenues & Volume, By Cement, 2022 - 2032F |
6.2.3 Lithuania Captive Power Plant Market Revenues & Volume, By Steel, 2022 - 2032F |
6.2.4 Lithuania Captive Power Plant Market Revenues & Volume, By Metal & Minerals, 2022 - 2032F |
6.2.5 Lithuania Captive Power Plant Market Revenues & Volume, By Petrochemicals, 2022 - 2032F |
7 Lithuania Captive Power Plant Market Import-Export Trade Statistics |
7.1 Lithuania Captive Power Plant Market Export to Major Countries |
7.2 Lithuania Captive Power Plant Market Imports from Major Countries |
8 Lithuania Captive Power Plant Market Key Performance Indicators |
8.1 Capacity utilization rate of captive power plants |
8.2 Energy efficiency improvements in captive power generation |
8.3 Adoption rate of renewable energy sources in captive power plants |
8.4 Maintenance and downtime frequency for captive power plants |
9 Lithuania Captive Power Plant Market - Opportunity Assessment |
9.1 Lithuania Captive Power Plant Market Opportunity Assessment, By Fuel Source, 2022 & 2032F |
9.2 Lithuania Captive Power Plant Market Opportunity Assessment, By Industry, 2022 & 2032F |
10 Lithuania Captive Power Plant Market - Competitive Landscape |
10.1 Lithuania Captive Power Plant Market Revenue Share, By Companies, 2025 |
10.2 Lithuania Captive Power Plant Market Competitive Benchmarking, By Operating and Technical Parameters |
11 Company Profiles |
12 Recommendations |
13 Disclaimer |
Global Go To Market Strategy - 2030
Export potential enables firms to identify high-growth global markets with greater confidence by combining advanced trade intelligence with a structured quantitative methodology. The framework analyzes emerging demand trends and country-level import patterns while integrating macroeconomic and trade datasets such as GDP and population forecasts, bilateral import–export flows, tariff structures, elasticity differentials between developed and developing economies, geographic distance, and import demand projections. Using weighted trade values from 2020–2024 as the base period to project country-to-country export potential for 2030, these inputs are operationalized through calculated drivers such as gravity model parameters, tariff impact factors, and projected GDP per-capita growth. Through an analysis of hidden potentials, demand hotspots, and market conditions that are most favorable to success, this method enables firms to focus on target countries, maximize returns, and global expansion with data, backed by accuracy.
By factoring in the projected importer demand gap that is currently unmet and could be potential opportunity, it identifies the potential for the Exporter (Country) among 190 countries, against the general trade analysis, which identifies the biggest importer or exporter.
To discover high-growth global markets and optimize your business strategy:
Click Here
Pricing
- Single User License$ 1,995
- Department License$ 2,400
- Site License$ 3,120
- Global License$ 3,795

Leadership Perspectives from Industry Events
Search
Thought Leadership and Analyst Meet


Our Clients
6WResearch In News
- India Export Attractiveness Tracker 2026
- India Air Conditioner Market Set for Strong Rebound in 2026 After Weather-Led Correction and GST-Driven Recovery: 6Wresearch
- ADAS in India: How Automatic Emergency Braking, Blind Spot Detection & Driver Monitoring are Transforming Road Safety
- Doha a strategic location for EV manufacturing hub: IPA Qatar
- Demand for luxury TVs surging in the GCC, says Samsung
- Empowering Growth: The Thriving Journey of Bangladesh’s Cable Industry
Latest Reports
- Qatar Access and Home Network Market (2026-2032)
- Nicaragua RPG Gaming Market (2026-2032)
- New Zealand RPG Gaming Market (2026-2032)
- Netherlands RPG Gaming Market (2026-2032)
- Nauru RPG Gaming Market (2026-2032)
- Namibia RPG Gaming Market (2026-2032)
- Mozambique RPG Gaming Market (2026-2032)
- Montenegro RPG Gaming Market (2026-2032)
- Mongolia RPG Gaming Market (2026-2032)
- Monaco RPG Gaming Market (2026-2032)
Industry Events and Analyst Meet

EV India Expo 2026

HIMTEX 2026

India Refining Summit 2026

India EV Show 2026

EV tech India Expo 2026
Whitepaper
- Middle East & Africa Commercial Security Market Click here to view more.
- Middle East & Africa Fire Safety Systems & Equipment Market Click here to view more.
- GCC Drone Market Click here to view more.
- Middle East Lighting Fixture Market Click here to view more.
- GCC Physical & Perimeter Security Market Click here to view more.