Lithuania Ceramics Market (2026-2032) | Forecast, Companies, Analysis, Trends, Size, Revenue, Segmentation, Outlook, Share, Industry, Growth & Value
Market Forecast By Product Types (Traditional, Advanced), By Applications (Sanitary Ware, Abrasives, Bricks and Pipes, Tiles, Pottery, Others), By End-users (Building & Construction, Industrial, Medical, Others) And Competitive Landscape
| Product Code: ETC4656123 | Publication Date: Nov 2023 | Updated Date: Apr 2026 | Product Type: Market Research Report | |
| Publisher: 6Wresearch | Author: Shubham Padhi | No. of Pages: 60 | No. of Figures: 30 | No. of Tables: 5 |
Lithuania Ceramics Market Size (2020-2030)
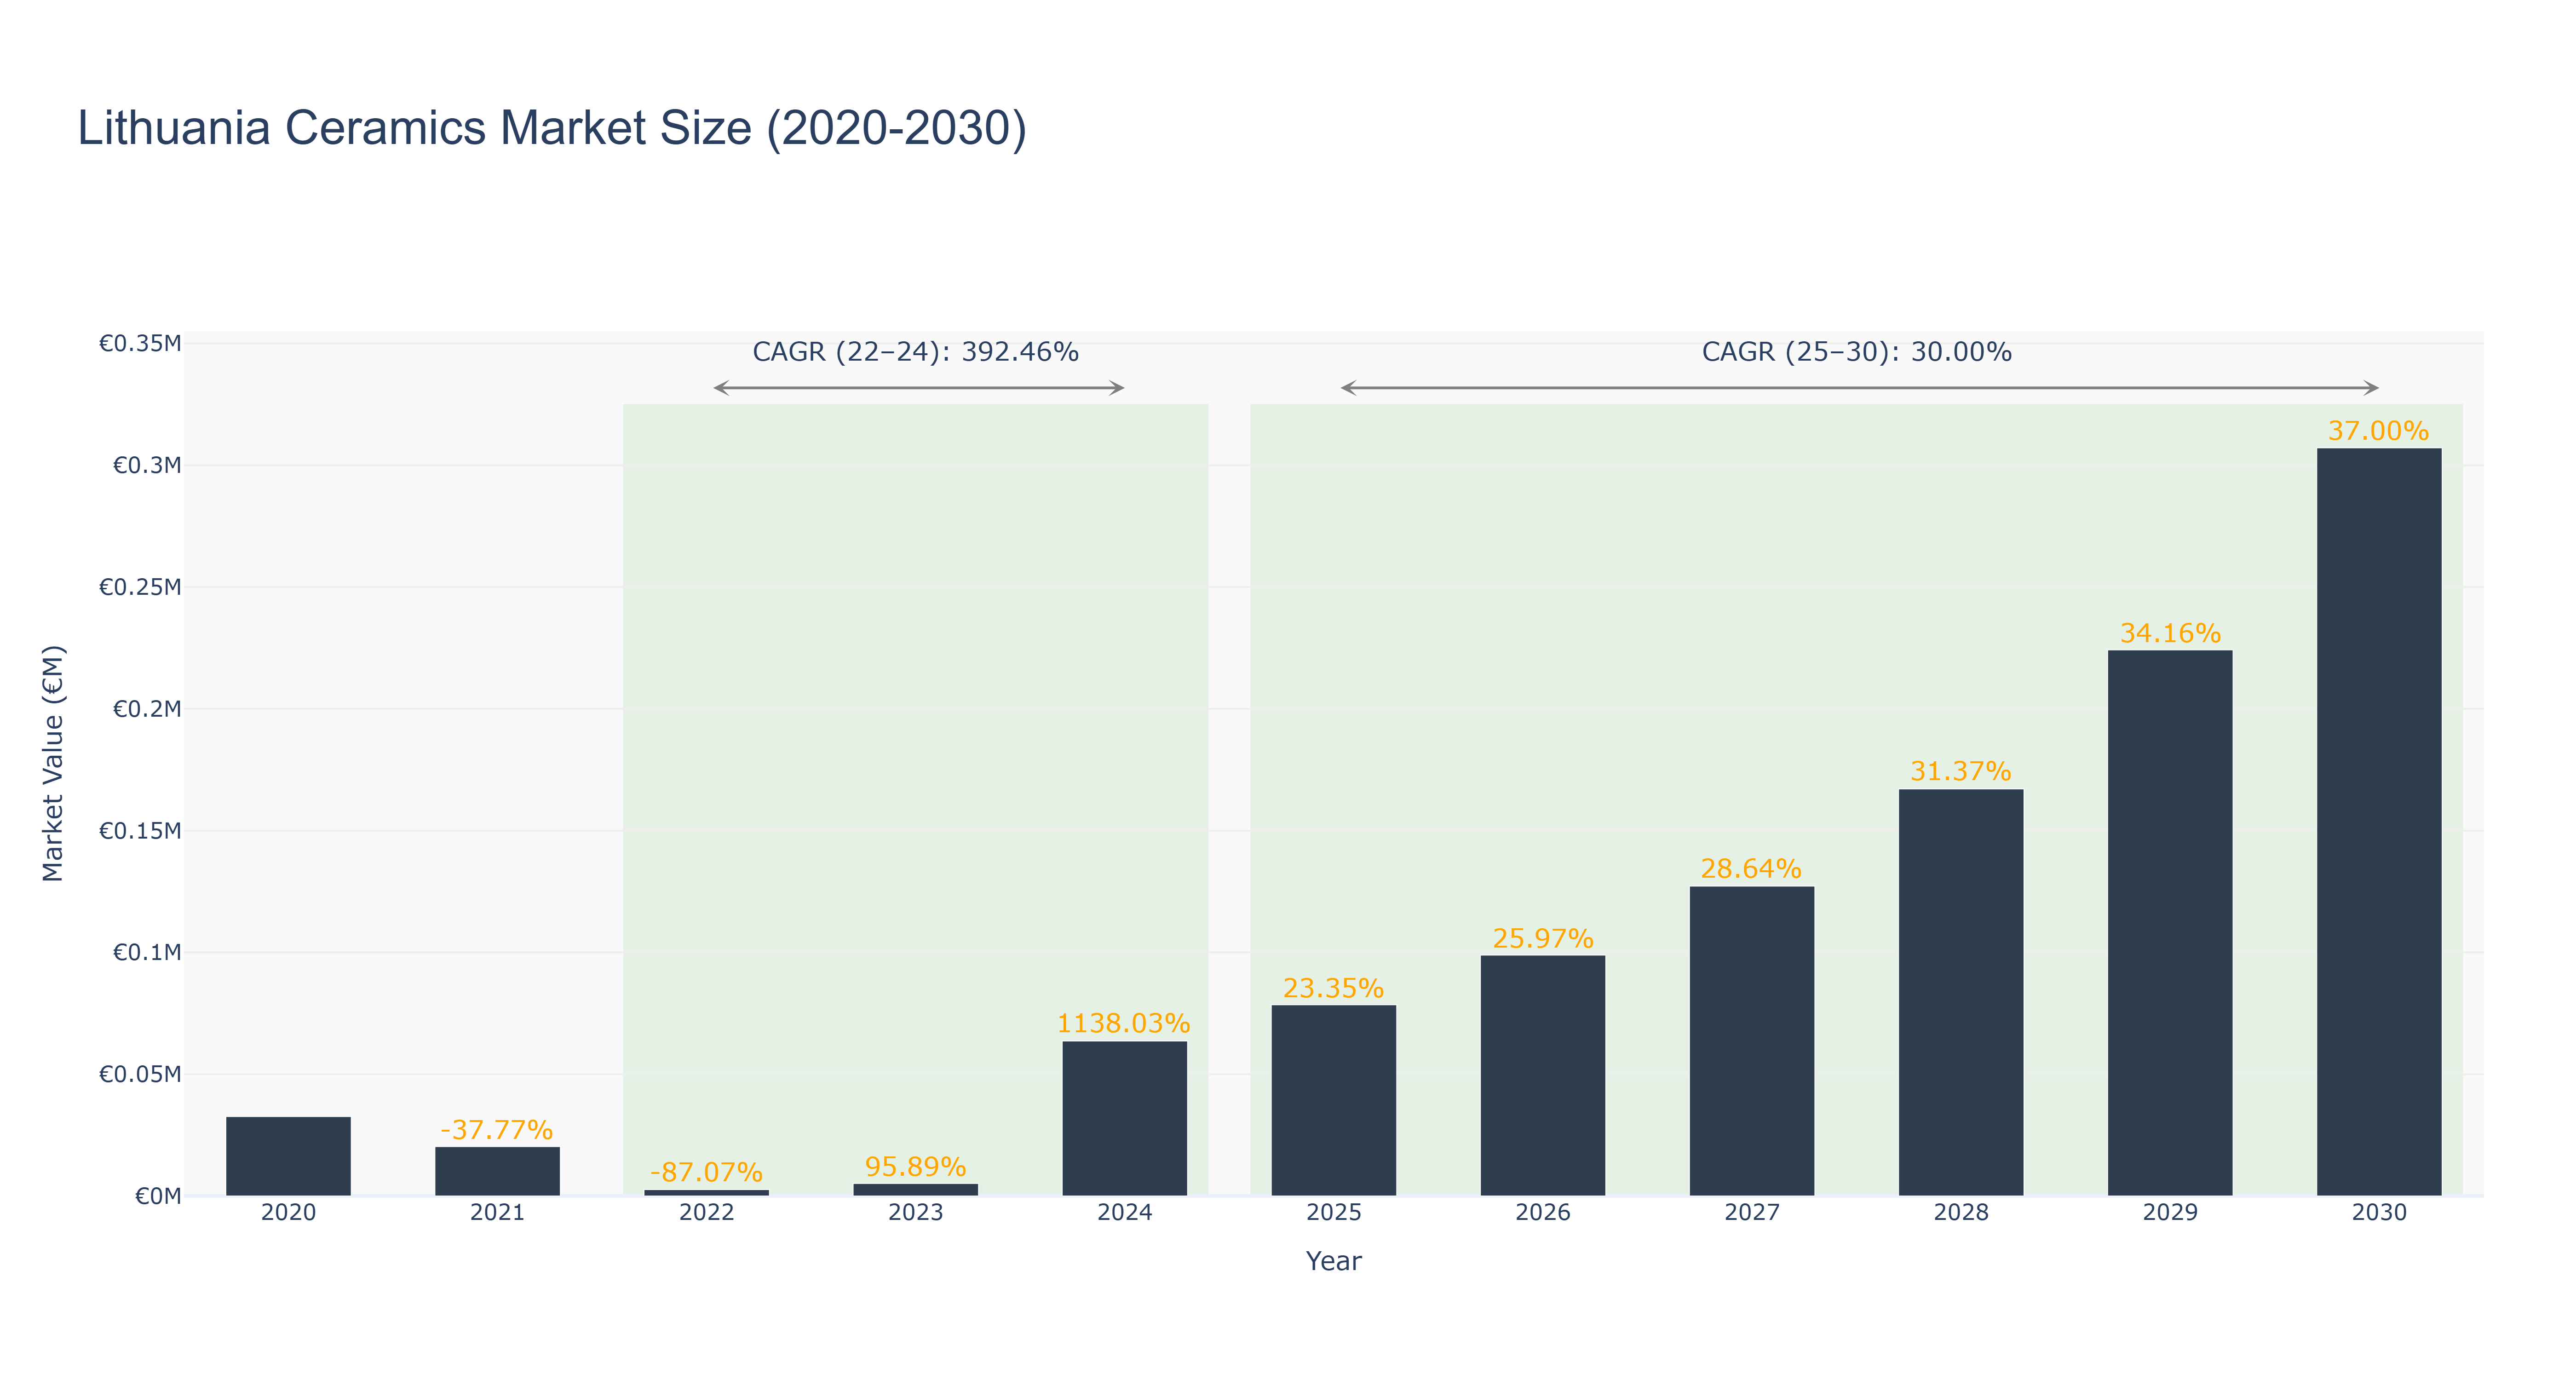
The Lithuania Ceramics Market has exhibited a remarkable trajectory characterized by significant fluctuations and a strong recovery. Following a peak market size of €32.62 thousand in 2020, the market faced substantial declines, recording a low of €2.62 thousand in 2022, which marked an alarming growth rate of -87.07%. However, a robust rebound occurred in 2023 with a market size of €5.14 thousand and a growth rate of 95.89%, leading to a projected surge to €63.64 thousand in 2024, reflecting an extraordinary CAGR of 392.46% from 2022 to 2024. Looking ahead, the market is expected to stabilize and grow steadily, with forecasted sizes reaching €78.50 thousand in 2025 and €307.17 thousand by 2030, indicating a CAGR of 30.00%. This growth is likely driven by increasing consumer demand for artisanal products and advancements in manufacturing technologies, positioning Lithuania as a burgeoning hub in the ceramics industry.
Lithuania Ceramics Market: Production & Trade Performance (2019-2025)
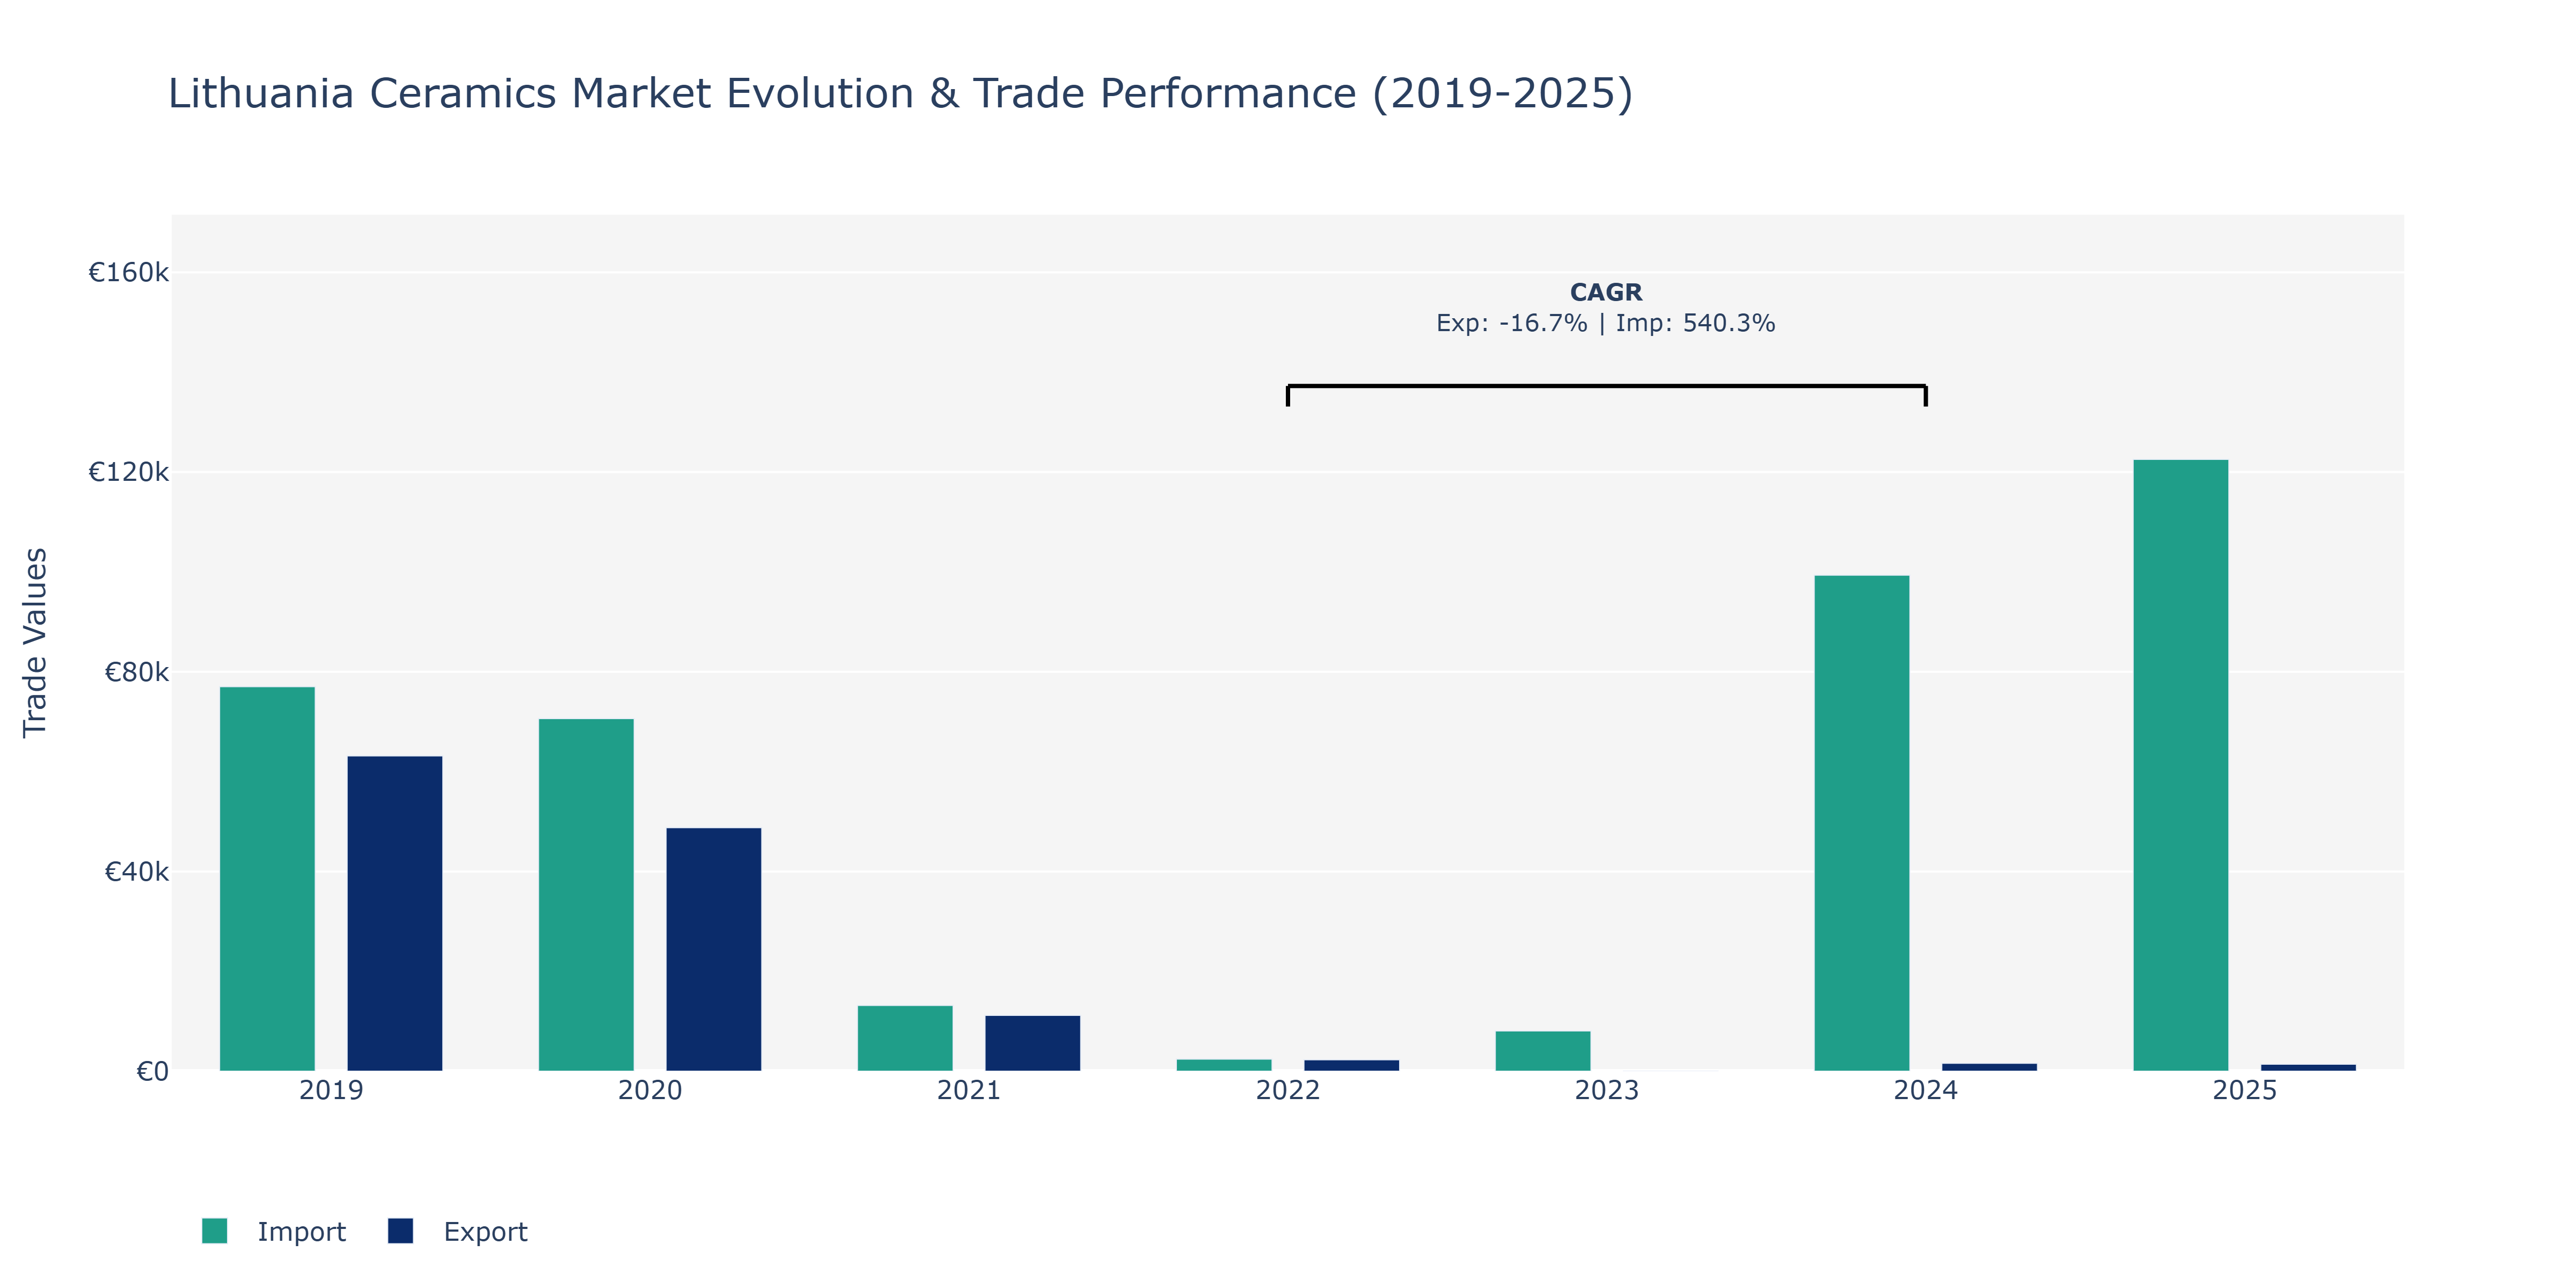
Between 2019 and 2025, Lithuania's Ceramics Market witnessed notable fluctuations in both exports and imports. Export value showed a sharp decline from €63.15 thousand in 2019 to €11.18 thousand in 2021, with a further decrease to €1.40 thousand in 2025. Conversely, imports peaked in 2024 at €99.34 thousand, showcasing a significant increase from the 2023 level of €8.05 thousand. The surge in imports could be attributed to increased demand for ceramic products in Lithuania, possibly driven by growth in the construction sector and interior design industry. On the other hand, the decline in exports may reflect shifts in global demand, competition from other markets, or changes in trade agreements impacting Lithuania's ceramic industry. To sustain market competitiveness, local ceramic manufacturers could focus on enhancing product quality, innovation, and exploring new export markets to mitigate the downward trend in exports.
Key Highlights of the Report:
- Lithuania Ceramics Market Outlook
- Market Size of Lithuania Ceramics Market, 2025
- Forecast of Lithuania Ceramics Market, 2032
- Historical Data and Forecast of Lithuania Ceramics Revenues & Volume for the Period 2022 - 2032F
- Lithuania Ceramics Market Trend Evolution
- Lithuania Ceramics Market Drivers and Challenges
- Lithuania Ceramics Price Trends
- Lithuania Ceramics Porter`s Five Forces
- Lithuania Ceramics Industry Life Cycle
- Historical Data and Forecast of Lithuania Ceramics Market Revenues & Volume By Product Types for the Period 2022 - 2032F
- Historical Data and Forecast of Lithuania Ceramics Market Revenues & Volume By Traditional for the Period 2022 - 2032F
- Historical Data and Forecast of Lithuania Ceramics Market Revenues & Volume By Advanced for the Period 2022 - 2032F
- Historical Data and Forecast of Lithuania Ceramics Market Revenues & Volume By Applications for the Period 2022 - 2032F
- Historical Data and Forecast of Lithuania Ceramics Market Revenues & Volume By Sanitary Ware for the Period 2022 - 2032F
- Historical Data and Forecast of Lithuania Ceramics Market Revenues & Volume By Abrasives for the Period 2022 - 2032F
- Historical Data and Forecast of Lithuania Ceramics Market Revenues & Volume By Bricks and Pipes for the Period 2022 - 2032F
- Historical Data and Forecast of Lithuania Ceramics Market Revenues & Volume By Tiles for the Period 2022 - 2032F
- Historical Data and Forecast of Lithuania Ceramics Market Revenues & Volume By Pottery for the Period 2022 - 2032F
- Historical Data and Forecast of Lithuania Ceramics Market Revenues & Volume By Others for the Period 2022 - 2032F
- Historical Data and Forecast of Lithuania Ceramics Market Revenues & Volume By End-users for the Period 2022 - 2032F
- Historical Data and Forecast of Lithuania Ceramics Market Revenues & Volume By Building & Construction for the Period 2022 - 2032F
- Historical Data and Forecast of Lithuania Ceramics Market Revenues & Volume By Industrial for the Period 2022 - 2032F
- Historical Data and Forecast of Lithuania Ceramics Market Revenues & Volume By Medical for the Period 2022 - 2032F
- Historical Data and Forecast of Lithuania Ceramics Market Revenues & Volume By Others for the Period 2022 - 2032F
- Lithuania Ceramics Import Export Trade Statistics
- Market Opportunity Assessment By Product Types
- Market Opportunity Assessment By Applications
- Market Opportunity Assessment By End-users
- Lithuania Ceramics Top Companies Market Share
- Lithuania Ceramics Competitive Benchmarking By Technical and Operational Parameters
- Lithuania Ceramics Company Profiles
- Lithuania Ceramics Key Strategic Recommendations
Frequently Asked Questions About the Market Study (FAQs):
6Wresearch actively monitors the Lithuania Ceramics Market and publishes its comprehensive annual report, highlighting emerging trends, growth drivers, revenue analysis, and forecast outlook. Our insights help businesses to make data-backed strategic decisions with ongoing market dynamics. Our analysts track relevent industries related to the Lithuania Ceramics Market, allowing our clients with actionable intelligence and reliable forecasts tailored to emerging regional needs.
Yes, we provide customisation as per your requirements. To learn more, feel free to contact us on sales@6wresearch.com
1 Executive Summary |
2 Introduction |
2.1 Key Highlights of the Report |
2.2 Report Description |
2.3 Market Scope & Segmentation |
2.4 Research Methodology |
2.5 Assumptions |
3 Lithuania Ceramics Market Overview |
3.1 Lithuania Country Macro Economic Indicators |
3.2 Lithuania Ceramics Market Revenues & Volume, 2022 & 2032F |
3.3 Lithuania Ceramics Market - Industry Life Cycle |
3.4 Lithuania Ceramics Market - Porter's Five Forces |
3.5 Lithuania Ceramics Market Revenues & Volume Share, By Product Types, 2022 & 2032F |
3.6 Lithuania Ceramics Market Revenues & Volume Share, By Applications, 2022 & 2032F |
3.7 Lithuania Ceramics Market Revenues & Volume Share, By End-users, 2022 & 2032F |
4 Lithuania Ceramics Market Dynamics |
4.1 Impact Analysis |
4.2 Market Drivers |
4.2.1 Growing demand for aesthetically pleasing and durable ceramic products in the construction industry |
4.2.2 Increasing focus on interior decoration and home improvement projects |
4.2.3 Rising disposable income and changing consumer preferences towards premium ceramic products |
4.3 Market Restraints |
4.3.1 Fluctuating raw material prices impacting production costs |
4.3.2 Intense competition from alternative materials like plastic and metal in certain applications |
4.3.3 Regulatory challenges related to environmental concerns and waste management in the ceramics industry |
5 Lithuania Ceramics Market Trends |
6 Lithuania Ceramics Market Segmentations |
6.1 Lithuania Ceramics Market, By Product Types |
6.1.1 Overview and Analysis |
6.1.2 Lithuania Ceramics Market Revenues & Volume, By Traditional, 2022 - 2032F |
6.1.3 Lithuania Ceramics Market Revenues & Volume, By Advanced, 2022 - 2032F |
6.2 Lithuania Ceramics Market, By Applications |
6.2.1 Overview and Analysis |
6.2.2 Lithuania Ceramics Market Revenues & Volume, By Sanitary Ware, 2022 - 2032F |
6.2.3 Lithuania Ceramics Market Revenues & Volume, By Abrasives, 2022 - 2032F |
6.2.4 Lithuania Ceramics Market Revenues & Volume, By Bricks and Pipes, 2022 - 2032F |
6.2.5 Lithuania Ceramics Market Revenues & Volume, By Tiles, 2022 - 2032F |
6.2.6 Lithuania Ceramics Market Revenues & Volume, By Pottery, 2022 - 2032F |
6.2.7 Lithuania Ceramics Market Revenues & Volume, By Others, 2022 - 2032F |
6.3 Lithuania Ceramics Market, By End-users |
6.3.1 Overview and Analysis |
6.3.2 Lithuania Ceramics Market Revenues & Volume, By Building & Construction, 2022 - 2032F |
6.3.3 Lithuania Ceramics Market Revenues & Volume, By Industrial, 2022 - 2032F |
6.3.4 Lithuania Ceramics Market Revenues & Volume, By Medical, 2022 - 2032F |
6.3.5 Lithuania Ceramics Market Revenues & Volume, By Others, 2022 - 2032F |
7 Lithuania Ceramics Market Import-Export Trade Statistics |
7.1 Lithuania Ceramics Market Export to Major Countries |
7.2 Lithuania Ceramics Market Imports from Major Countries |
8 Lithuania Ceramics Market Key Performance Indicators |
8.1 Percentage of revenue from new product launches in the ceramics market |
8.2 Customer satisfaction scores related to ceramic product quality and design |
8.3 Percentage of market share in the premium ceramic product segment |
9 Lithuania Ceramics Market - Opportunity Assessment |
9.1 Lithuania Ceramics Market Opportunity Assessment, By Product Types, 2022 & 2032F |
9.2 Lithuania Ceramics Market Opportunity Assessment, By Applications, 2022 & 2032F |
9.3 Lithuania Ceramics Market Opportunity Assessment, By End-users, 2022 & 2032F |
10 Lithuania Ceramics Market - Competitive Landscape |
10.1 Lithuania Ceramics Market Revenue Share, By Companies, 2025 |
10.2 Lithuania Ceramics Market Competitive Benchmarking, By Operating and Technical Parameters |
11 Company Profiles |
12 Recommendations | 13 Disclaimer |
Global Go To Market Strategy - 2030
Export potential enables firms to identify high-growth global markets with greater confidence by combining advanced trade intelligence with a structured quantitative methodology. The framework analyzes emerging demand trends and country-level import patterns while integrating macroeconomic and trade datasets such as GDP and population forecasts, bilateral import–export flows, tariff structures, elasticity differentials between developed and developing economies, geographic distance, and import demand projections. Using weighted trade values from 2020–2024 as the base period to project country-to-country export potential for 2030, these inputs are operationalized through calculated drivers such as gravity model parameters, tariff impact factors, and projected GDP per-capita growth. Through an analysis of hidden potentials, demand hotspots, and market conditions that are most favorable to success, this method enables firms to focus on target countries, maximize returns, and global expansion with data, backed by accuracy.
By factoring in the projected importer demand gap that is currently unmet and could be potential opportunity, it identifies the potential for the Exporter (Country) among 190 countries, against the general trade analysis, which identifies the biggest importer or exporter.
To discover high-growth global markets and optimize your business strategy:
Click Here
Pricing
- Single User License$ 1,995
- Department License$ 2,400
- Site License$ 3,120
- Global License$ 3,795

Leadership Perspectives from Industry Events
Search
Thought Leadership and Analyst Meet


Our Clients
6WResearch In News
- India Export Attractiveness Tracker 2026
- India Air Conditioner Market Set for Strong Rebound in 2026 After Weather-Led Correction and GST-Driven Recovery: 6Wresearch
- ADAS in India: How Automatic Emergency Braking, Blind Spot Detection & Driver Monitoring are Transforming Road Safety
- Doha a strategic location for EV manufacturing hub: IPA Qatar
- Demand for luxury TVs surging in the GCC, says Samsung
- Empowering Growth: The Thriving Journey of Bangladesh’s Cable Industry
Latest Reports
- Qatar Access and Home Network Market (2026-2032)
- Nicaragua RPG Gaming Market (2026-2032)
- New Zealand RPG Gaming Market (2026-2032)
- Netherlands RPG Gaming Market (2026-2032)
- Nauru RPG Gaming Market (2026-2032)
- Namibia RPG Gaming Market (2026-2032)
- Mozambique RPG Gaming Market (2026-2032)
- Montenegro RPG Gaming Market (2026-2032)
- Mongolia RPG Gaming Market (2026-2032)
- Monaco RPG Gaming Market (2026-2032)
Industry Events and Analyst Meet

EV India Expo 2026

HIMTEX 2026

India Refining Summit 2026

India EV Show 2026

EV tech India Expo 2026
Whitepaper
- Middle East & Africa Commercial Security Market Click here to view more.
- Middle East & Africa Fire Safety Systems & Equipment Market Click here to view more.
- GCC Drone Market Click here to view more.
- Middle East Lighting Fixture Market Click here to view more.
- GCC Physical & Perimeter Security Market Click here to view more.