Lithuania Confectionery Market (2026-2032) | Trends, Industry, Segmentation, Forecast, Size, Revenue, Value, Companies, Growth, Share, Analysis & Outlook
Market Forecast By Type (Sugar, Chocolate, Fine Bakery Wares, Others), By Distribution Channel (Supermarket/Hypermarket, Specialist Retailers, Online Retail Stores, Convenience Stores, Other Distribution Channels) And Competitive Landscape
| Product Code: ETC4942472 | Publication Date: Nov 2023 | Updated Date: Apr 2026 | Product Type: Market Research Report | |
| Publisher: 6Wresearch | Author: Shubham Padhi | No. of Pages: 60 | No. of Figures: 30 | No. of Tables: 5 |
Lithuania Confectionery Market Size (2020-2030)
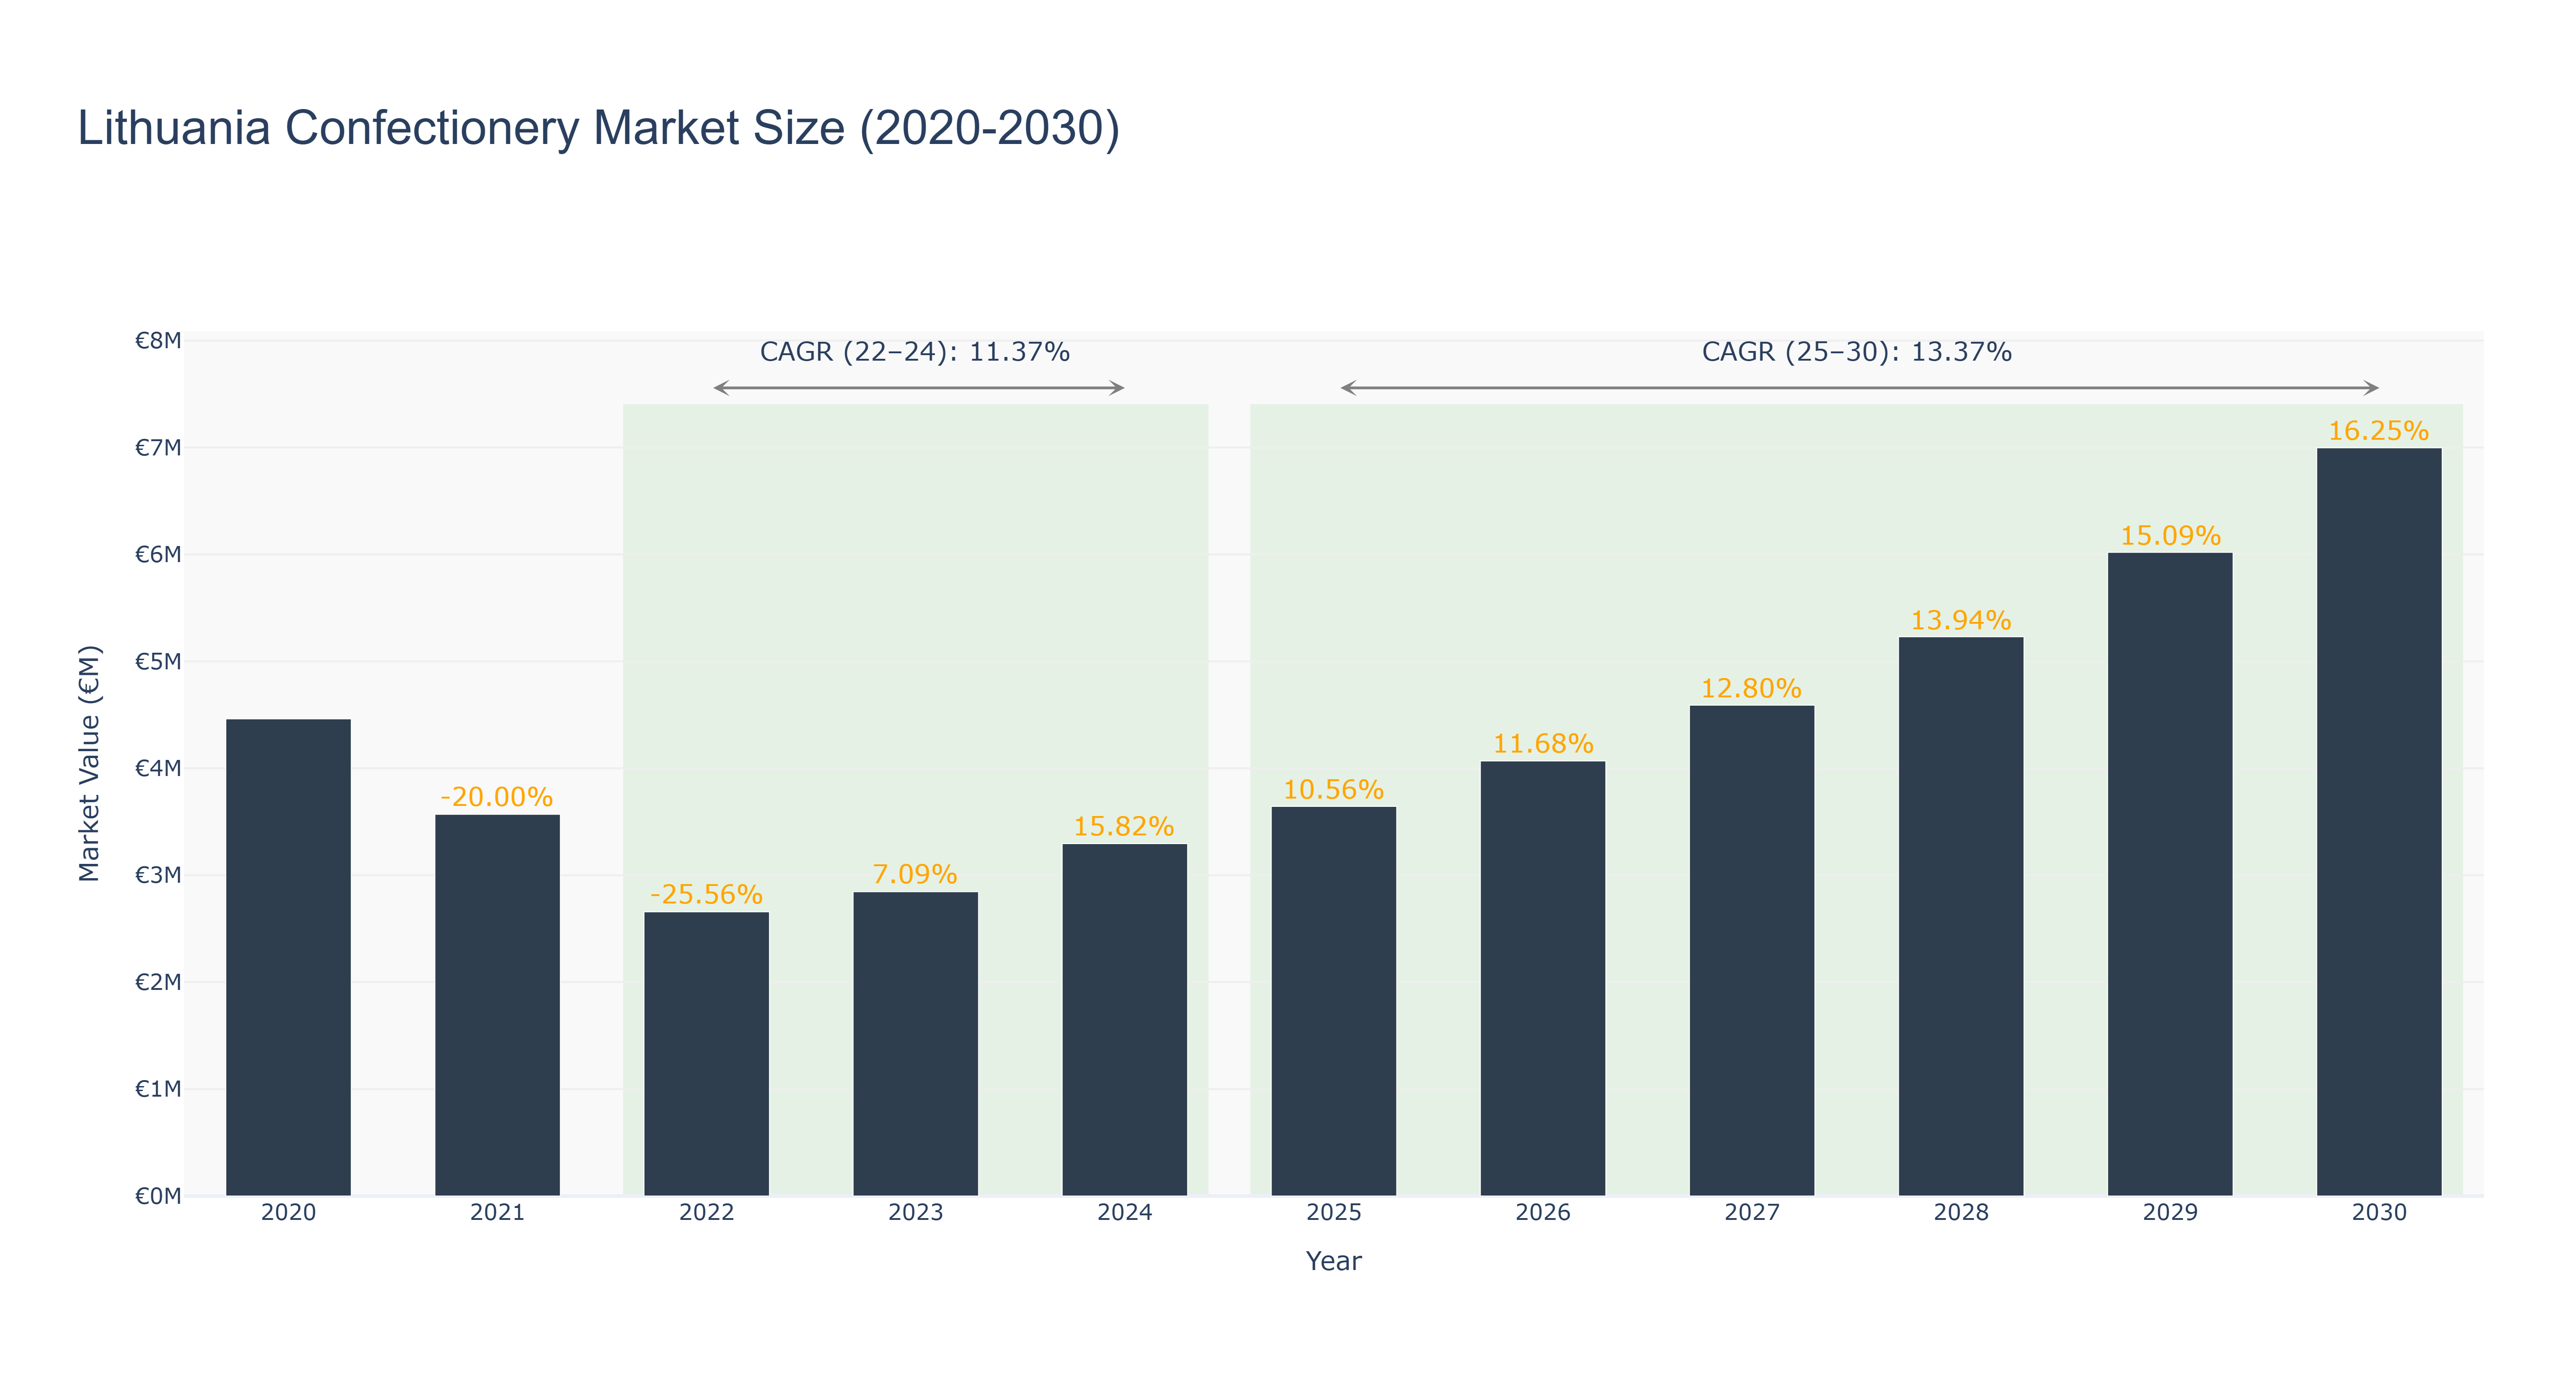
Lithuania Confectionery Market has shown a fluctuating trend over the years. The peak market size was in 2030 at €7.00 million, with a steady growth rate. From 2020 to 2024, the market size decreased from €4.46 million to €3.30 million, attributed to economic uncertainties and changing consumer preferences. However, from 2025 to 2030, the market is forecasted to grow significantly, reaching €7.00 million in 2030, driven by increasing disposable income and a rising demand for premium confectionery products. The CAGR for 2022-24 is 11.37%, and for 2025-30 is 13.37%. Recent developments in the market include the introduction of innovative flavors and packaging to attract a wider consumer base. Future projects focus on expanding distribution channels to reach new markets and enhance brand visibility.
Lithuania Confectionery Market: Production & Trade Performance (2019-2025)
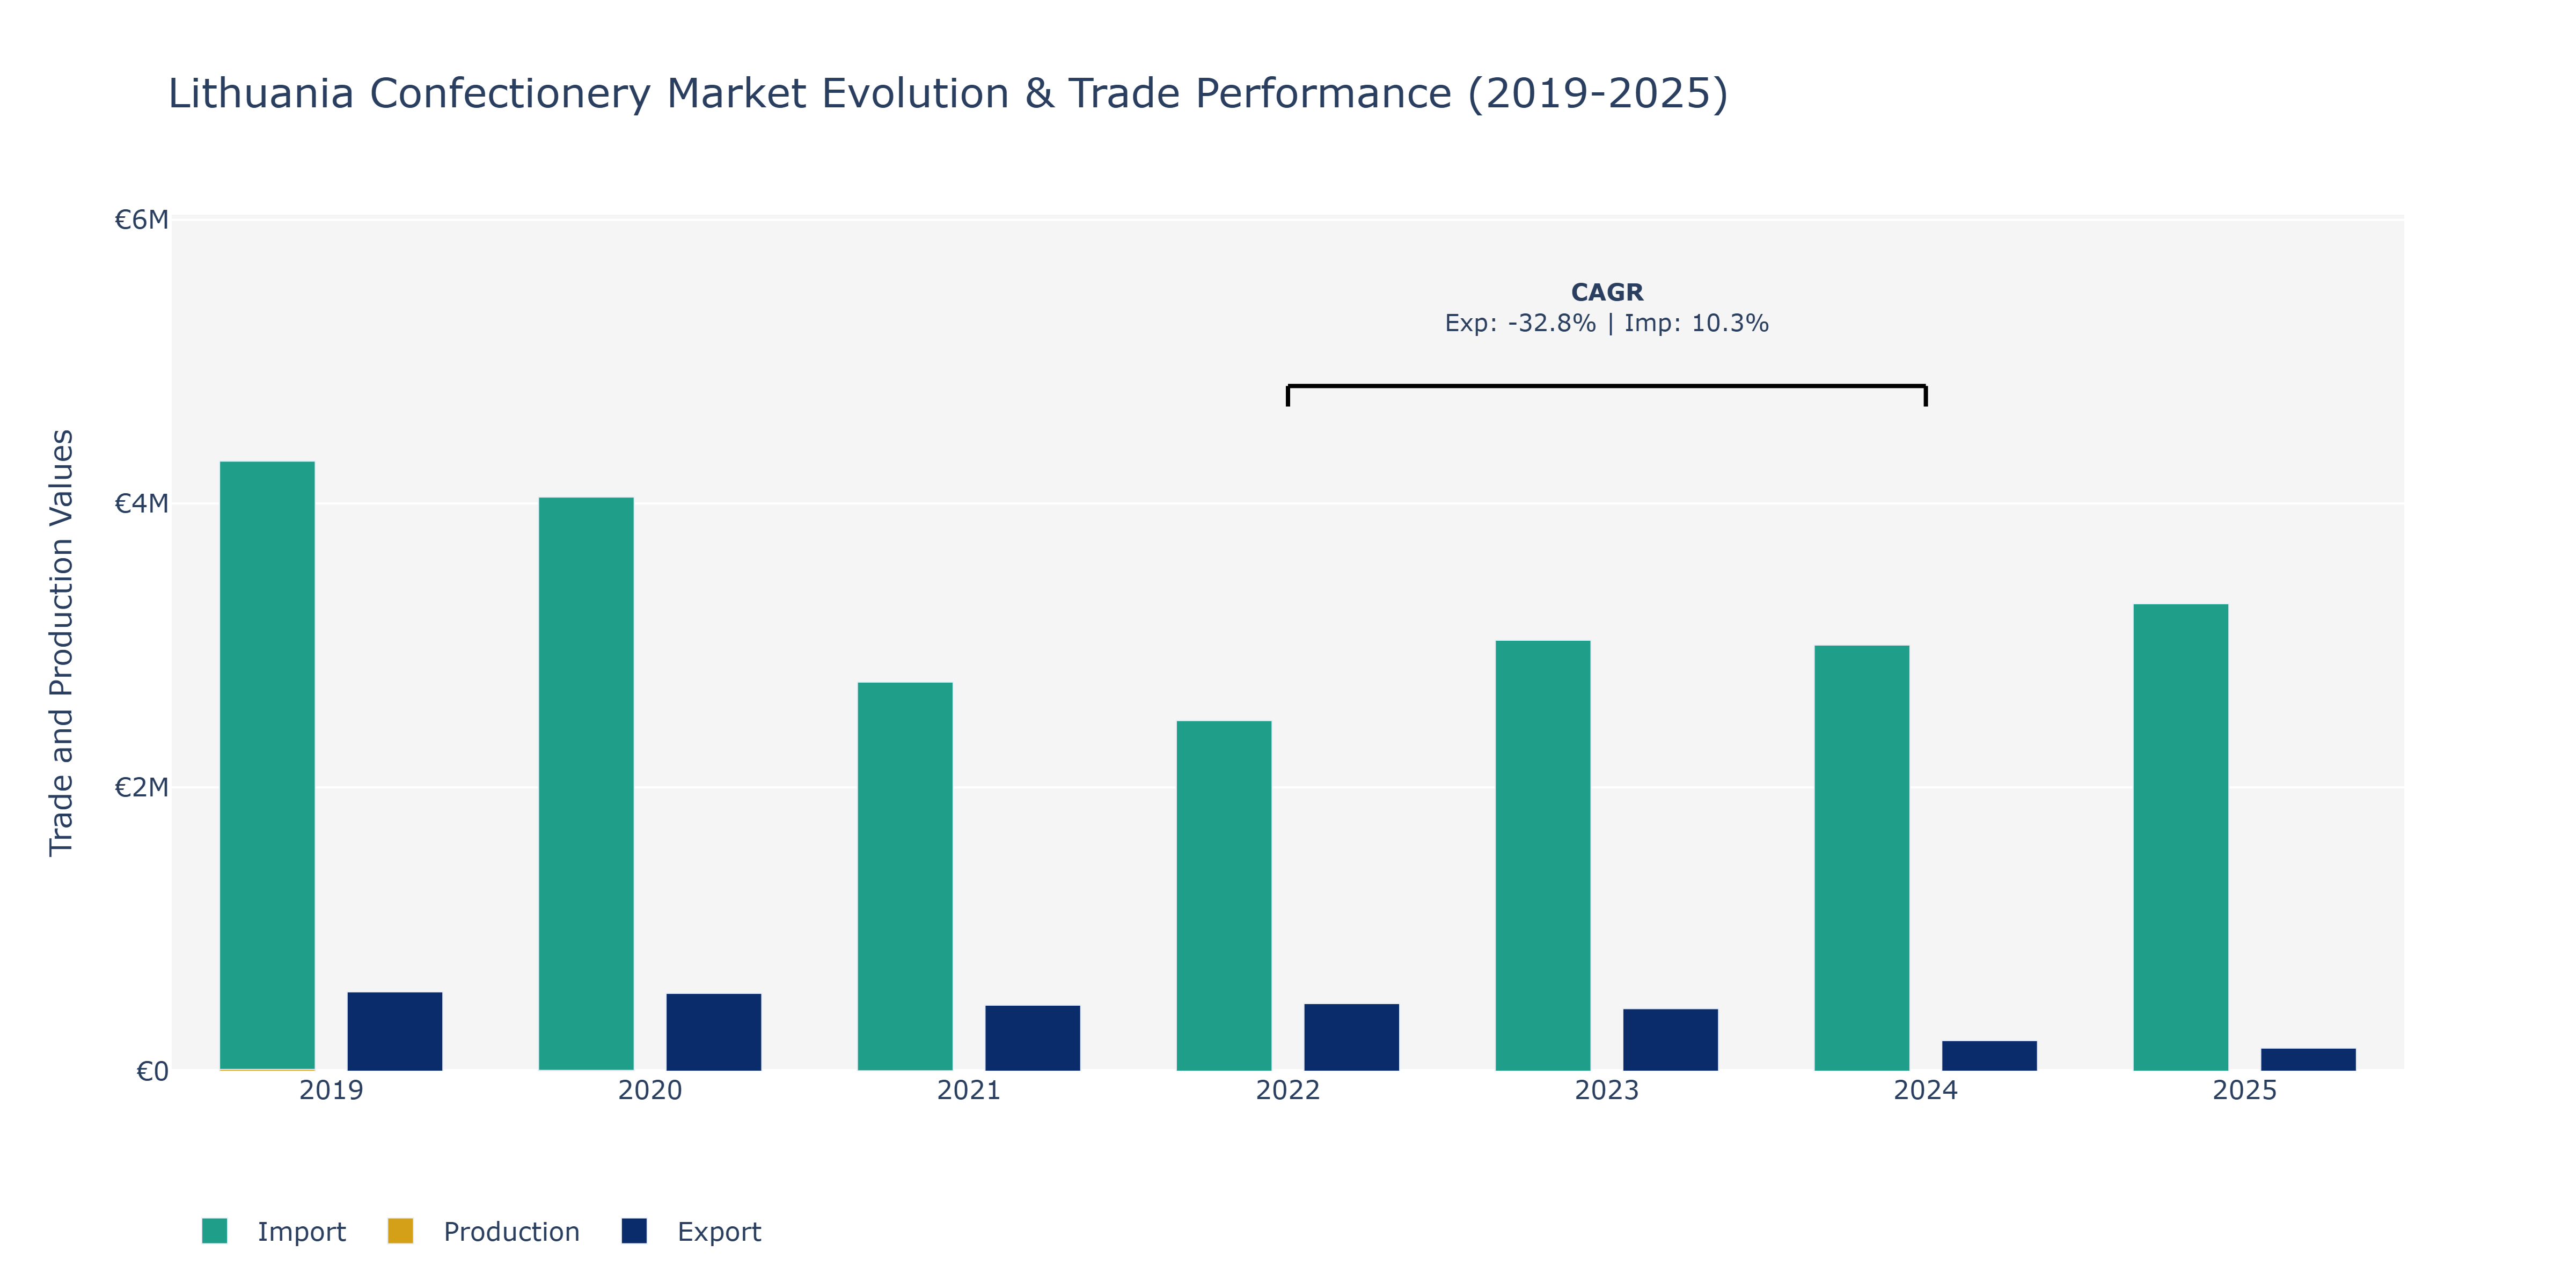
In the Lithuania Confectionery Market, from 2019 to 2025, there were notable fluctuations in Exports, Imports, and Production. Exports witnessed a steady decline, from €558.74 thousand in 2019 to €162.12 thousand in 2025. This decline can be attributed to changing consumer preferences, increased competition, and potentially lower demand in key export markets. Imports, on the other hand, fluctuated with a peak in 2019 at €4.3 million and a subsequent decrease to €3.29 million in 2025. The fluctuations in Imports may be influenced by variations in raw material costs, currency exchange rates, and global trade dynamics. Production levels also showed a declining trend, from €12.42 billion in 2019 to €3.00 billion in 2021, indicating potential challenges in the domestic manufacturing sector such as rising production costs and supply chain disruptions. The market may benefit from strategies that enhance product innovation, improve cost-efficiency, and expand into emerging markets to counteract these downward trends.
Key Highlights of the Report:
- Lithuania Confectionery Market Outlook
- Market Size of Lithuania Confectionery Market, 2025
- Forecast of Lithuania Confectionery Market, 2032
- Historical Data and Forecast of Lithuania Confectionery Revenues & Volume for the Period 2022 - 2032F
- Lithuania Confectionery Market Trend Evolution
- Lithuania Confectionery Market Drivers and Challenges
- Lithuania Confectionery Price Trends
- Lithuania Confectionery Porter`s Five Forces
- Lithuania Confectionery Industry Life Cycle
- Historical Data and Forecast of Lithuania Confectionery Market Revenues & Volume By Type for the Period 2022 - 2032F
- Historical Data and Forecast of Lithuania Confectionery Market Revenues & Volume By Sugar for the Period 2022 - 2032F
- Historical Data and Forecast of Lithuania Confectionery Market Revenues & Volume By Chocolate for the Period 2022 - 2032F
- Historical Data and Forecast of Lithuania Confectionery Market Revenues & Volume By Fine Bakery Wares for the Period 2022 - 2032F
- Historical Data and Forecast of Lithuania Confectionery Market Revenues & Volume By Others for the Period 2022 - 2032F
- Historical Data and Forecast of Lithuania Confectionery Market Revenues & Volume By Distribution Channel for the Period 2022 - 2032F
- Historical Data and Forecast of Lithuania Confectionery Market Revenues & Volume By Supermarket/Hypermarket for the Period 2022 - 2032F
- Historical Data and Forecast of Lithuania Confectionery Market Revenues & Volume By Specialist Retailers for the Period 2022 - 2032F
- Historical Data and Forecast of Lithuania Confectionery Market Revenues & Volume By Online Retail Stores for the Period 2022 - 2032F
- Historical Data and Forecast of Lithuania Confectionery Market Revenues & Volume By Convenience Stores for the Period 2022 - 2032F
- Historical Data and Forecast of Lithuania Confectionery Market Revenues & Volume By Other Distribution Channels for the Period 2022 - 2032F
- Lithuania Confectionery Import Export Trade Statistics
- Market Opportunity Assessment By Type
- Market Opportunity Assessment By Distribution Channel
- Lithuania Confectionery Top Companies Market Share
- Lithuania Confectionery Competitive Benchmarking By Technical and Operational Parameters
- Lithuania Confectionery Company Profiles
- Lithuania Confectionery Key Strategic Recommendations
Frequently Asked Questions About the Market Study (FAQs):
6Wresearch actively monitors the Lithuania Confectionery Market and publishes its comprehensive annual report, highlighting emerging trends, growth drivers, revenue analysis, and forecast outlook. Our insights help businesses to make data-backed strategic decisions with ongoing market dynamics. Our analysts track relevent industries related to the Lithuania Confectionery Market, allowing our clients with actionable intelligence and reliable forecasts tailored to emerging regional needs.
Yes, we provide customisation as per your requirements. To learn more, feel free to contact us on sales@6wresearch.com
1 Executive Summary |
2 Introduction |
2.1 Key Highlights of the Report |
2.2 Report Description |
2.3 Market Scope & Segmentation |
2.4 Research Methodology |
2.5 Assumptions |
3 Lithuania Confectionery Market Overview |
3.1 Lithuania Country Macro Economic Indicators |
3.2 Lithuania Confectionery Market Revenues & Volume, 2022 & 2032F |
3.3 Lithuania Confectionery Market - Industry Life Cycle |
3.4 Lithuania Confectionery Market - Porter's Five Forces |
3.5 Lithuania Confectionery Market Revenues & Volume Share, By Type, 2022 & 2032F |
3.6 Lithuania Confectionery Market Revenues & Volume Share, By Distribution Channel, 2022 & 2032F |
4 Lithuania Confectionery Market Dynamics |
4.1 Impact Analysis |
4.2 Market Drivers |
4.2.1 Increasing disposable income of consumers in Lithuania |
4.2.2 Growing trend of gifting confectionery products |
4.2.3 Innovation in product offerings, such as premium and organic confectionery options |
4.3 Market Restraints |
4.3.1 Health concerns leading to a shift towards healthier snack alternatives |
4.3.2 Fluctuating raw material prices impacting production costs |
4.3.3 Intense competition within the confectionery market in Lithuania |
5 Lithuania Confectionery Market Trends |
6 Lithuania Confectionery Market Segmentations |
6.1 Lithuania Confectionery Market, By Type |
6.1.1 Overview and Analysis |
6.1.2 Lithuania Confectionery Market Revenues & Volume, By Sugar, 2022 - 2032F |
6.1.3 Lithuania Confectionery Market Revenues & Volume, By Chocolate, 2022 - 2032F |
6.1.4 Lithuania Confectionery Market Revenues & Volume, By Fine Bakery Wares, 2022 - 2032F |
6.1.5 Lithuania Confectionery Market Revenues & Volume, By Others, 2022 - 2032F |
6.2 Lithuania Confectionery Market, By Distribution Channel |
6.2.1 Overview and Analysis |
6.2.2 Lithuania Confectionery Market Revenues & Volume, By Supermarket/Hypermarket, 2022 - 2032F |
6.2.3 Lithuania Confectionery Market Revenues & Volume, By Specialist Retailers, 2022 - 2032F |
6.2.4 Lithuania Confectionery Market Revenues & Volume, By Online Retail Stores, 2022 - 2032F |
6.2.5 Lithuania Confectionery Market Revenues & Volume, By Convenience Stores, 2022 - 2032F |
6.2.6 Lithuania Confectionery Market Revenues & Volume, By Other Distribution Channels, 2022 - 2032F |
7 Lithuania Confectionery Market Import-Export Trade Statistics |
7.1 Lithuania Confectionery Market Export to Major Countries |
7.2 Lithuania Confectionery Market Imports from Major Countries |
8 Lithuania Confectionery Market Key Performance Indicators |
8.1 Consumer engagement on social media platforms for confectionery brands |
8.2 Number of new product launches and their success rates |
8.3 Market penetration of premium confectionery products |
8.4 Consumer feedback and satisfaction ratings on taste and quality of confectionery products |
8.5 Adoption rate of sustainable packaging practices within the confectionery industry in Lithuania |
9 Lithuania Confectionery Market - Opportunity Assessment |
9.1 Lithuania Confectionery Market Opportunity Assessment, By Type, 2022 & 2032F |
9.2 Lithuania Confectionery Market Opportunity Assessment, By Distribution Channel, 2022 & 2032F |
10 Lithuania Confectionery Market - Competitive Landscape |
10.1 Lithuania Confectionery Market Revenue Share, By Companies, 2025 |
10.2 Lithuania Confectionery Market Competitive Benchmarking, By Operating and Technical Parameters |
11 Company Profiles |
12 Recommendations | 13 Disclaimer |
Global Go To Market Strategy - 2030
Export potential enables firms to identify high-growth global markets with greater confidence by combining advanced trade intelligence with a structured quantitative methodology. The framework analyzes emerging demand trends and country-level import patterns while integrating macroeconomic and trade datasets such as GDP and population forecasts, bilateral import–export flows, tariff structures, elasticity differentials between developed and developing economies, geographic distance, and import demand projections. Using weighted trade values from 2020–2024 as the base period to project country-to-country export potential for 2030, these inputs are operationalized through calculated drivers such as gravity model parameters, tariff impact factors, and projected GDP per-capita growth. Through an analysis of hidden potentials, demand hotspots, and market conditions that are most favorable to success, this method enables firms to focus on target countries, maximize returns, and global expansion with data, backed by accuracy.
By factoring in the projected importer demand gap that is currently unmet and could be potential opportunity, it identifies the potential for the Exporter (Country) among 190 countries, against the general trade analysis, which identifies the biggest importer or exporter.
To discover high-growth global markets and optimize your business strategy:
Click Here
Pricing
- Single User License$ 1,995
- Department License$ 2,400
- Site License$ 3,120
- Global License$ 3,795

Leadership Perspectives from Industry Events
Search
Thought Leadership and Analyst Meet


Our Clients
6WResearch In News
- India Export Attractiveness Tracker 2026
- India Air Conditioner Market Set for Strong Rebound in 2026 After Weather-Led Correction and GST-Driven Recovery: 6Wresearch
- ADAS in India: How Automatic Emergency Braking, Blind Spot Detection & Driver Monitoring are Transforming Road Safety
- Doha a strategic location for EV manufacturing hub: IPA Qatar
- Demand for luxury TVs surging in the GCC, says Samsung
- Empowering Growth: The Thriving Journey of Bangladesh’s Cable Industry
Latest Reports
- Qatar Access and Home Network Market (2026-2032)
- Nicaragua RPG Gaming Market (2026-2032)
- New Zealand RPG Gaming Market (2026-2032)
- Netherlands RPG Gaming Market (2026-2032)
- Nauru RPG Gaming Market (2026-2032)
- Namibia RPG Gaming Market (2026-2032)
- Mozambique RPG Gaming Market (2026-2032)
- Montenegro RPG Gaming Market (2026-2032)
- Mongolia RPG Gaming Market (2026-2032)
- Monaco RPG Gaming Market (2026-2032)
Industry Events and Analyst Meet

EV India Expo 2026

HIMTEX 2026

India Refining Summit 2026

India EV Show 2026

EV tech India Expo 2026
Whitepaper
- Middle East & Africa Commercial Security Market Click here to view more.
- Middle East & Africa Fire Safety Systems & Equipment Market Click here to view more.
- GCC Drone Market Click here to view more.
- Middle East Lighting Fixture Market Click here to view more.
- GCC Physical & Perimeter Security Market Click here to view more.