Lithuania Copper Sulfate Market (2026-2032) | Consumer Insights, Forecast, Competition, Challenges, Opportunities, Value, Industry, Strategy, Restraints, Growth, Drivers, Strategic Insights, Outlook, Supply, Segments, Size, Companies, Investment Trends, Analysis, Demand, Share, Competitive, Pricing Analysis, Segmentation, Trends, Revenue
Market Forecast By Form (Powder, Liquid, Crystals, Others), By Grade (Technical Grade, Industrial Grade, Feed Grade, Others), By Application (Fungicide, Electroplating, Feed Additive, Others), By End-Use (Agriculture, Electronics, Animal Nutrition, Others), By Distribution Channel (Direct Sales, Distributors, Online Sales, Others) And Competitive Landscape
| Product Code: ETC11761722 | Publication Date: Apr 2025 | Updated Date: Apr 2026 | Product Type: Market Research Report | |
| Publisher: 6Wresearch | No. of Pages: 65 | No. of Figures: 34 | No. of Tables: 19 | |
Lithuania Copper Sulfate Market Size (2020-2030)
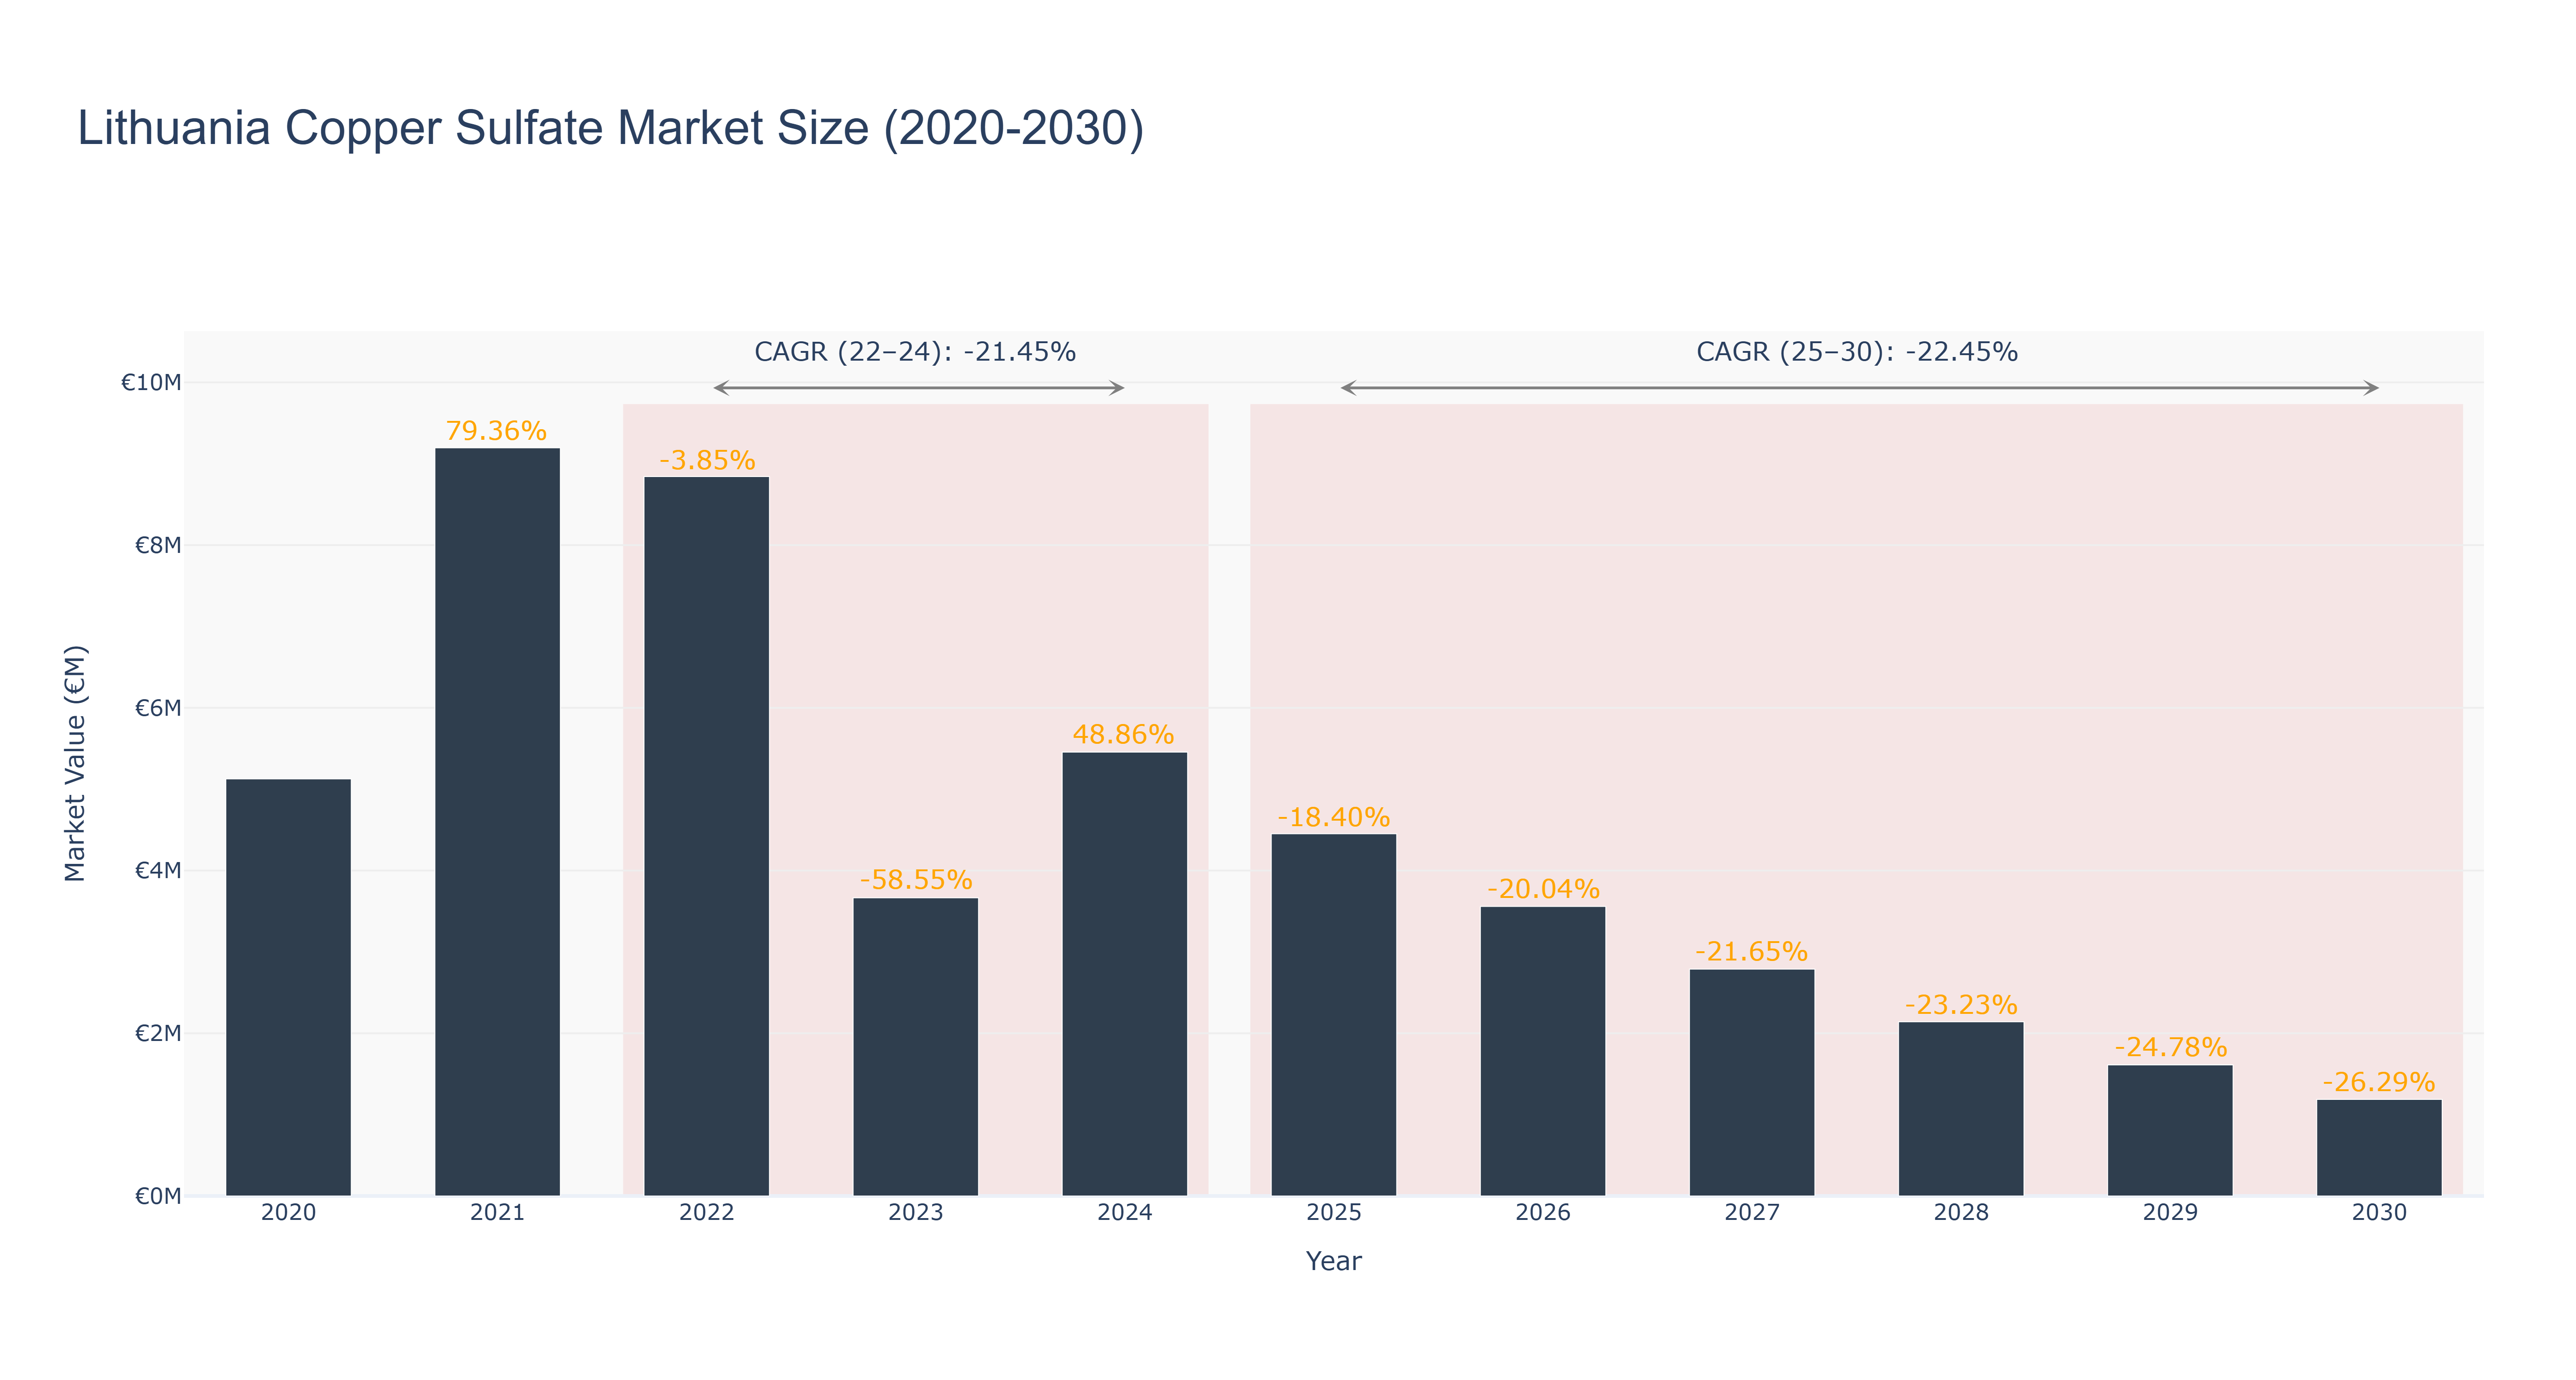
The Lithuania Copper Sulfate Market experienced a peak in 2021 with a market size of €9.20 million, followed by a decline to €3.67 million in 2023. The market is forecasted to further decrease to €1.19 million by 2030, with a CAGR of -22.45% from 2025 to 2030. The recent negative trend can be attributed to various factors such as declining demand due to environmental concerns and increasing competition from alternative products. Looking ahead, the market is expected to focus on sustainable production methods and explore new applications for copper sulfate in industries like agriculture and healthcare. Future projects may involve collaborations with research institutions to develop innovative uses for copper sulfate, potentially revitalizing the market in the long term.
Lithuania Copper Sulfate Market: Production & Trade Performance (2019-2025)
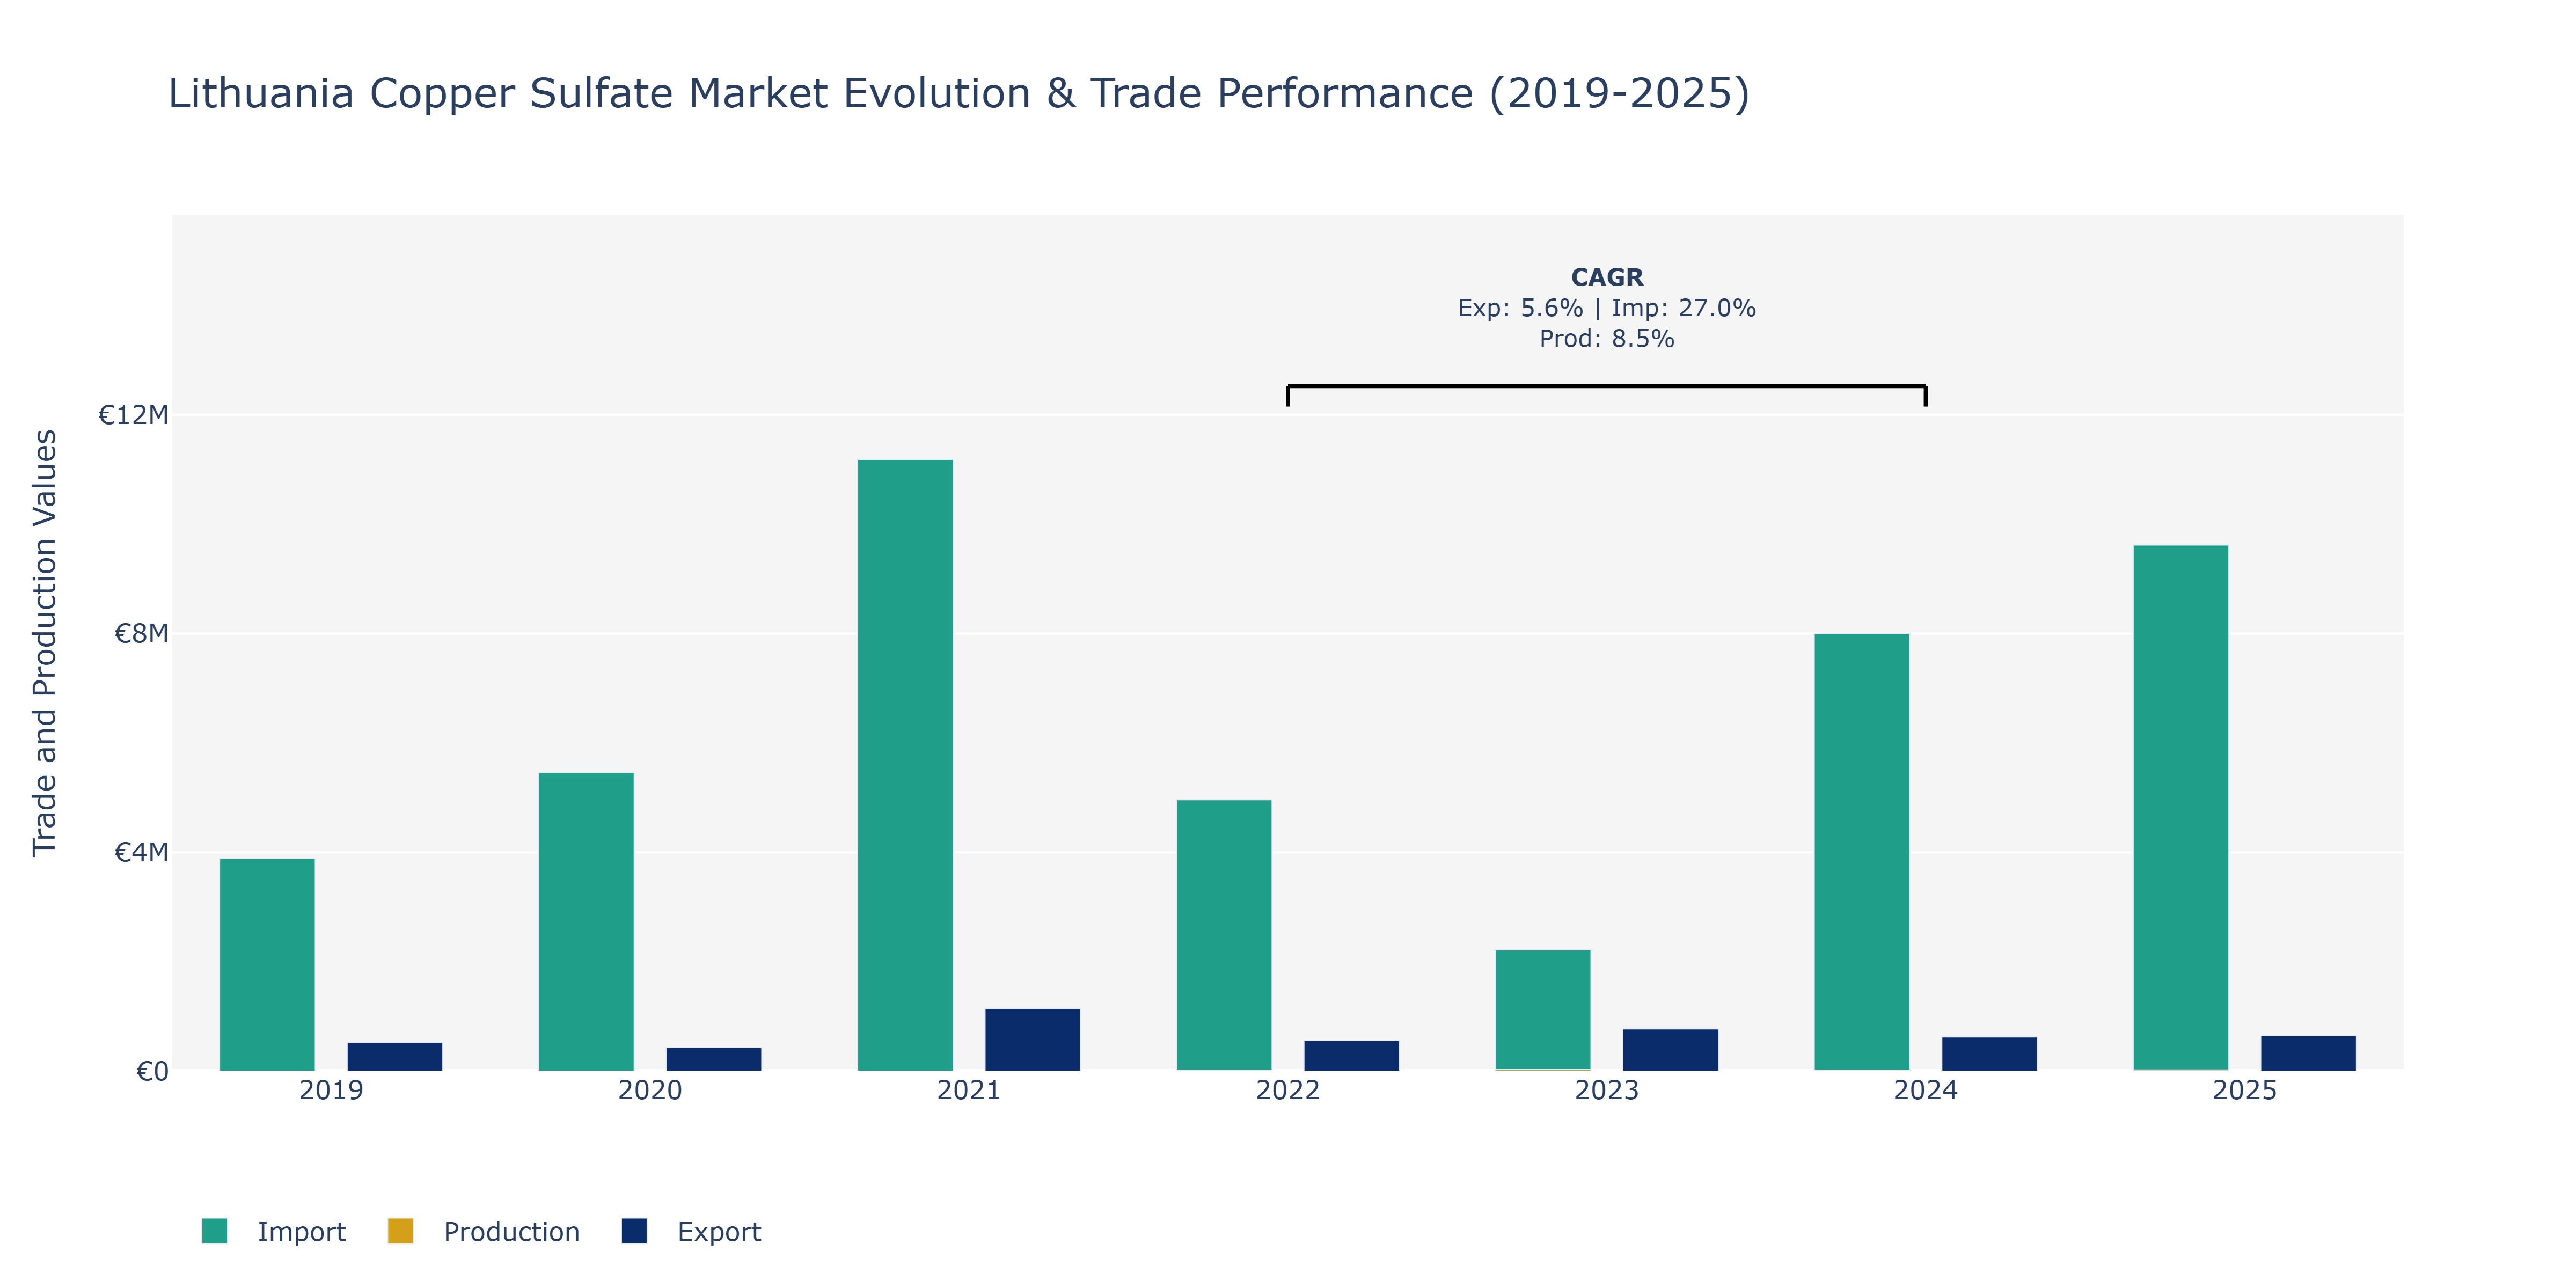
The Lithuania Copper Sulfate Market witnessed notable fluctuations in exports, imports, and production over the years. In 2019, exports stood at €527.79 thousand, which experienced a decrease in 2020 to €432.31 thousand, before witnessing a substantial surge to €1.15 million in 2021. This increase can be attributed to growing global demand for copper sulfate, possibly driven by its applications in agriculture and the electronics industry. Imports followed a similar trend, with a significant rise from €3.89 million in 2019 to €11.18 million in 2021. Such a surge may indicate increased domestic consumption or supply chain adjustments. Production volumes also varied, with a noticeable increase from €17 million in 2022 to €20 million in 2024, reflecting potential capacity expansions or operational enhancements in response to market dynamics. The consistent growth in production could be linked to advancements in manufacturing technologies or strategic investments in production facilities to meet escalating demand. The market's resilience and adaptability to changing trade dynamics and consumer needs are evident, underpinned by a CAGR of 8.47% in production from 2022 to 2024, indicating a steady growth trajectory supported by innovative practices and market strategies.
Key Highlights of the Report:
- Lithuania Copper Sulfate Market Outlook
- Market Size of Lithuania Copper Sulfate Market, 2025
- Forecast of Lithuania Copper Sulfate Market, 2032
- Historical Data and Forecast of Lithuania Copper Sulfate Revenues & Volume for the Period 2022 - 2032F
- Lithuania Copper Sulfate Market Trend Evolution
- Lithuania Copper Sulfate Market Drivers and Challenges
- Lithuania Copper Sulfate Price Trends
- Lithuania Copper Sulfate Porter's Five Forces
- Lithuania Copper Sulfate Industry Life Cycle
- Historical Data and Forecast of Lithuania Copper Sulfate Market Revenues & Volume By Form for the Period 2022 - 2032F
- Historical Data and Forecast of Lithuania Copper Sulfate Market Revenues & Volume By Powder for the Period 2022 - 2032F
- Historical Data and Forecast of Lithuania Copper Sulfate Market Revenues & Volume By Liquid for the Period 2022 - 2032F
- Historical Data and Forecast of Lithuania Copper Sulfate Market Revenues & Volume By Crystals for the Period 2022 - 2032F
- Historical Data and Forecast of Lithuania Copper Sulfate Market Revenues & Volume By Others for the Period 2022 - 2032F
- Historical Data and Forecast of Lithuania Copper Sulfate Market Revenues & Volume By Grade for the Period 2022 - 2032F
- Historical Data and Forecast of Lithuania Copper Sulfate Market Revenues & Volume By Technical Grade for the Period 2022 - 2032F
- Historical Data and Forecast of Lithuania Copper Sulfate Market Revenues & Volume By Industrial Grade for the Period 2022 - 2032F
- Historical Data and Forecast of Lithuania Copper Sulfate Market Revenues & Volume By Feed Grade for the Period 2022 - 2032F
- Historical Data and Forecast of Lithuania Copper Sulfate Market Revenues & Volume By Others for the Period 2022 - 2032F
- Historical Data and Forecast of Lithuania Copper Sulfate Market Revenues & Volume By Application for the Period 2022 - 2032F
- Historical Data and Forecast of Lithuania Copper Sulfate Market Revenues & Volume By Fungicide for the Period 2022 - 2032F
- Historical Data and Forecast of Lithuania Copper Sulfate Market Revenues & Volume By Electroplating for the Period 2022 - 2032F
- Historical Data and Forecast of Lithuania Copper Sulfate Market Revenues & Volume By Feed Additive for the Period 2022 - 2032F
- Historical Data and Forecast of Lithuania Copper Sulfate Market Revenues & Volume By Others for the Period 2022 - 2032F
- Historical Data and Forecast of Lithuania Copper Sulfate Market Revenues & Volume By End-Use for the Period 2022 - 2032F
- Historical Data and Forecast of Lithuania Copper Sulfate Market Revenues & Volume By Agriculture for the Period 2022 - 2032F
- Historical Data and Forecast of Lithuania Copper Sulfate Market Revenues & Volume By Electronics for the Period 2022 - 2032F
- Historical Data and Forecast of Lithuania Copper Sulfate Market Revenues & Volume By Animal Nutrition for the Period 2022 - 2032F
- Historical Data and Forecast of Lithuania Copper Sulfate Market Revenues & Volume By Others for the Period 2022 - 2032F
- Historical Data and Forecast of Lithuania Copper Sulfate Market Revenues & Volume By Distribution Channel for the Period 2022 - 2032F
- Historical Data and Forecast of Lithuania Copper Sulfate Market Revenues & Volume By Direct Sales for the Period 2022 - 2032F
- Historical Data and Forecast of Lithuania Copper Sulfate Market Revenues & Volume By Distributors for the Period 2022 - 2032F
- Historical Data and Forecast of Lithuania Copper Sulfate Market Revenues & Volume By Online Sales for the Period 2022 - 2032F
- Historical Data and Forecast of Lithuania Copper Sulfate Market Revenues & Volume By Others for the Period 2022 - 2032F
- Lithuania Copper Sulfate Import Export Trade Statistics
- Market Opportunity Assessment By Form
- Market Opportunity Assessment By Grade
- Market Opportunity Assessment By Application
- Market Opportunity Assessment By End-Use
- Market Opportunity Assessment By Distribution Channel
- Lithuania Copper Sulfate Top Companies Market Share
- Lithuania Copper Sulfate Competitive Benchmarking By Technical and Operational Parameters
- Lithuania Copper Sulfate Company Profiles
- Lithuania Copper Sulfate Key Strategic Recommendations
Frequently Asked Questions About the Market Study (FAQs):
6Wresearch actively monitors the Lithuania Copper Sulfate Market and publishes its comprehensive annual report, highlighting emerging trends, growth drivers, revenue analysis, and forecast outlook. Our insights help businesses to make data-backed strategic decisions with ongoing market dynamics. Our analysts track relevent industries related to the Lithuania Copper Sulfate Market, allowing our clients with actionable intelligence and reliable forecasts tailored to emerging regional needs.
Yes, we provide customisation as per your requirements. To learn more, feel free to contact us on sales@6wresearch.com
1 Executive Summary |
2 Introduction |
2.1 Key Highlights of the Report |
2.2 Report Description |
2.3 Market Scope & Segmentation |
2.4 Research Methodology |
2.5 Assumptions |
3 Lithuania Copper Sulfate Market Overview |
3.1 Lithuania Country Macro Economic Indicators |
3.2 Lithuania Copper Sulfate Market Revenues & Volume, 2022 & 2032F |
3.3 Lithuania Copper Sulfate Market - Industry Life Cycle |
3.4 Lithuania Copper Sulfate Market - Porter's Five Forces |
3.5 Lithuania Copper Sulfate Market Revenues & Volume Share, By Form, 2022 & 2032F |
3.6 Lithuania Copper Sulfate Market Revenues & Volume Share, By Grade, 2022 & 2032F |
3.7 Lithuania Copper Sulfate Market Revenues & Volume Share, By Application, 2022 & 2032F |
3.8 Lithuania Copper Sulfate Market Revenues & Volume Share, By End-Use, 2022 & 2032F |
3.9 Lithuania Copper Sulfate Market Revenues & Volume Share, By Distribution Channel, 2022 & 2032F |
4 Lithuania Copper Sulfate Market Dynamics |
4.1 Impact Analysis |
4.2 Market Drivers |
4.2.1 Increasing demand for copper sulfate in agriculture for crop protection and fertilization purposes |
4.2.2 Growing adoption of copper sulfate in the mining industry for ore flotation and treatment applications |
4.2.3 Rising awareness about the benefits of copper sulfate in animal feed supplements and water treatment |
4.3 Market Restraints |
4.3.1 Fluctuating prices of copper and sulfur, which are key raw materials for copper sulfate production |
4.3.2 Stringent regulations regarding the environmental impact of copper sulfate usage |
4.3.3 Competition from alternative products and substitutes in various applications |
5 Lithuania Copper Sulfate Market Trends |
6 Lithuania Copper Sulfate Market, By Types |
6.1 Lithuania Copper Sulfate Market, By Form |
6.1.1 Overview and Analysis |
6.1.2 Lithuania Copper Sulfate Market Revenues & Volume, By Form, 2022 - 2032F |
6.1.3 Lithuania Copper Sulfate Market Revenues & Volume, By Powder, 2022 - 2032F |
6.1.4 Lithuania Copper Sulfate Market Revenues & Volume, By Liquid, 2022 - 2032F |
6.1.5 Lithuania Copper Sulfate Market Revenues & Volume, By Crystals, 2022 - 2032F |
6.1.6 Lithuania Copper Sulfate Market Revenues & Volume, By Others, 2022 - 2032F |
6.2 Lithuania Copper Sulfate Market, By Grade |
6.2.1 Overview and Analysis |
6.2.2 Lithuania Copper Sulfate Market Revenues & Volume, By Technical Grade, 2022 - 2032F |
6.2.3 Lithuania Copper Sulfate Market Revenues & Volume, By Industrial Grade, 2022 - 2032F |
6.2.4 Lithuania Copper Sulfate Market Revenues & Volume, By Feed Grade, 2022 - 2032F |
6.2.5 Lithuania Copper Sulfate Market Revenues & Volume, By Others, 2022 - 2032F |
6.3 Lithuania Copper Sulfate Market, By Application |
6.3.1 Overview and Analysis |
6.3.2 Lithuania Copper Sulfate Market Revenues & Volume, By Fungicide, 2022 - 2032F |
6.3.3 Lithuania Copper Sulfate Market Revenues & Volume, By Electroplating, 2022 - 2032F |
6.3.4 Lithuania Copper Sulfate Market Revenues & Volume, By Feed Additive, 2022 - 2032F |
6.3.5 Lithuania Copper Sulfate Market Revenues & Volume, By Others, 2022 - 2032F |
6.4 Lithuania Copper Sulfate Market, By End-Use |
6.4.1 Overview and Analysis |
6.4.2 Lithuania Copper Sulfate Market Revenues & Volume, By Agriculture, 2022 - 2032F |
6.4.3 Lithuania Copper Sulfate Market Revenues & Volume, By Electronics, 2022 - 2032F |
6.4.4 Lithuania Copper Sulfate Market Revenues & Volume, By Animal Nutrition, 2022 - 2032F |
6.4.5 Lithuania Copper Sulfate Market Revenues & Volume, By Others, 2022 - 2032F |
6.5 Lithuania Copper Sulfate Market, By Distribution Channel |
6.5.1 Overview and Analysis |
6.5.2 Lithuania Copper Sulfate Market Revenues & Volume, By Direct Sales, 2022 - 2032F |
6.5.3 Lithuania Copper Sulfate Market Revenues & Volume, By Distributors, 2022 - 2032F |
6.5.4 Lithuania Copper Sulfate Market Revenues & Volume, By Online Sales, 2022 - 2032F |
6.5.5 Lithuania Copper Sulfate Market Revenues & Volume, By Others, 2022 - 2032F |
7 Lithuania Copper Sulfate Market Import-Export Trade Statistics |
7.1 Lithuania Copper Sulfate Market Export to Major Countries |
7.2 Lithuania Copper Sulfate Market Imports from Major Countries |
8 Lithuania Copper Sulfate Market Key Performance Indicators |
8.1 Price of copper and sulfur in the global market |
8.2 Number of new product launches or innovations in the copper sulfate market |
8.3 Percentage of agricultural or mining companies using copper sulfate over other chemicals |
8.4 Environmental compliance metrics related to copper sulfate production and usage |
8.5 Adoption rate of copper sulfate in new applications or industries |
9 Lithuania Copper Sulfate Market - Opportunity Assessment |
9.1 Lithuania Copper Sulfate Market Opportunity Assessment, By Form, 2022 & 2032F |
9.2 Lithuania Copper Sulfate Market Opportunity Assessment, By Grade, 2022 & 2032F |
9.3 Lithuania Copper Sulfate Market Opportunity Assessment, By Application, 2022 & 2032F |
9.4 Lithuania Copper Sulfate Market Opportunity Assessment, By End-Use, 2022 & 2032F |
9.5 Lithuania Copper Sulfate Market Opportunity Assessment, By Distribution Channel, 2022 & 2032F |
10 Lithuania Copper Sulfate Market - Competitive Landscape |
10.1 Lithuania Copper Sulfate Market Revenue Share, By Companies, 2025 |
10.2 Lithuania Copper Sulfate Market Competitive Benchmarking, By Operating and Technical Parameters |
11 Company Profiles |
12 Recommendations |
13 Disclaimer |
Global Go To Market Strategy - 2030
Export potential enables firms to identify high-growth global markets with greater confidence by combining advanced trade intelligence with a structured quantitative methodology. The framework analyzes emerging demand trends and country-level import patterns while integrating macroeconomic and trade datasets such as GDP and population forecasts, bilateral import–export flows, tariff structures, elasticity differentials between developed and developing economies, geographic distance, and import demand projections. Using weighted trade values from 2020–2024 as the base period to project country-to-country export potential for 2030, these inputs are operationalized through calculated drivers such as gravity model parameters, tariff impact factors, and projected GDP per-capita growth. Through an analysis of hidden potentials, demand hotspots, and market conditions that are most favorable to success, this method enables firms to focus on target countries, maximize returns, and global expansion with data, backed by accuracy.
By factoring in the projected importer demand gap that is currently unmet and could be potential opportunity, it identifies the potential for the Exporter (Country) among 190 countries, against the general trade analysis, which identifies the biggest importer or exporter.
To discover high-growth global markets and optimize your business strategy:
Click Here
Pricing
- Single User License$ 1,995
- Department License$ 2,400
- Site License$ 3,120
- Global License$ 3,795

Leadership Perspectives from Industry Events
Search
Thought Leadership and Analyst Meet


Our Clients
6WResearch In News
- Doha a strategic location for EV manufacturing hub: IPA Qatar
- Demand for luxury TVs surging in the GCC, says Samsung
- Empowering Growth: The Thriving Journey of Bangladesh’s Cable Industry
- Demand for luxury TVs surging in the GCC, says Samsung
- Video call with a traditional healer? Once unthinkable, it’s now common in South Africa
- Intelligent Buildings To Smooth GCC’s Path To Net Zero
Latest Reports
- Cape Verde Portable Hand-Thrown Extinguisher Market (2026-2032)
- Canada Portable Hand-Thrown Extinguisher Market (2026-2032)
- Cameroon Portable Hand-Thrown Extinguisher Market (2026-2032)
- Burundi Portable Hand-Thrown Extinguisher Market (2026-2032)
- Burkina Faso Portable Hand-Thrown Extinguisher Market (2026-2032)
- Bulgaria Portable Hand-Thrown Extinguisher Market (2026-2032)
- Brunei Portable Hand-Thrown Extinguisher Market (2026-2032)
- Botswana Portable Hand-Thrown Extinguisher Market (2026-2032)
- Bosnia and Herzegovina Portable Hand-Thrown Extinguisher Market (2026-2032)
- Bolivia Portable Hand-Thrown Extinguisher Market (2026-2032)
Industry Events and Analyst Meet

HIMTEX 2026

India Refining Summit 2026

India EV Show 2026

EV tech India Expo 2026

Auto Tech Asia 2026
Whitepaper
- Middle East & Africa Commercial Security Market Click here to view more.
- Middle East & Africa Fire Safety Systems & Equipment Market Click here to view more.
- GCC Drone Market Click here to view more.
- Middle East Lighting Fixture Market Click here to view more.
- GCC Physical & Perimeter Security Market Click here to view more.