Lithuania LDPE Market (2026-2032) | Segments, Share, Demand, Supply, Segmentation, Size, Trends, Revenue, Value, Strategic Insights, Growth, Forecast, Strategy, Industry, Companies, Consumer Insights, Pricing Analysis, Competitive, Investment Trends, Challenges, Opportunities, Competition, Outlook, Drivers, Restraints, Analysis
Market Forecast By Form (Pellets, Sheets, Granules, Powder, Films), By Application (Packaging Films, Agricultural Films, Injection Molded Products, Coatings, Liners), By Processing Technique (Extrusion, Blow Molding, Injection Molding, Rotational Molding, Film Casting), By Density (Low Density, Medium Density, High Density, Very Low Density, Linear Density), By Additives (UV Stabilizers, Antioxidants, Slip Agents, Anti-Blocking Agents, Flame Retardants) And Competitive Landscape
| Product Code: ETC12644154 | Publication Date: Apr 2025 | Updated Date: Apr 2026 | Product Type: Market Research Report | |
| Publisher: 6Wresearch | No. of Pages: 65 | No. of Figures: 34 | No. of Tables: 19 | |
Lithuania Ldpe Market Size (2020-2030)
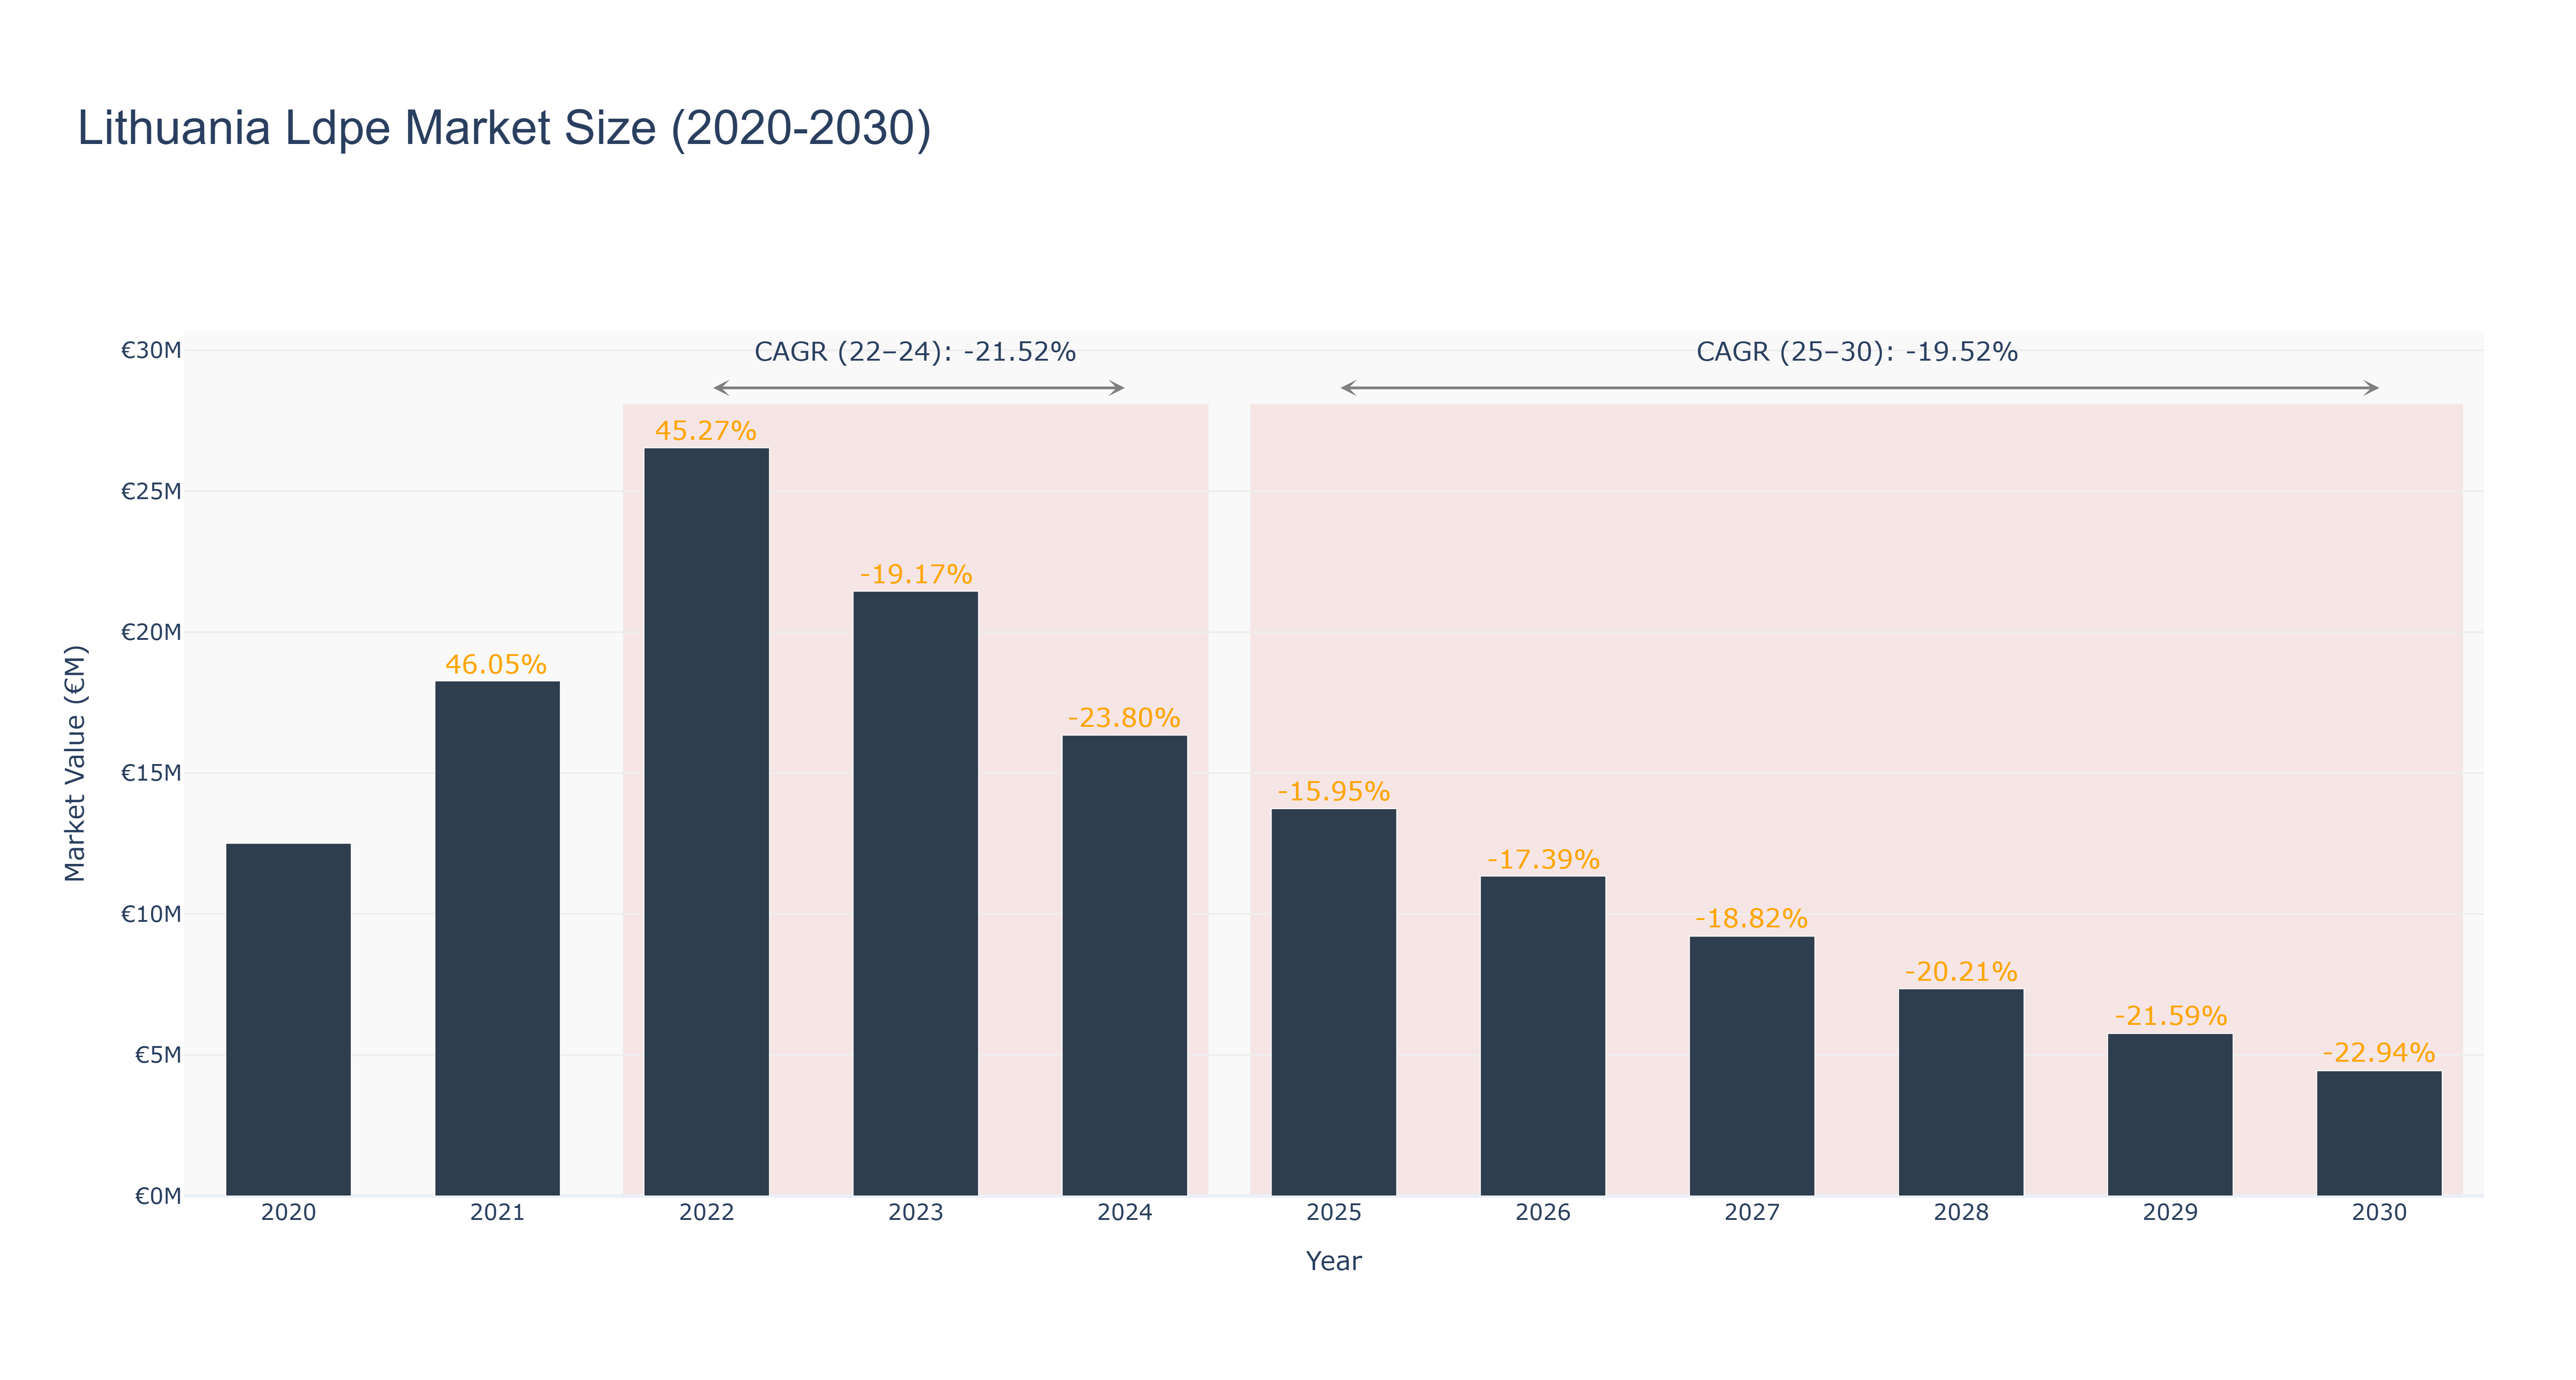
Lithuania LDPE Market has seen fluctuations in market size over the years. The peak market size of €26.54 million was recorded in 2022, followed by a decline to €4.44 million forecasted for 2030. The market experienced a significant drop from 2023 to 2025, attributed to economic uncertainties impacting demand. The negative compound annual growth rates (CAGR) of -21.52% (2022-24) and -19.52% (2025-30) reflect the challenging market conditions. Looking ahead, industry drivers such as environmental regulations and technological advancements are expected to shape the market landscape. Future developments in recycling infrastructure and sustainable packaging initiatives are anticipated to drive growth in the Lithuania LDPE market, aligning with the country's sustainability goals.
Lithuania Ldpe Market: Production & Trade Performance (2019-2025)
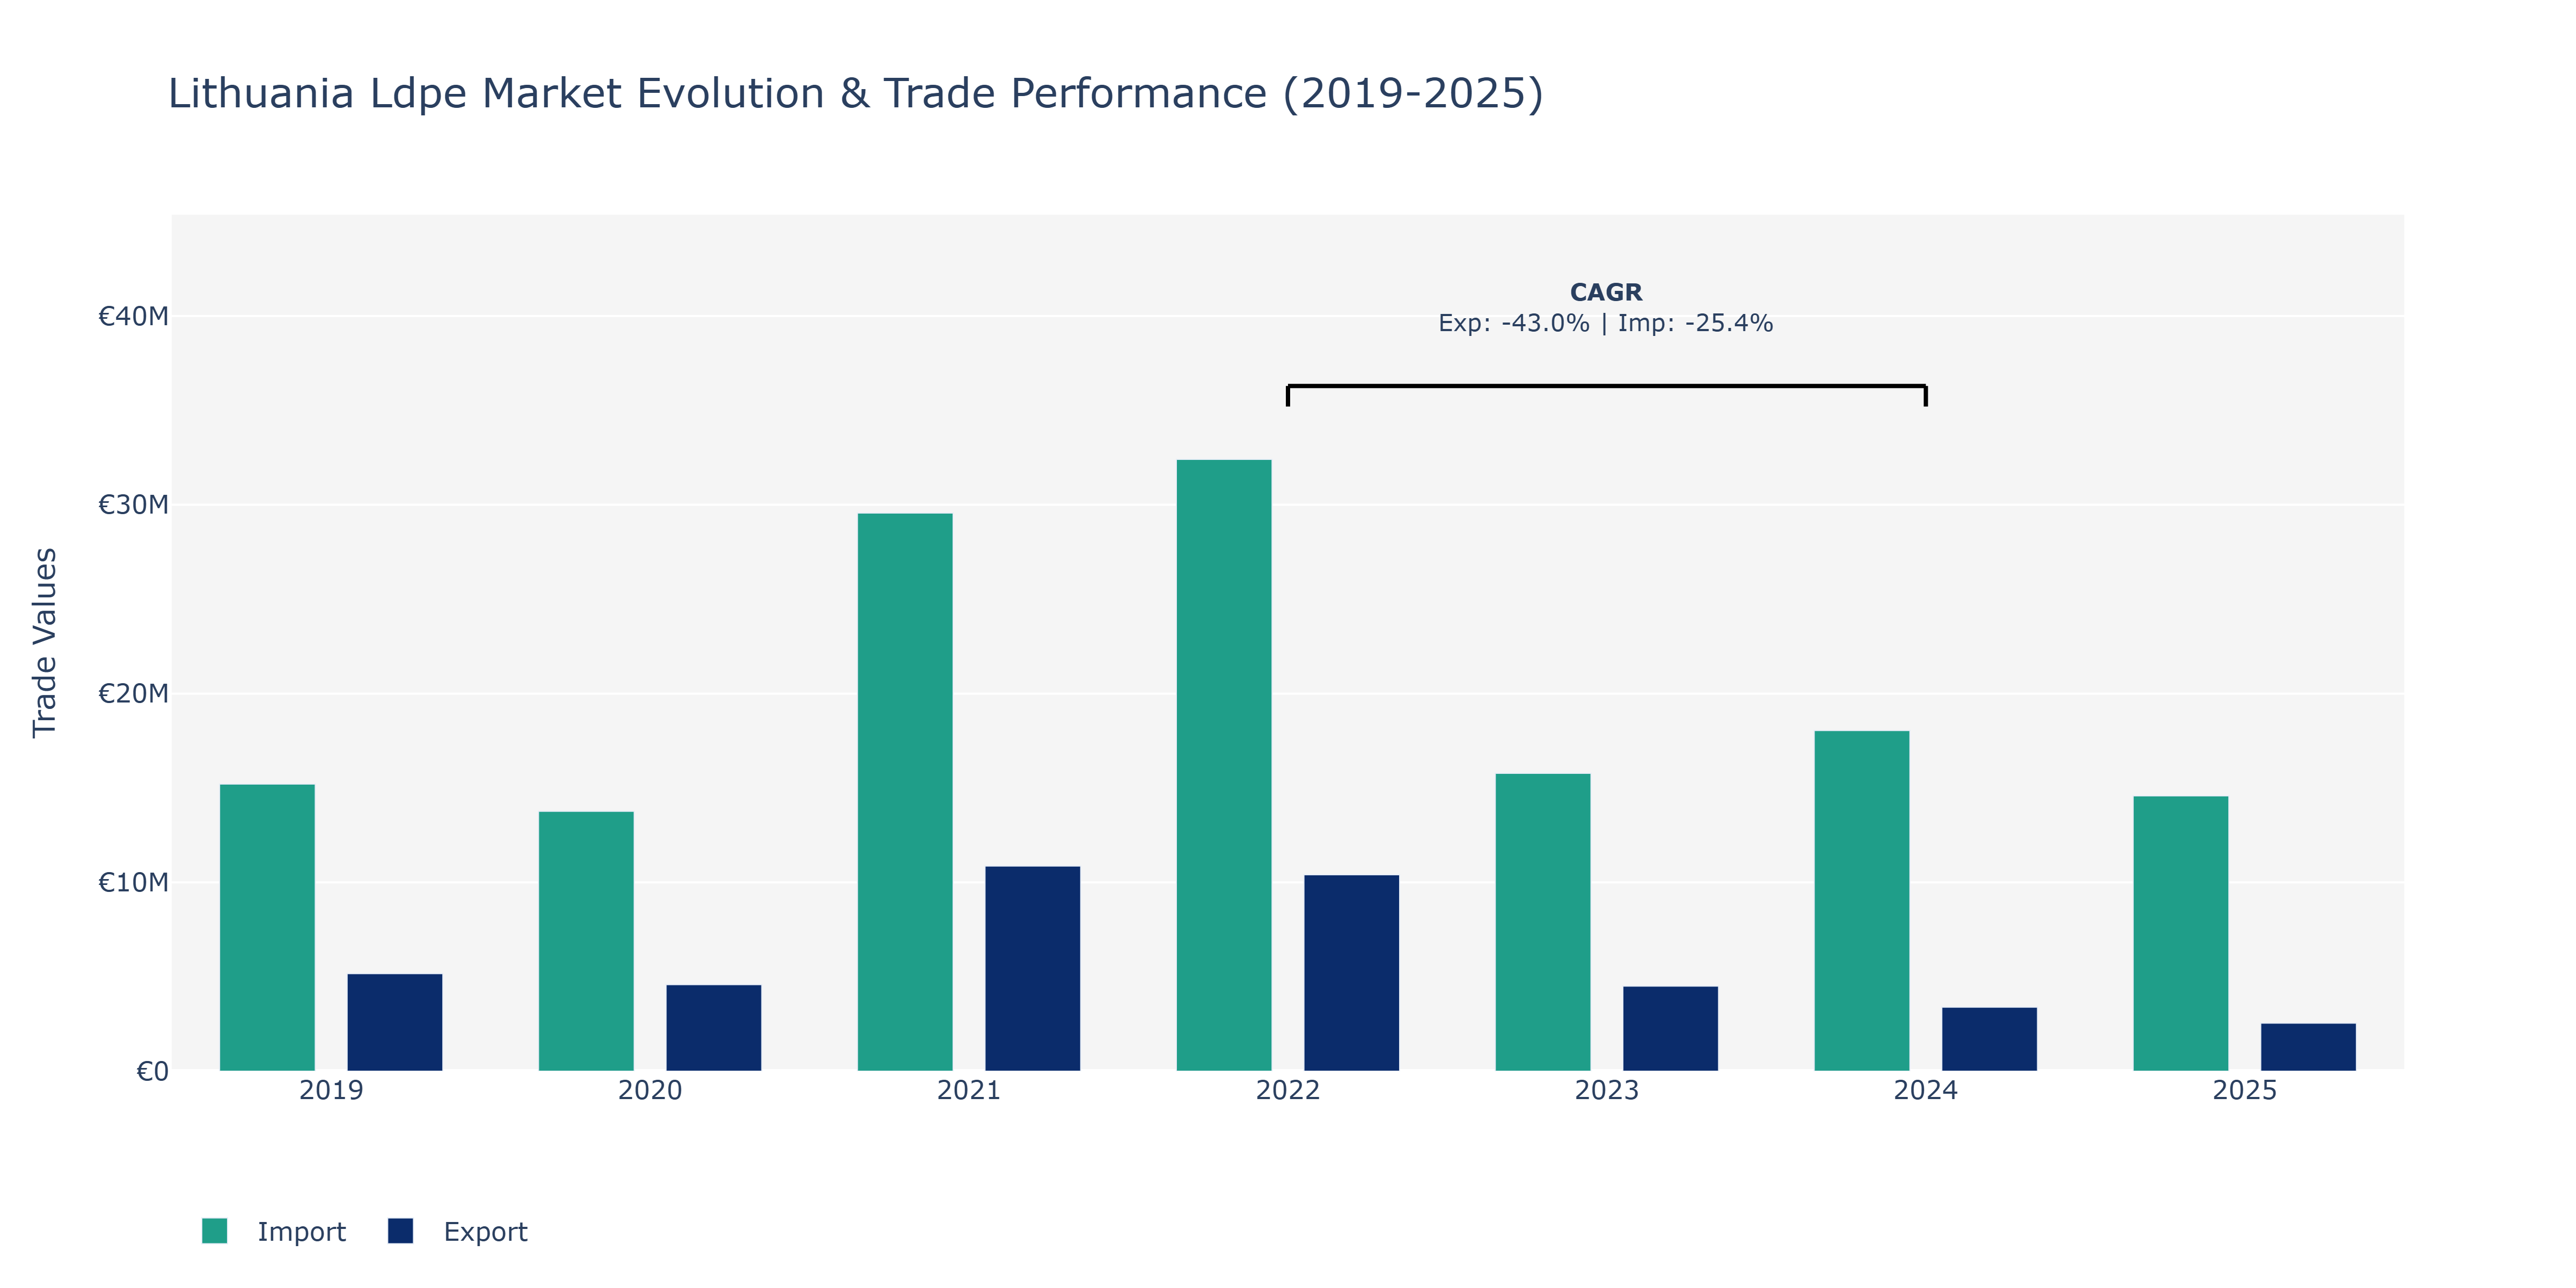
Between 2019 and 2025, Lithuania's LDPE market witnessed varying trends in both exports and imports. In 2019, exports amounted to €5.17 million, while imports stood at €15.21 million. A notable surge occurred in 2021, with exports soaring to €10.87 million and imports reaching €29.56 million. However, a sharp decline followed in 2022, with exports falling to €10.41 million and imports to €32.4 million. Subsequently, both exports and imports experienced a significant drop in 2023 and continued to decrease in 2024. By 2025, exports were at €2.55 million, and imports stood at €14.58 million. These fluctuations could be attributed to global economic conditions, shifts in demand, and supply chain disruptions. The negative CAGR for both exports (-42.95%) and imports (-25.38%) from 2022 to 2024 reflects challenges faced by the LDPE market in Lithuania, potentially influenced by geopolitical factors and changing trade dynamics in the plastics industry, as reported by industry publications such as Plastics News.
Key Highlights of the Report:
- Lithuania LDPE Market Outlook
- Market Size of Lithuania LDPE Market, 2025
- Forecast of Lithuania LDPE Market, 2032
- Historical Data and Forecast of Lithuania LDPE Revenues & Volume for the Period 2022 - 2032F
- Lithuania LDPE Market Trend Evolution
- Lithuania LDPE Market Drivers and Challenges
- Lithuania LDPE Price Trends
- Lithuania LDPE Porter's Five Forces
- Lithuania LDPE Industry Life Cycle
- Historical Data and Forecast of Lithuania LDPE Market Revenues & Volume By Form for the Period 2022 - 2032F
- Historical Data and Forecast of Lithuania LDPE Market Revenues & Volume By Pellets for the Period 2022 - 2032F
- Historical Data and Forecast of Lithuania LDPE Market Revenues & Volume By Sheets for the Period 2022 - 2032F
- Historical Data and Forecast of Lithuania LDPE Market Revenues & Volume By Granules for the Period 2022 - 2032F
- Historical Data and Forecast of Lithuania LDPE Market Revenues & Volume By Powder for the Period 2022 - 2032F
- Historical Data and Forecast of Lithuania LDPE Market Revenues & Volume By Films for the Period 2022 - 2032F
- Historical Data and Forecast of Lithuania LDPE Market Revenues & Volume By Application for the Period 2022 - 2032F
- Historical Data and Forecast of Lithuania LDPE Market Revenues & Volume By Packaging Films for the Period 2022 - 2032F
- Historical Data and Forecast of Lithuania LDPE Market Revenues & Volume By Agricultural Films for the Period 2022 - 2032F
- Historical Data and Forecast of Lithuania LDPE Market Revenues & Volume By Injection Molded Products for the Period 2022 - 2032F
- Historical Data and Forecast of Lithuania LDPE Market Revenues & Volume By Coatings for the Period 2022 - 2032F
- Historical Data and Forecast of Lithuania LDPE Market Revenues & Volume By Liners for the Period 2022 - 2032F
- Historical Data and Forecast of Lithuania LDPE Market Revenues & Volume By Processing Technique for the Period 2022 - 2032F
- Historical Data and Forecast of Lithuania LDPE Market Revenues & Volume By Extrusion for the Period 2022 - 2032F
- Historical Data and Forecast of Lithuania LDPE Market Revenues & Volume By Blow Molding for the Period 2022 - 2032F
- Historical Data and Forecast of Lithuania LDPE Market Revenues & Volume By Injection Molding for the Period 2022 - 2032F
- Historical Data and Forecast of Lithuania LDPE Market Revenues & Volume By Rotational Molding for the Period 2022 - 2032F
- Historical Data and Forecast of Lithuania LDPE Market Revenues & Volume By Film Casting for the Period 2022 - 2032F
- Historical Data and Forecast of Lithuania LDPE Market Revenues & Volume By Density for the Period 2022 - 2032F
- Historical Data and Forecast of Lithuania LDPE Market Revenues & Volume By Low Density for the Period 2022 - 2032F
- Historical Data and Forecast of Lithuania LDPE Market Revenues & Volume By Medium Density for the Period 2022 - 2032F
- Historical Data and Forecast of Lithuania LDPE Market Revenues & Volume By High Density for the Period 2022 - 2032F
- Historical Data and Forecast of Lithuania LDPE Market Revenues & Volume By Very Low Density for the Period 2022 - 2032F
- Historical Data and Forecast of Lithuania LDPE Market Revenues & Volume By Linear Density for the Period 2022 - 2032F
- Historical Data and Forecast of Lithuania LDPE Market Revenues & Volume By Additives for the Period 2022 - 2032F
- Historical Data and Forecast of Lithuania LDPE Market Revenues & Volume By UV Stabilizers for the Period 2022 - 2032F
- Historical Data and Forecast of Lithuania LDPE Market Revenues & Volume By Antioxidants for the Period 2022 - 2032F
- Historical Data and Forecast of Lithuania LDPE Market Revenues & Volume By Slip Agents for the Period 2022 - 2032F
- Historical Data and Forecast of Lithuania LDPE Market Revenues & Volume By Anti-Blocking Agents for the Period 2022 - 2032F
- Historical Data and Forecast of Lithuania LDPE Market Revenues & Volume By Flame Retardants for the Period 2022 - 2032F
- Lithuania LDPE Import Export Trade Statistics
- Market Opportunity Assessment By Form
- Market Opportunity Assessment By Application
- Market Opportunity Assessment By Processing Technique
- Market Opportunity Assessment By Density
- Market Opportunity Assessment By Additives
- Lithuania LDPE Top Companies Market Share
- Lithuania LDPE Competitive Benchmarking By Technical and Operational Parameters
- Lithuania LDPE Company Profiles
- Lithuania LDPE Key Strategic Recommendations
Frequently Asked Questions About the Market Study (FAQs):
6Wresearch actively monitors the Lithuania LDPE Market and publishes its comprehensive annual report, highlighting emerging trends, growth drivers, revenue analysis, and forecast outlook. Our insights help businesses to make data-backed strategic decisions with ongoing market dynamics. Our analysts track relevent industries related to the Lithuania LDPE Market, allowing our clients with actionable intelligence and reliable forecasts tailored to emerging regional needs.
Yes, we provide customisation as per your requirements. To learn more, feel free to contact us on sales@6wresearch.com
1 Executive Summary |
2 Introduction |
2.1 Key Highlights of the Report |
2.2 Report Description |
2.3 Market Scope & Segmentation |
2.4 Research Methodology |
2.5 Assumptions |
3 Lithuania LDPE Market Overview |
3.1 Lithuania Country Macro Economic Indicators |
3.2 Lithuania LDPE Market Revenues & Volume, 2022 & 2032F |
3.3 Lithuania LDPE Market - Industry Life Cycle |
3.4 Lithuania LDPE Market - Porter's Five Forces |
3.5 Lithuania LDPE Market Revenues & Volume Share, By Form, 2022 & 2032F |
3.6 Lithuania LDPE Market Revenues & Volume Share, By Application, 2022 & 2032F |
3.7 Lithuania LDPE Market Revenues & Volume Share, By Processing Technique, 2022 & 2032F |
3.8 Lithuania LDPE Market Revenues & Volume Share, By Density, 2022 & 2032F |
3.9 Lithuania LDPE Market Revenues & Volume Share, By Additives, 2022 & 2032F |
4 Lithuania LDPE Market Dynamics |
4.1 Impact Analysis |
4.2 Market Drivers |
4.2.1 Growing demand for flexible packaging solutions in various industries |
4.2.2 Increasing investments in infrastructure development projects |
4.2.3 Favorable government regulations promoting the use of LDPE in packaging and construction sectors |
4.3 Market Restraints |
4.3.1 Volatility in raw material prices affecting production costs |
4.3.2 Competition from alternative packaging materials like HDPE and PP |
4.3.3 Environmental concerns related to the use and disposal of LDPE products |
5 Lithuania LDPE Market Trends |
6 Lithuania LDPE Market, By Types |
6.1 Lithuania LDPE Market, By Form |
6.1.1 Overview and Analysis |
6.1.2 Lithuania LDPE Market Revenues & Volume, By Form, 2022 - 2032F |
6.1.3 Lithuania LDPE Market Revenues & Volume, By Pellets, 2022 - 2032F |
6.1.4 Lithuania LDPE Market Revenues & Volume, By Sheets, 2022 - 2032F |
6.1.5 Lithuania LDPE Market Revenues & Volume, By Granules, 2022 - 2032F |
6.1.6 Lithuania LDPE Market Revenues & Volume, By Powder, 2022 - 2032F |
6.1.7 Lithuania LDPE Market Revenues & Volume, By Films, 2022 - 2032F |
6.2 Lithuania LDPE Market, By Application |
6.2.1 Overview and Analysis |
6.2.2 Lithuania LDPE Market Revenues & Volume, By Packaging Films, 2022 - 2032F |
6.2.3 Lithuania LDPE Market Revenues & Volume, By Agricultural Films, 2022 - 2032F |
6.2.4 Lithuania LDPE Market Revenues & Volume, By Injection Molded Products, 2022 - 2032F |
6.2.5 Lithuania LDPE Market Revenues & Volume, By Coatings, 2022 - 2032F |
6.2.6 Lithuania LDPE Market Revenues & Volume, By Liners, 2022 - 2032F |
6.3 Lithuania LDPE Market, By Processing Technique |
6.3.1 Overview and Analysis |
6.3.2 Lithuania LDPE Market Revenues & Volume, By Extrusion, 2022 - 2032F |
6.3.3 Lithuania LDPE Market Revenues & Volume, By Blow Molding, 2022 - 2032F |
6.3.4 Lithuania LDPE Market Revenues & Volume, By Injection Molding, 2022 - 2032F |
6.3.5 Lithuania LDPE Market Revenues & Volume, By Rotational Molding, 2022 - 2032F |
6.3.6 Lithuania LDPE Market Revenues & Volume, By Film Casting, 2022 - 2032F |
6.4 Lithuania LDPE Market, By Density |
6.4.1 Overview and Analysis |
6.4.2 Lithuania LDPE Market Revenues & Volume, By Low Density, 2022 - 2032F |
6.4.3 Lithuania LDPE Market Revenues & Volume, By Medium Density, 2022 - 2032F |
6.4.4 Lithuania LDPE Market Revenues & Volume, By High Density, 2022 - 2032F |
6.4.5 Lithuania LDPE Market Revenues & Volume, By Very Low Density, 2022 - 2032F |
6.4.6 Lithuania LDPE Market Revenues & Volume, By Linear Density, 2022 - 2032F |
6.5 Lithuania LDPE Market, By Additives |
6.5.1 Overview and Analysis |
6.5.2 Lithuania LDPE Market Revenues & Volume, By UV Stabilizers, 2022 - 2032F |
6.5.3 Lithuania LDPE Market Revenues & Volume, By Antioxidants, 2022 - 2032F |
6.5.4 Lithuania LDPE Market Revenues & Volume, By Slip Agents, 2022 - 2032F |
6.5.5 Lithuania LDPE Market Revenues & Volume, By Anti-Blocking Agents, 2022 - 2032F |
6.5.6 Lithuania LDPE Market Revenues & Volume, By Flame Retardants, 2022 - 2032F |
7 Lithuania LDPE Market Import-Export Trade Statistics |
7.1 Lithuania LDPE Market Export to Major Countries |
7.2 Lithuania LDPE Market Imports from Major Countries |
8 Lithuania LDPE Market Key Performance Indicators |
8.1 Recycling rate of LDPE materials |
8.2 Adoption rate of sustainable LDPE packaging solutions |
8.3 Percentage of LDPE usage in infrastructure projects |
9 Lithuania LDPE Market - Opportunity Assessment |
9.1 Lithuania LDPE Market Opportunity Assessment, By Form, 2022 & 2032F |
9.2 Lithuania LDPE Market Opportunity Assessment, By Application, 2022 & 2032F |
9.3 Lithuania LDPE Market Opportunity Assessment, By Processing Technique, 2022 & 2032F |
9.4 Lithuania LDPE Market Opportunity Assessment, By Density, 2022 & 2032F |
9.5 Lithuania LDPE Market Opportunity Assessment, By Additives, 2022 & 2032F |
10 Lithuania LDPE Market - Competitive Landscape |
10.1 Lithuania LDPE Market Revenue Share, By Companies, 2025 |
10.2 Lithuania LDPE Market Competitive Benchmarking, By Operating and Technical Parameters |
11 Company Profiles |
12 Recommendations |
13 Disclaimer |
Global Go To Market Strategy - 2030
Export potential enables firms to identify high-growth global markets with greater confidence by combining advanced trade intelligence with a structured quantitative methodology. The framework analyzes emerging demand trends and country-level import patterns while integrating macroeconomic and trade datasets such as GDP and population forecasts, bilateral import–export flows, tariff structures, elasticity differentials between developed and developing economies, geographic distance, and import demand projections. Using weighted trade values from 2020–2024 as the base period to project country-to-country export potential for 2030, these inputs are operationalized through calculated drivers such as gravity model parameters, tariff impact factors, and projected GDP per-capita growth. Through an analysis of hidden potentials, demand hotspots, and market conditions that are most favorable to success, this method enables firms to focus on target countries, maximize returns, and global expansion with data, backed by accuracy.
By factoring in the projected importer demand gap that is currently unmet and could be potential opportunity, it identifies the potential for the Exporter (Country) among 190 countries, against the general trade analysis, which identifies the biggest importer or exporter.
To discover high-growth global markets and optimize your business strategy:
Click Here
Pricing
- Single User License$ 1,995
- Department License$ 2,400
- Site License$ 3,120
- Global License$ 3,795

Leadership Perspectives from Industry Events
Search
Thought Leadership and Analyst Meet


Our Clients
6WResearch In News
- Doha a strategic location for EV manufacturing hub: IPA Qatar
- Demand for luxury TVs surging in the GCC, says Samsung
- Empowering Growth: The Thriving Journey of Bangladesh’s Cable Industry
- Demand for luxury TVs surging in the GCC, says Samsung
- Video call with a traditional healer? Once unthinkable, it’s now common in South Africa
- Intelligent Buildings To Smooth GCC’s Path To Net Zero
Latest Reports
- Cape Verde Portable Hand-Thrown Extinguisher Market (2026-2032)
- Canada Portable Hand-Thrown Extinguisher Market (2026-2032)
- Cameroon Portable Hand-Thrown Extinguisher Market (2026-2032)
- Burundi Portable Hand-Thrown Extinguisher Market (2026-2032)
- Burkina Faso Portable Hand-Thrown Extinguisher Market (2026-2032)
- Bulgaria Portable Hand-Thrown Extinguisher Market (2026-2032)
- Brunei Portable Hand-Thrown Extinguisher Market (2026-2032)
- Botswana Portable Hand-Thrown Extinguisher Market (2026-2032)
- Bosnia and Herzegovina Portable Hand-Thrown Extinguisher Market (2026-2032)
- Bolivia Portable Hand-Thrown Extinguisher Market (2026-2032)
Industry Events and Analyst Meet

HIMTEX 2026

India Refining Summit 2026

India EV Show 2026

EV tech India Expo 2026

Auto Tech Asia 2026
Whitepaper
- Middle East & Africa Commercial Security Market Click here to view more.
- Middle East & Africa Fire Safety Systems & Equipment Market Click here to view more.
- GCC Drone Market Click here to view more.
- Middle East Lighting Fixture Market Click here to view more.
- GCC Physical & Perimeter Security Market Click here to view more.