Lithuania Mono-ethanolamine Market (2026-2032) | Companies, Analysis, Value, Size & Revenue, Industry, Growth, Outlook, Competitive Landscape, Forecast, Share, Segmentation, Trends
Market Forecast By Product (industrial grade, pharmaceutical grade, Others), By Application (Detergents, Pharmaceuticals, Cosmetics, Personal Care Products, Other) And Competitive Landscape
| Product Code: ETC8045729 | Publication Date: Sep 2024 | Updated Date: Apr 2026 | Product Type: Market Research Report | |
| Publisher: 6Wresearch | Author: Shubham Padhi | No. of Pages: 75 | No. of Figures: 35 | No. of Tables: 20 |
Lithuania Mono-Ethanolamine Market Size (2020-2030)
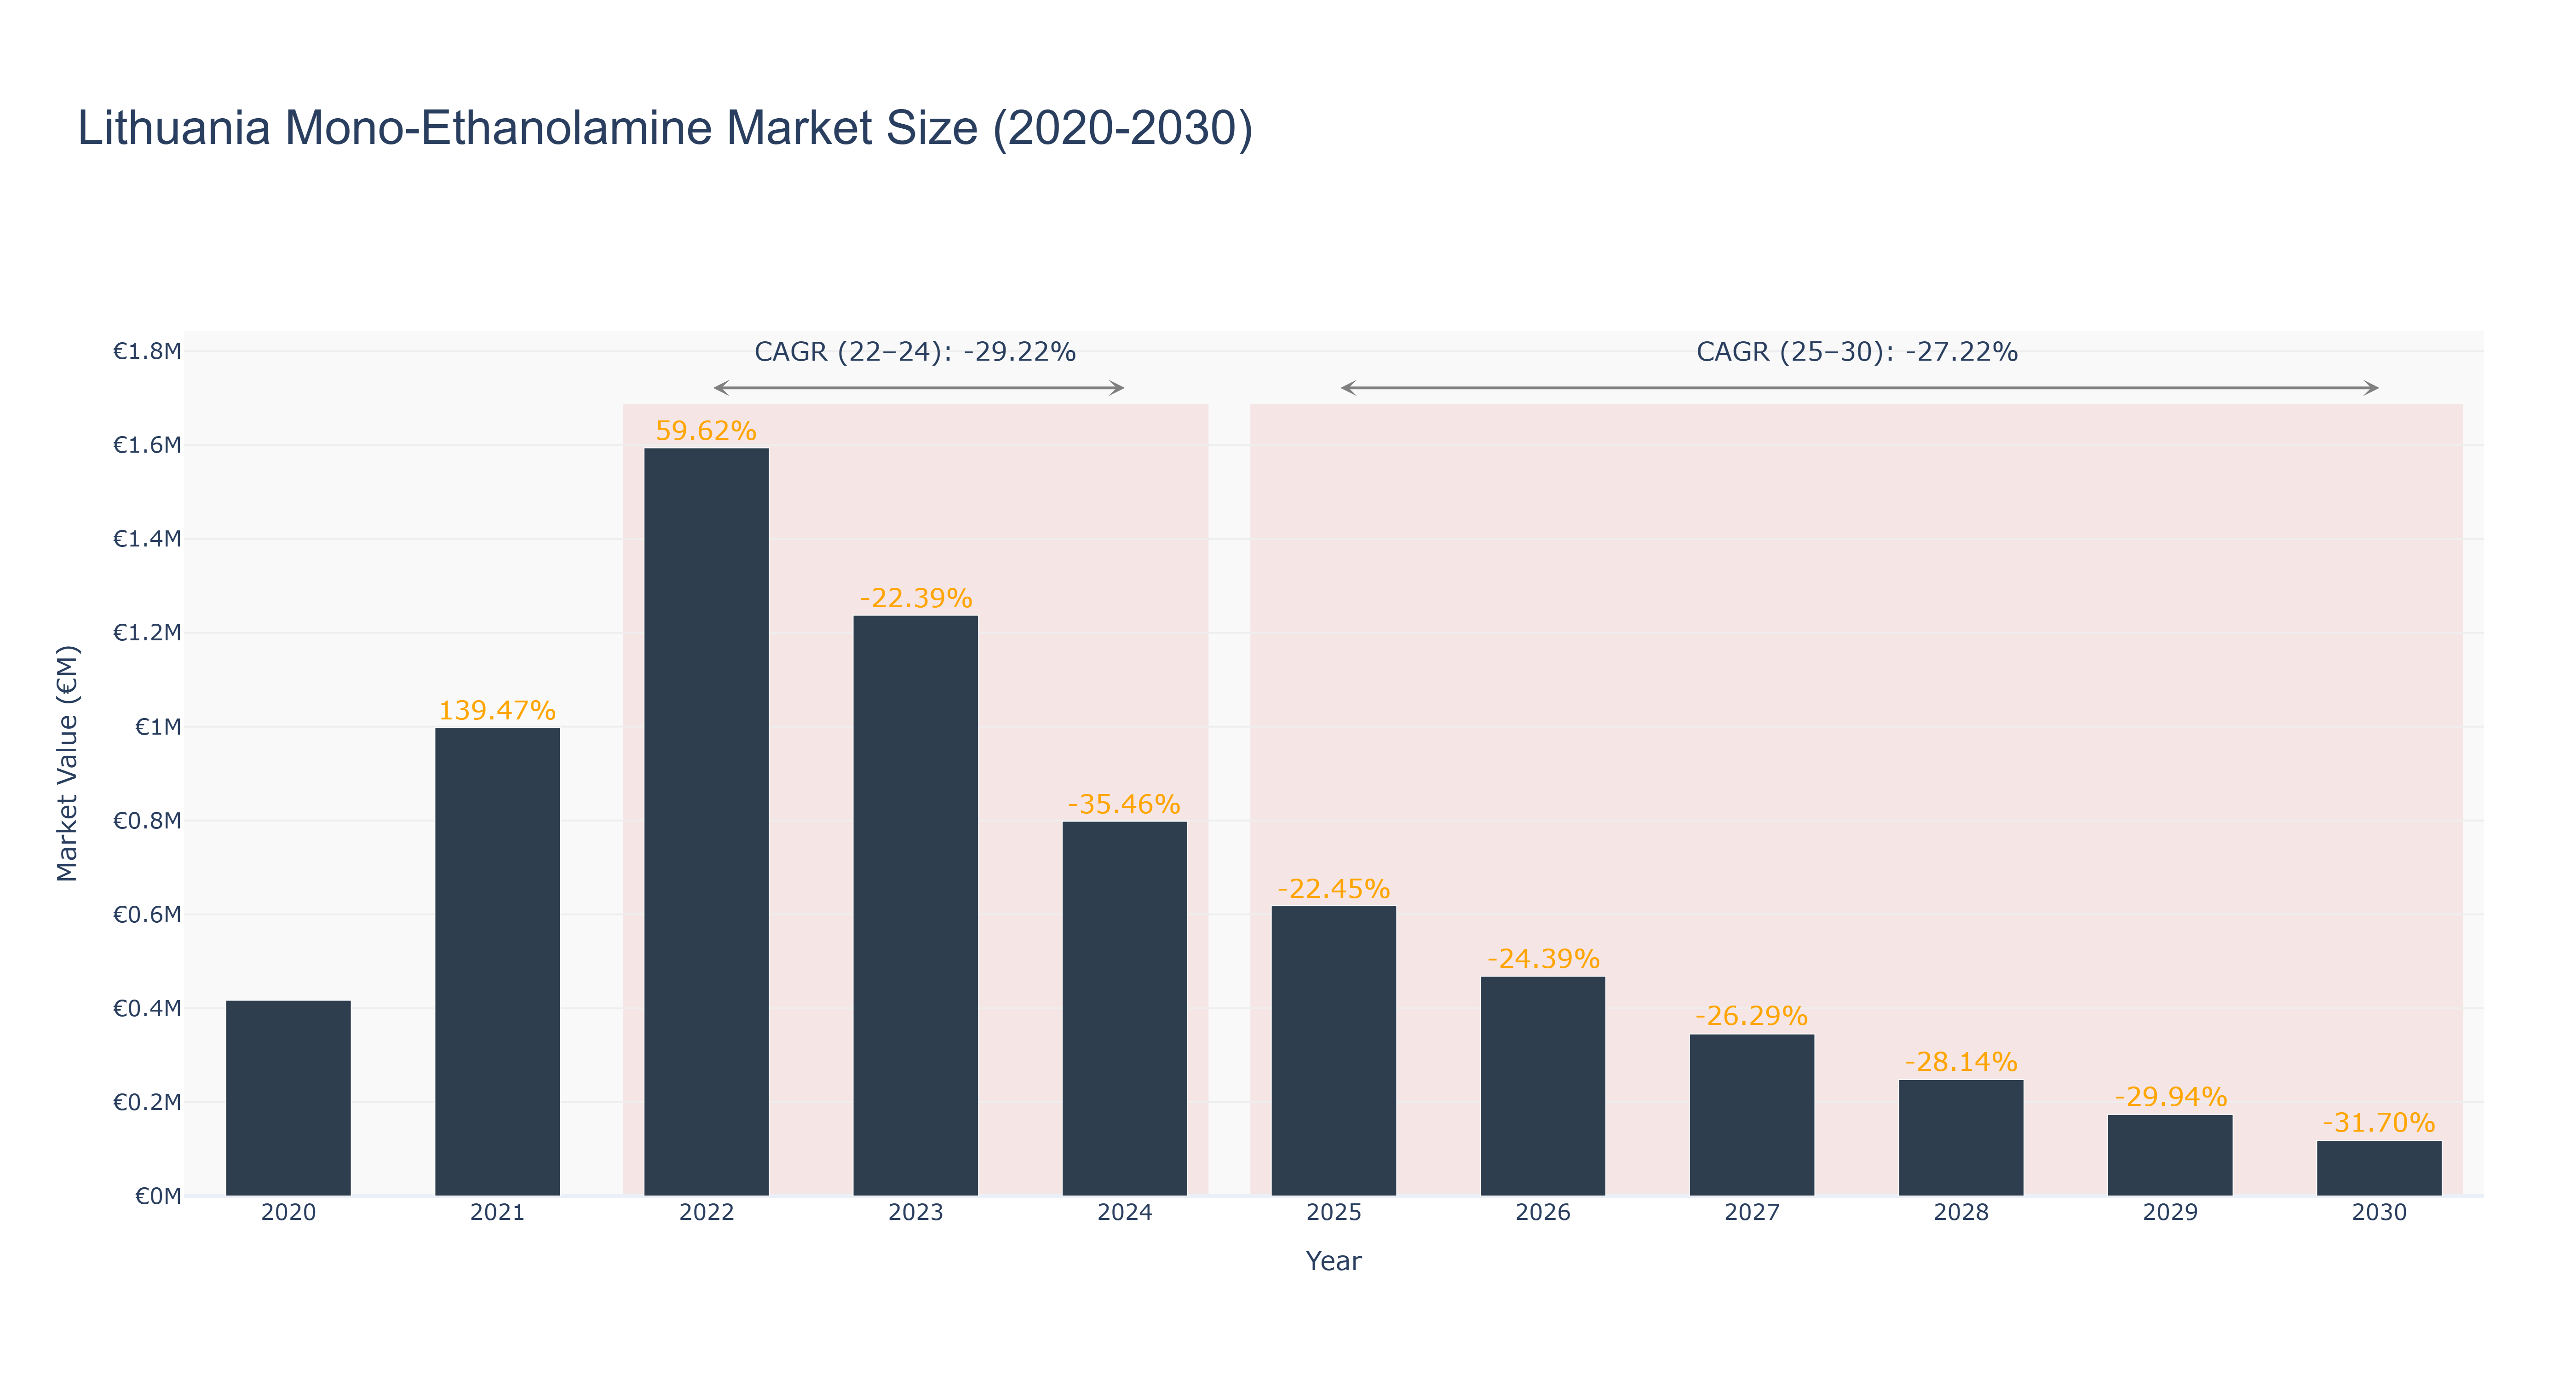
The Lithuania Mono-Ethanolamine Market experienced a peak in 2022 with a market size of €1.59 million, followed by a decline to €0.62 million in 2025. The market is forecasted to continue shrinking with an expected size of €0.12 million in 2030. The CAGR for the period 2022-24 was -29.22%, while for 2025-30, it is projected at -27.22%. The downward trend can be attributed to various factors such as economic uncertainties, changing consumer preferences, and increased competition. However, recent developments indicate a shift towards sustainable practices in the chemical industry, with upcoming projects focusing on eco-friendly manufacturing processes and product innovations to meet evolving market demands. These initiatives are expected to drive growth and reshape the market landscape in the near future.
Lithuania Mono-Ethanolamine Market: Production & Trade Performance (2019-2025)
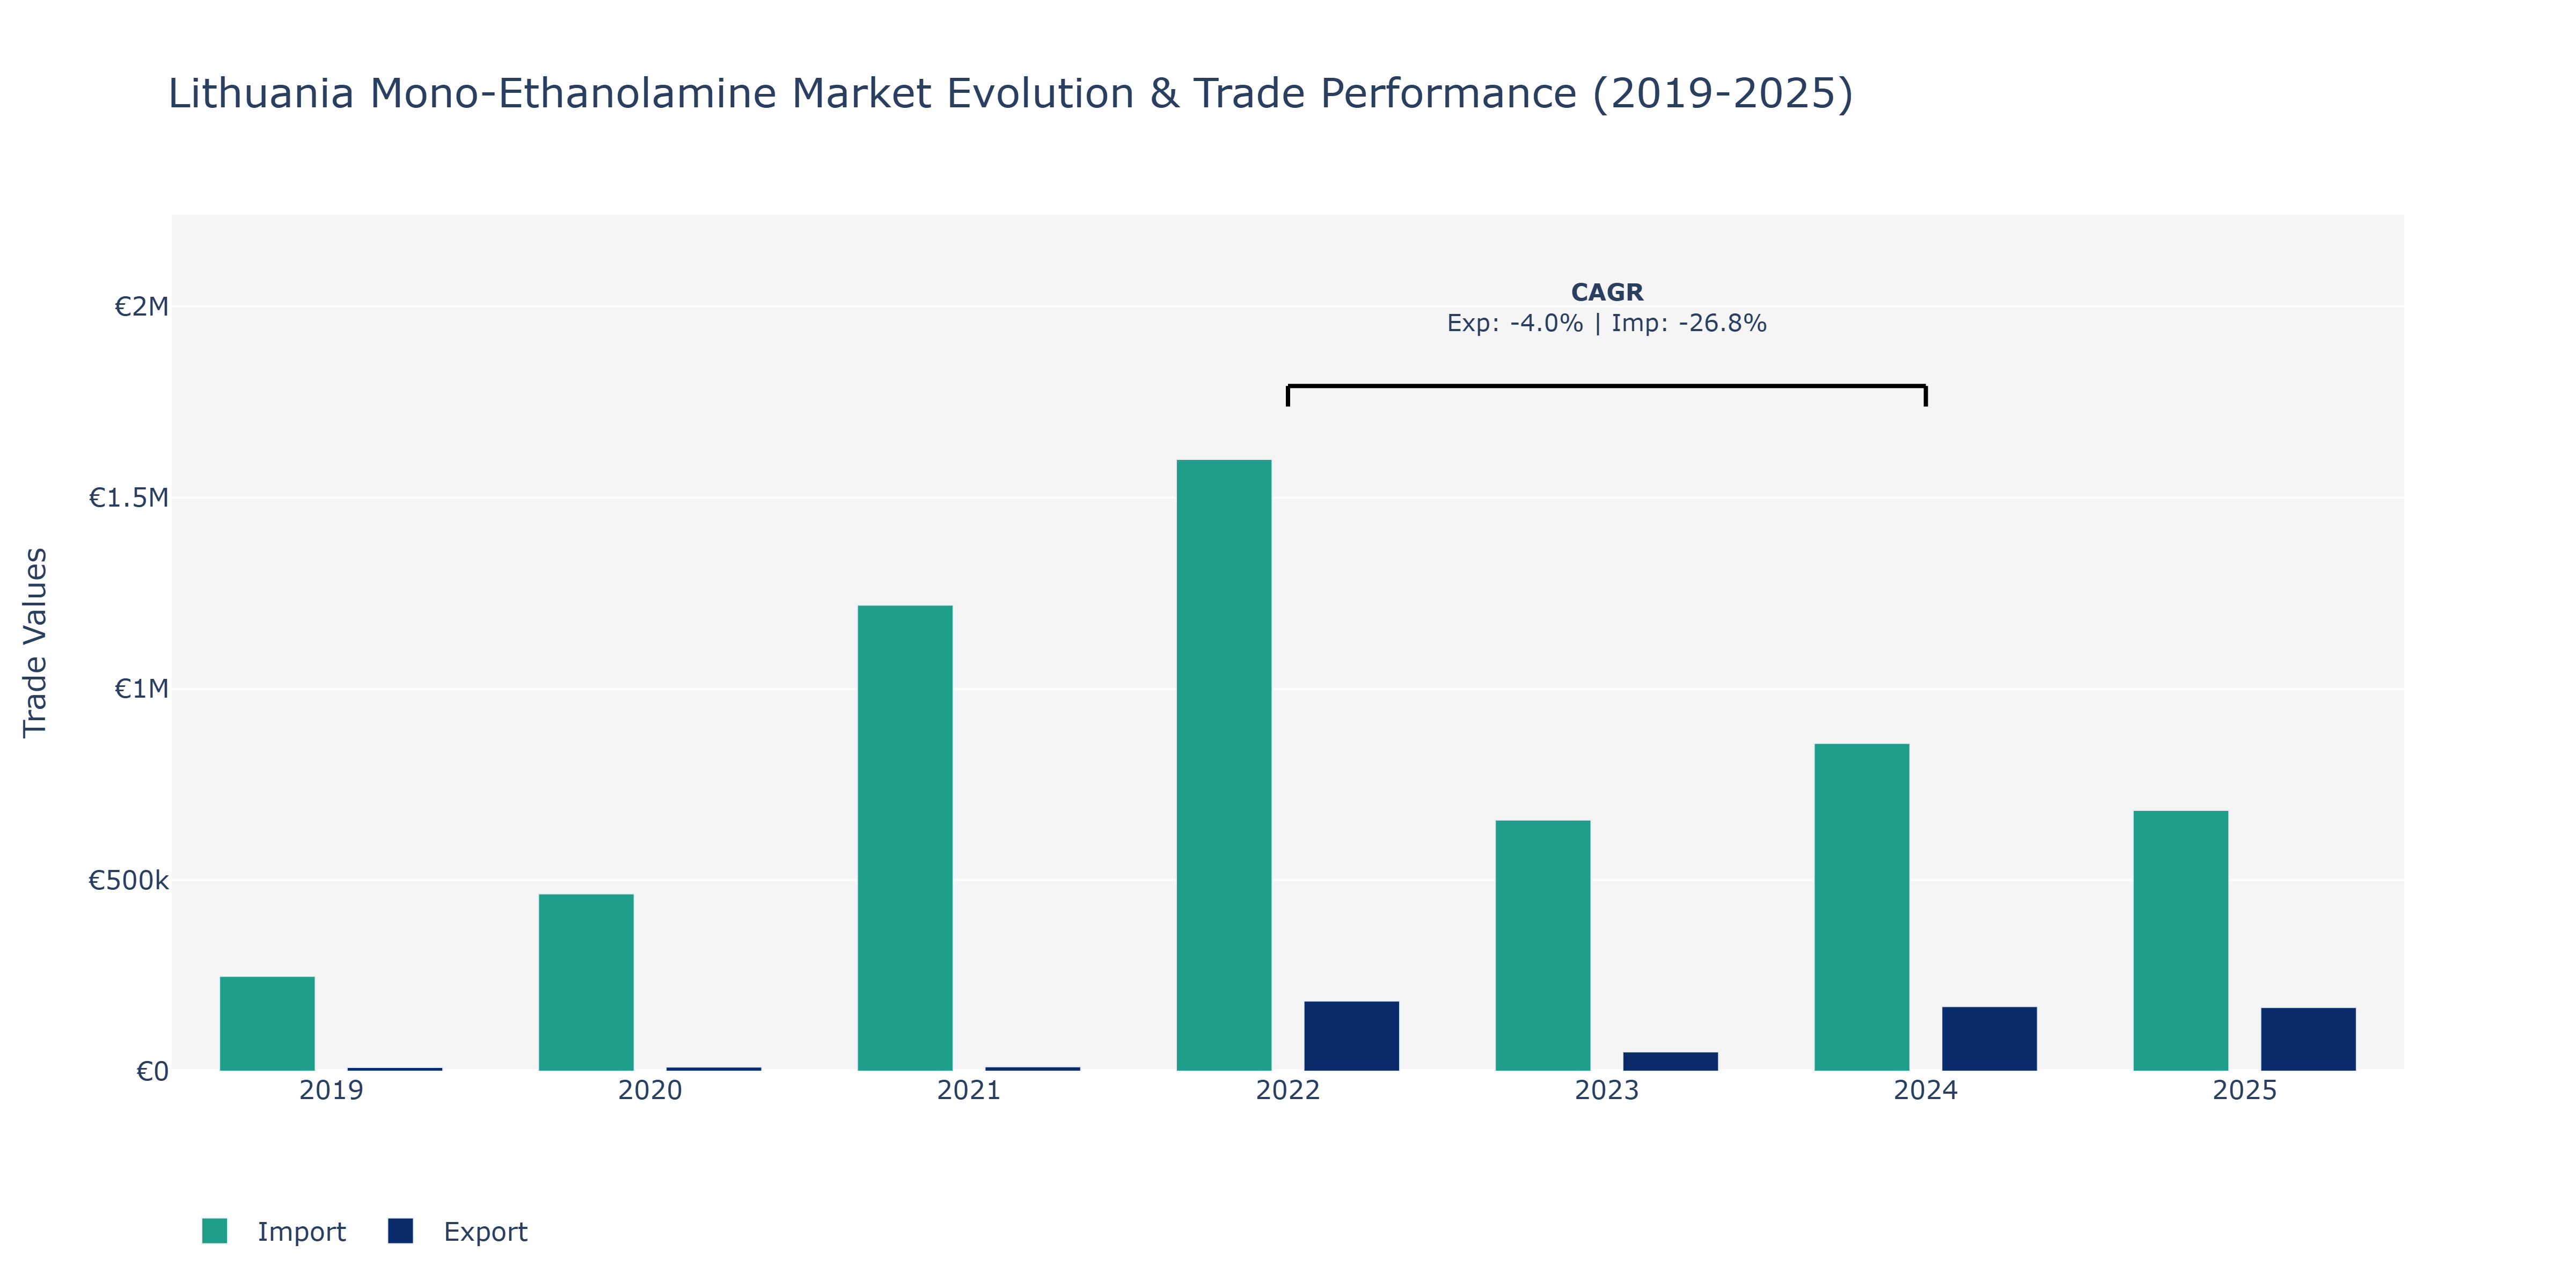
Between 2019 and 2025, the Lithuania Mono-Ethanolamine market witnessed notable fluctuations in both exports and imports. In 2022, exports surged to €183.66 thousand, representing a significant peak, possibly driven by increased demand or expanded production capacity. On the contrary, 2023 saw a sharp decline in exports to €50.7 thousand, indicating a potential market correction or external factors affecting trade. Imports followed a similar pattern, with a peak in 2021 at €1.22 million, likely due to enhanced domestic consumption or strategic sourcing decisions. The subsequent decline in 2023 to €657.11 thousand might be attributed to shifting global trade dynamics or regulatory changes impacting import patterns. These fluctuations suggest a market sensitive to various factors, requiring stakeholders to adapt strategies to navigate changing trade landscapes and ensure sustained market growth in Lithuania's Mono-Ethanolamine sector.
Key Highlights of the Report:
- Lithuania Mono-ethanolamine Market Outlook
- Market Size of Lithuania Mono-ethanolamine Market, 2025
- Forecast of Lithuania Mono-ethanolamine Market, 2032
- Historical Data and Forecast of Lithuania Mono-ethanolamine Revenues & Volume for the Period 2022 - 2032
- Lithuania Mono-ethanolamine Market Trend Evolution
- Lithuania Mono-ethanolamine Market Drivers and Challenges
- Lithuania Mono-ethanolamine Price Trends
- Lithuania Mono-ethanolamine Porter's Five Forces
- Lithuania Mono-ethanolamine Industry Life Cycle
- Historical Data and Forecast of Lithuania Mono-ethanolamine Market Revenues & Volume By Product for the Period 2022 - 2032
- Historical Data and Forecast of Lithuania Mono-ethanolamine Market Revenues & Volume By industrial grade for the Period 2022 - 2032
- Historical Data and Forecast of Lithuania Mono-ethanolamine Market Revenues & Volume By pharmaceutical grade for the Period 2022 - 2032
- Historical Data and Forecast of Lithuania Mono-ethanolamine Market Revenues & Volume By Others for the Period 2022 - 2032
- Historical Data and Forecast of Lithuania Mono-ethanolamine Market Revenues & Volume By Application for the Period 2022 - 2032
- Historical Data and Forecast of Lithuania Mono-ethanolamine Market Revenues & Volume By Detergents for the Period 2022 - 2032
- Historical Data and Forecast of Lithuania Mono-ethanolamine Market Revenues & Volume By Pharmaceuticals for the Period 2022 - 2032
- Historical Data and Forecast of Lithuania Mono-ethanolamine Market Revenues & Volume By Cosmetics for the Period 2022 - 2032
- Historical Data and Forecast of Lithuania Mono-ethanolamine Market Revenues & Volume By Personal Care Products for the Period 2022 - 2032
- Historical Data and Forecast of Lithuania Mono-ethanolamine Market Revenues & Volume By Other for the Period 2022 - 2032
- Lithuania Mono-ethanolamine Import Export Trade Statistics
- Market Opportunity Assessment By Product
- Market Opportunity Assessment By Application
- Lithuania Mono-ethanolamine Top Companies Market Share
- Lithuania Mono-ethanolamine Competitive Benchmarking By Technical and Operational Parameters
- Lithuania Mono-ethanolamine Company Profiles
- Lithuania Mono-ethanolamine Key Strategic Recommendations
Frequently Asked Questions About the Market Study (FAQs):
6Wresearch actively monitors the Lithuania Mono-ethanolamine Market and publishes its comprehensive annual report, highlighting emerging trends, growth drivers, revenue analysis, and forecast outlook. Our insights help businesses to make data-backed strategic decisions with ongoing market dynamics. Our analysts track relevent industries related to the Lithuania Mono-ethanolamine Market, allowing our clients with actionable intelligence and reliable forecasts tailored to emerging regional needs.
Yes, we provide customisation as per your requirements. To learn more, feel free to contact us on sales@6wresearch.com
1 Executive Summary |
2 Introduction |
2.1 Key Highlights of the Report |
2.2 Report Description |
2.3 Market Scope & Segmentation |
2.4 Research Methodology |
2.5 Assumptions |
3 Lithuania Mono-ethanolamine Market Overview |
3.1 Lithuania Country Macro Economic Indicators |
3.2 Lithuania Mono-ethanolamine Market Revenues & Volume, 2022 & 2032F |
3.3 Lithuania Mono-ethanolamine Market - Industry Life Cycle |
3.4 Lithuania Mono-ethanolamine Market - Porter's Five Forces |
3.5 Lithuania Mono-ethanolamine Market Revenues & Volume Share, By Product, 2022 & 2032F |
3.6 Lithuania Mono-ethanolamine Market Revenues & Volume Share, By Application, 2022 & 2032F |
4 Lithuania Mono-ethanolamine Market Dynamics |
4.1 Impact Analysis |
4.2 Market Drivers |
4.2.1 Increasing demand for mono-ethanolamine in various industrial applications such as surfactants, herbicides, and gas treatment. |
4.2.2 Growing focus on sustainable chemicals and environmentally friendly products driving the adoption of bio-based mono-ethanolamine. |
4.2.3 Technological advancements leading to improved production processes and cost-efficiency in the mono-ethanolamine market. |
4.3 Market Restraints |
4.3.1 Fluctuating raw material prices impacting the overall production cost of mono-ethanolamine. |
4.3.2 Stringent regulations and environmental policies concerning chemical manufacturing and usage. |
4.3.3 Competition from alternative chemicals and substitutes in the market affecting the demand for mono-ethanolamine. |
5 Lithuania Mono-ethanolamine Market Trends |
6 Lithuania Mono-ethanolamine Market, By Types |
6.1 Lithuania Mono-ethanolamine Market, By Product |
6.1.1 Overview and Analysis |
6.1.2 Lithuania Mono-ethanolamine Market Revenues & Volume, By Product, 2022 - 2032F |
6.1.3 Lithuania Mono-ethanolamine Market Revenues & Volume, By industrial grade, 2022 - 2032F |
6.1.4 Lithuania Mono-ethanolamine Market Revenues & Volume, By pharmaceutical grade, 2022 - 2032F |
6.1.5 Lithuania Mono-ethanolamine Market Revenues & Volume, By Others, 2022 - 2032F |
6.2 Lithuania Mono-ethanolamine Market, By Application |
6.2.1 Overview and Analysis |
6.2.2 Lithuania Mono-ethanolamine Market Revenues & Volume, By Detergents, 2022 - 2032F |
6.2.3 Lithuania Mono-ethanolamine Market Revenues & Volume, By Pharmaceuticals, 2022 - 2032F |
6.2.4 Lithuania Mono-ethanolamine Market Revenues & Volume, By Cosmetics, 2022 - 2032F |
6.2.5 Lithuania Mono-ethanolamine Market Revenues & Volume, By Personal Care Products, 2022 - 2032F |
6.2.6 Lithuania Mono-ethanolamine Market Revenues & Volume, By Other, 2022 - 2032F |
7 Lithuania Mono-ethanolamine Market Import-Export Trade Statistics |
7.1 Lithuania Mono-ethanolamine Market Export to Major Countries |
7.2 Lithuania Mono-ethanolamine Market Imports from Major Countries |
8 Lithuania Mono-ethanolamine Market Key Performance Indicators |
8.1 Percentage of mono-ethanolamine derived from renewable sources. |
8.2 Research and development investment in innovative production methods for mono-ethanolamine. |
8.3 Adoption rate of mono-ethanolamine in emerging applications such as pharmaceuticals or personal care products. |
9 Lithuania Mono-ethanolamine Market - Opportunity Assessment |
9.1 Lithuania Mono-ethanolamine Market Opportunity Assessment, By Product, 2022 & 2032F |
9.2 Lithuania Mono-ethanolamine Market Opportunity Assessment, By Application, 2022 & 2032F |
10 Lithuania Mono-ethanolamine Market - Competitive Landscape |
10.1 Lithuania Mono-ethanolamine Market Revenue Share, By Companies, 2025 |
10.2 Lithuania Mono-ethanolamine Market Competitive Benchmarking, By Operating and Technical Parameters |
11 Company Profiles |
12 Recommendations |
13 Disclaimer |
Global Go To Market Strategy - 2030
Export potential enables firms to identify high-growth global markets with greater confidence by combining advanced trade intelligence with a structured quantitative methodology. The framework analyzes emerging demand trends and country-level import patterns while integrating macroeconomic and trade datasets such as GDP and population forecasts, bilateral import–export flows, tariff structures, elasticity differentials between developed and developing economies, geographic distance, and import demand projections. Using weighted trade values from 2020–2024 as the base period to project country-to-country export potential for 2030, these inputs are operationalized through calculated drivers such as gravity model parameters, tariff impact factors, and projected GDP per-capita growth. Through an analysis of hidden potentials, demand hotspots, and market conditions that are most favorable to success, this method enables firms to focus on target countries, maximize returns, and global expansion with data, backed by accuracy.
By factoring in the projected importer demand gap that is currently unmet and could be potential opportunity, it identifies the potential for the Exporter (Country) among 190 countries, against the general trade analysis, which identifies the biggest importer or exporter.
To discover high-growth global markets and optimize your business strategy:
Click Here
Pricing
- Single User License$ 1,995
- Department License$ 2,400
- Site License$ 3,120
- Global License$ 3,795

Leadership Perspectives from Industry Events
Search
Thought Leadership and Analyst Meet


Our Clients
6WResearch In News
- Doha a strategic location for EV manufacturing hub: IPA Qatar
- Demand for luxury TVs surging in the GCC, says Samsung
- Empowering Growth: The Thriving Journey of Bangladesh’s Cable Industry
- Demand for luxury TVs surging in the GCC, says Samsung
- Video call with a traditional healer? Once unthinkable, it’s now common in South Africa
- Intelligent Buildings To Smooth GCC’s Path To Net Zero
Latest Reports
- Poland Fire Protection Systems Market (2026-2032)
- Cape Verde Portable Hand-Thrown Extinguisher Market (2026-2032)
- Canada Portable Hand-Thrown Extinguisher Market (2026-2032)
- Cameroon Portable Hand-Thrown Extinguisher Market (2026-2032)
- Burundi Portable Hand-Thrown Extinguisher Market (2026-2032)
- Burkina Faso Portable Hand-Thrown Extinguisher Market (2026-2032)
- Bulgaria Portable Hand-Thrown Extinguisher Market (2026-2032)
- Brunei Portable Hand-Thrown Extinguisher Market (2026-2032)
- Botswana Portable Hand-Thrown Extinguisher Market (2026-2032)
- Bosnia and Herzegovina Portable Hand-Thrown Extinguisher Market (2026-2032)
Industry Events and Analyst Meet

HIMTEX 2026

India Refining Summit 2026

India EV Show 2026

EV tech India Expo 2026

Auto Tech Asia 2026
Whitepaper
- Middle East & Africa Commercial Security Market Click here to view more.
- Middle East & Africa Fire Safety Systems & Equipment Market Click here to view more.
- GCC Drone Market Click here to view more.
- Middle East Lighting Fixture Market Click here to view more.
- GCC Physical & Perimeter Security Market Click here to view more.