Lithuania Paint Thinners Market (2026-2032) | Companies, Analysis, Industry, Competitive Landscape, Segmentation, Value, Trends, Share, Growth, Outlook, Forecast, Size & Revenue
Market Forecast By Material (Acetone, Turpentine, Naphtha, Toluene, Methyl Ethyl Ketone, Dimethylformamide, 2-Butoxyethanol), By Type (Epoxy Paint Thinner, Alkyd Paint Thinner, Polyurethane Paint Thinner, Acrylic Paint Thinner), By Application (Paints & coatings, Industrial Equipment, Pharmaceuticals) And Competitive Landscape
| Product Code: ETC8047689 | Publication Date: Sep 2024 | Updated Date: Apr 2026 | Product Type: Market Research Report | |
| Publisher: 6Wresearch | Author: Summon Dutta | No. of Pages: 75 | No. of Figures: 35 | No. of Tables: 20 |
Lithuania Paint Thinners Market Size (2020-2030)
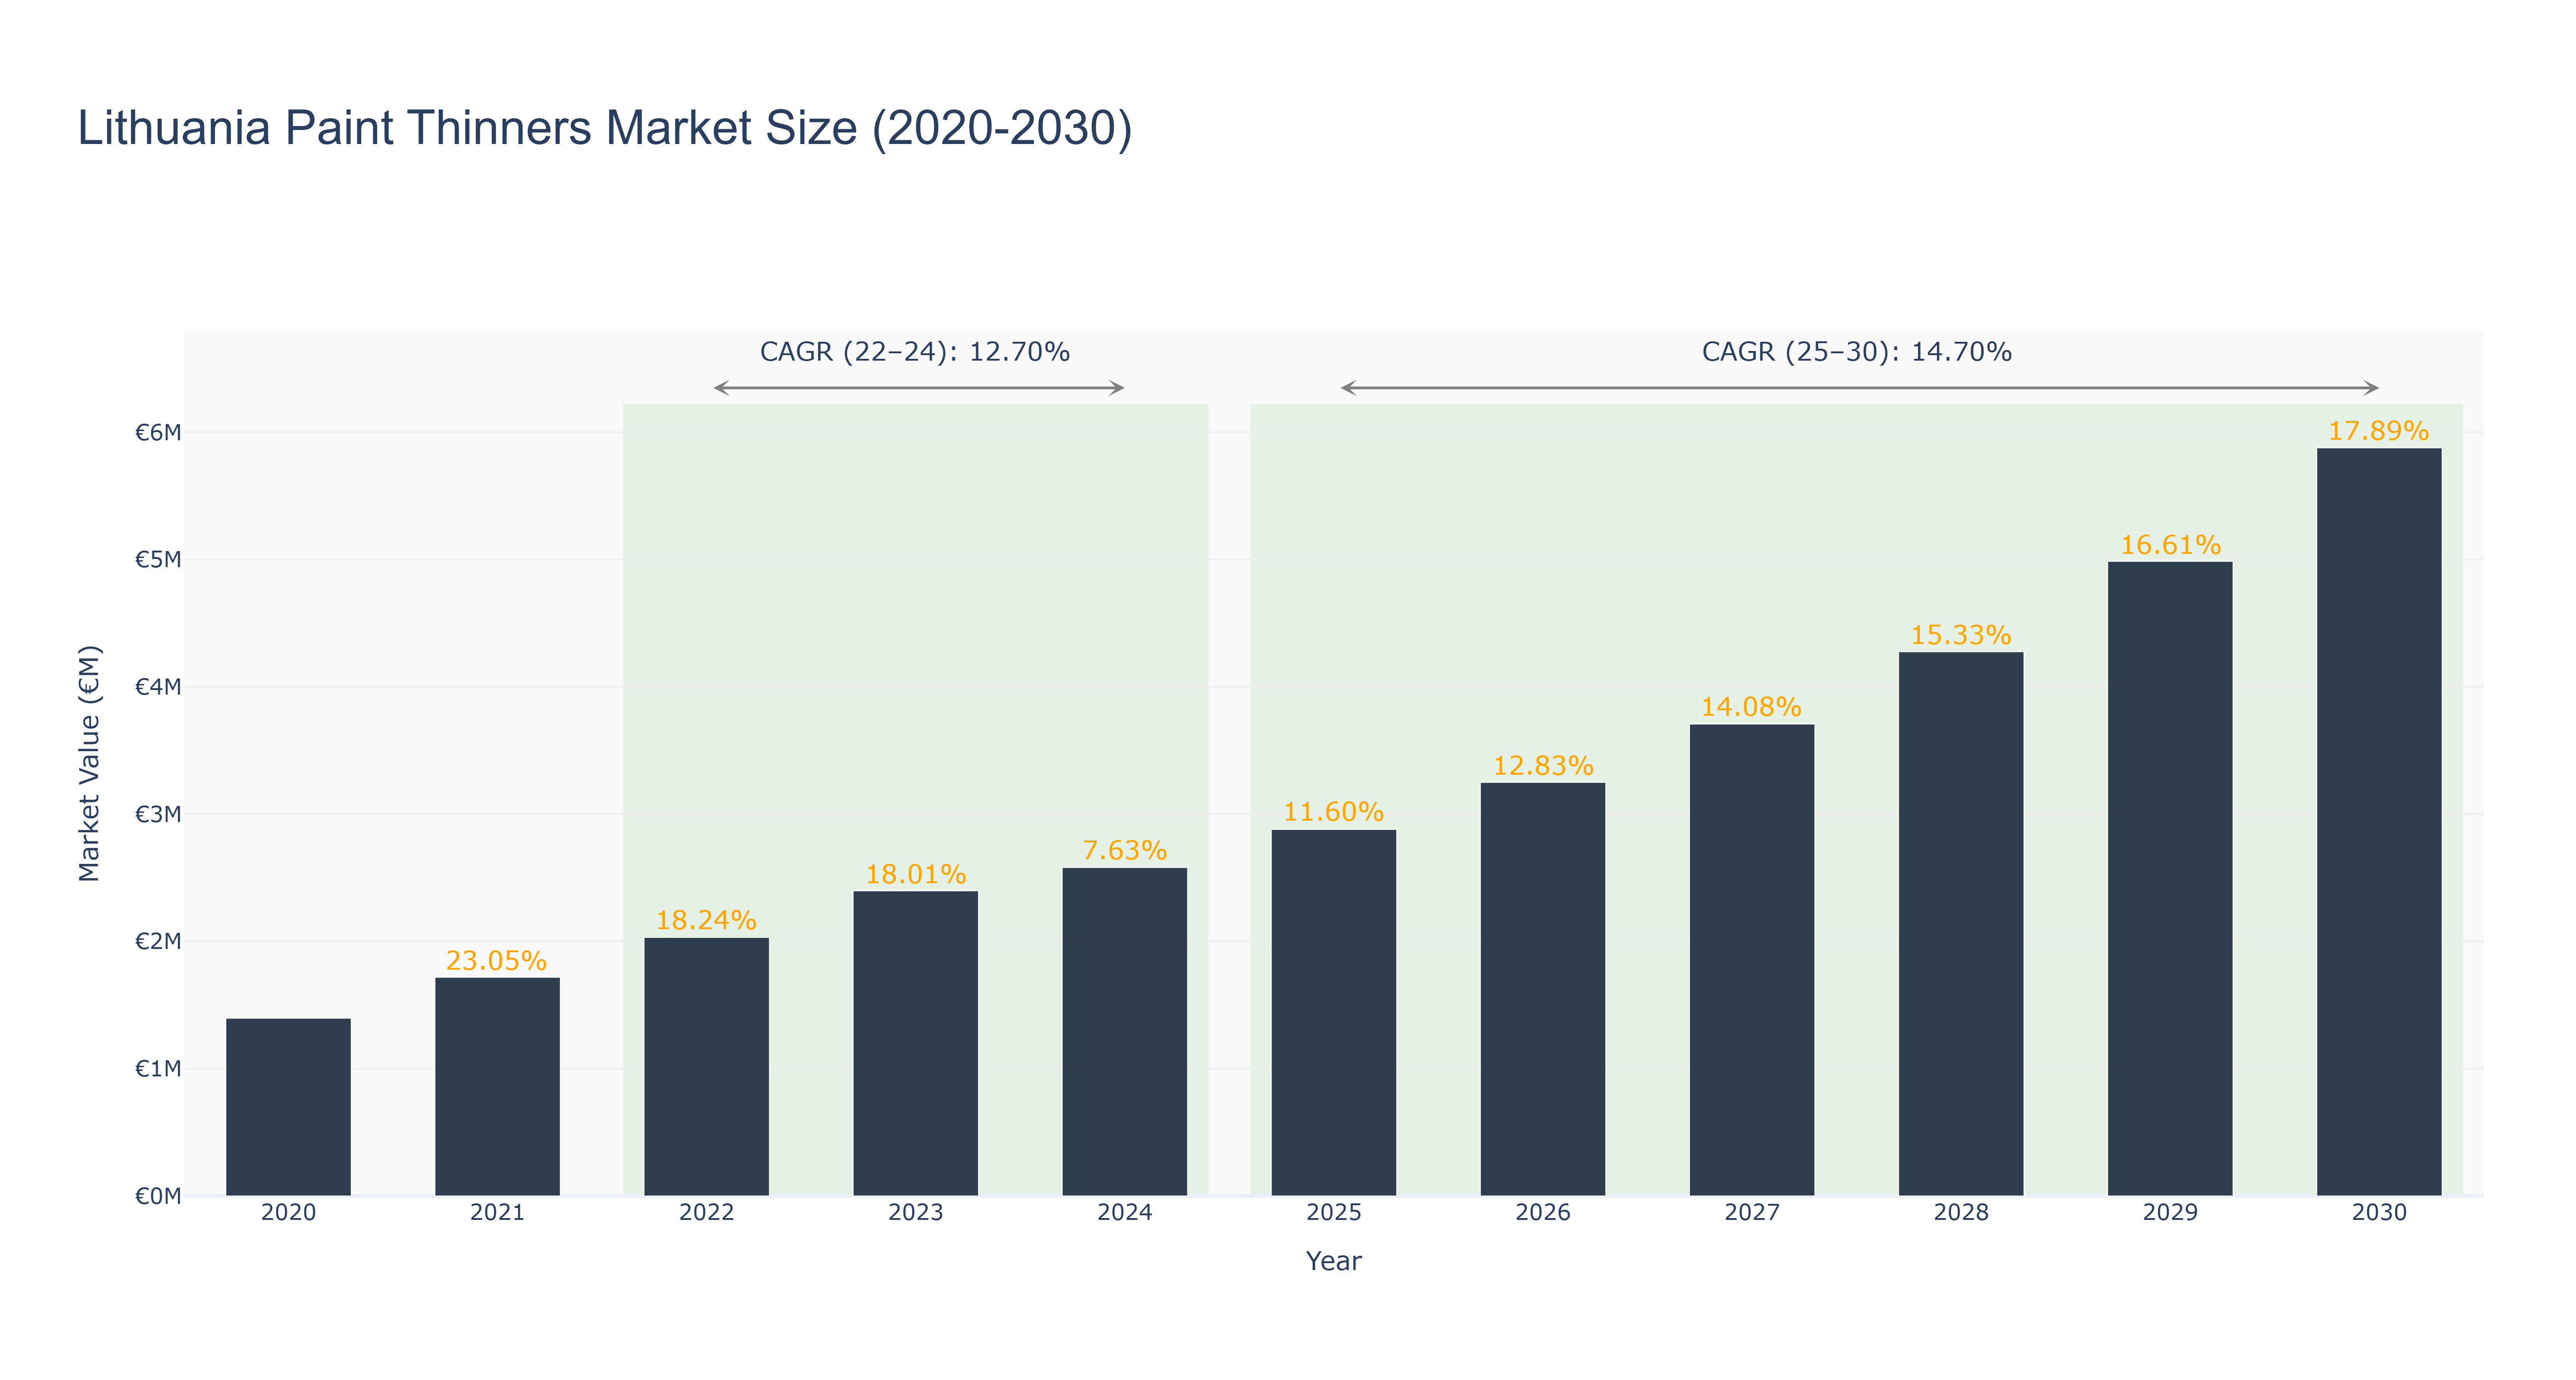
The Lithuania Paint Thinners Market has shown a consistent growth trend over the years. The market size peaked at €5.88 million in 2030, with a forecasted steady increase in the coming years. The actual market size saw incremental growth from €1.40 million in 2020 to €2.58 million in 2024, driven by increasing demand for paint thinners in the construction and automotive industries. The market is expected to maintain a healthy CAGR of 14.70% from 2025 to 2030, indicating sustained market expansion. The growth can be attributed to the rising construction activities and the automotive sector's growth, driving the demand for paint thinners. Looking ahead, Lithuania is planning to introduce stricter environmental regulations, leading to a shift towards eco-friendly paint thinners, fostering innovation and sustainability in the market.
Lithuania Paint Thinners Market: Production & Trade Performance (2019-2025)
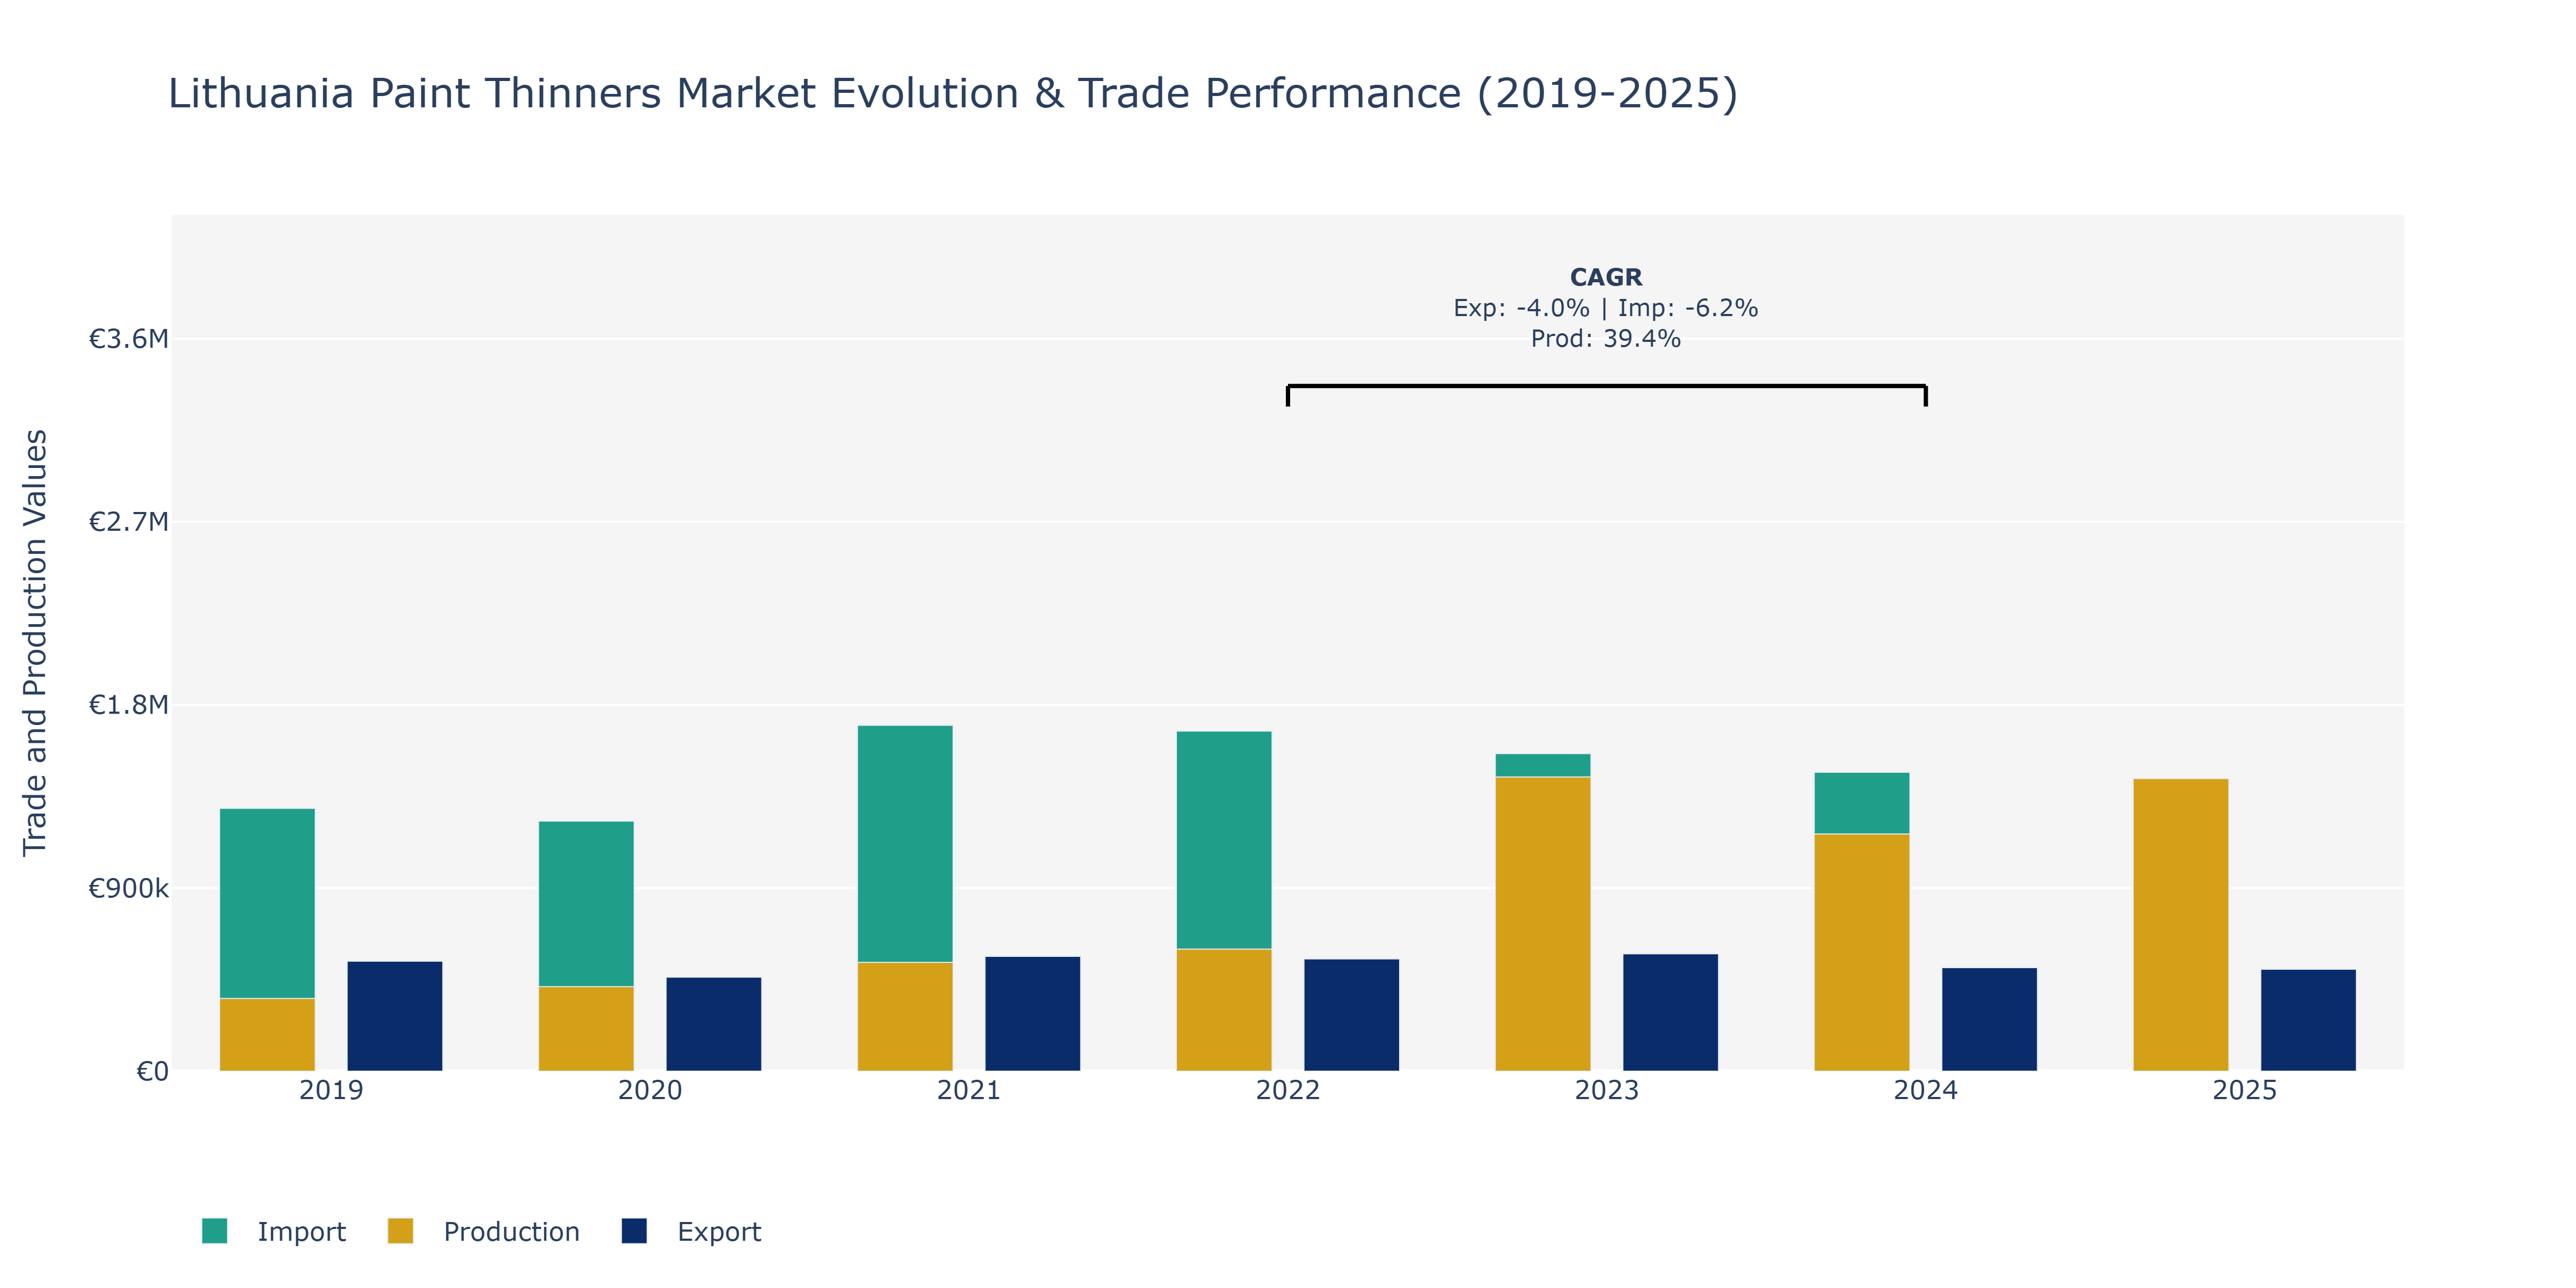
Between 2019 and 2025, Lithuania's Paint Thinners Market witnessed fluctuations in exports, imports, and production. Exports peaked at €576.77 thousand in 2023, showing a slight increase from 2019. Conversely, imports peaked in 2021 at €1.7 million before experiencing a decline in the following years. Production consistently increased, reaching €1.4 billion in 2025, showcasing a significant upward trend from 2019. The surge in production can be attributed to the growing demand for paint thinners in the construction and automotive industries in Lithuania. Despite slight fluctuations, exports remained relatively stable over the years, indicating a consistent market presence. The decline in imports post-2021 could be linked to efforts by local manufacturers to increase domestic production capacity, aligning with Lithuania's strategic goal of enhancing self-sufficiency in key industries.
Key Highlights of the Report:
- Lithuania Paint Thinners Market Outlook
- Market Size of Lithuania Paint Thinners Market, 2025
- Forecast of Lithuania Paint Thinners Market, 2032
- Historical Data and Forecast of Lithuania Paint Thinners Revenues & Volume for the Period 2022 - 2032
- Lithuania Paint Thinners Market Trend Evolution
- Lithuania Paint Thinners Market Drivers and Challenges
- Lithuania Paint Thinners Price Trends
- Lithuania Paint Thinners Porter's Five Forces
- Lithuania Paint Thinners Industry Life Cycle
- Historical Data and Forecast of Lithuania Paint Thinners Market Revenues & Volume By Material for the Period 2022 - 2032
- Historical Data and Forecast of Lithuania Paint Thinners Market Revenues & Volume By Acetone for the Period 2022 - 2032
- Historical Data and Forecast of Lithuania Paint Thinners Market Revenues & Volume By Turpentine for the Period 2022 - 2032
- Historical Data and Forecast of Lithuania Paint Thinners Market Revenues & Volume By Naphtha for the Period 2022 - 2032
- Historical Data and Forecast of Lithuania Paint Thinners Market Revenues & Volume By Toluene for the Period 2022 - 2032
- Historical Data and Forecast of Lithuania Paint Thinners Market Revenues & Volume By Methyl Ethyl Ketone for the Period 2022 - 2032
- Historical Data and Forecast of Lithuania Paint Thinners Market Revenues & Volume By Dimethylformamide for the Period 2022 - 2032
- Historical Data and Forecast of Lithuania Paint Thinners Market Revenues & Volume By 2-Butoxyethanol for the Period 2022 - 2032
- Historical Data and Forecast of Lithuania Paint Thinners Market Revenues & Volume By Type for the Period 2022 - 2032
- Historical Data and Forecast of Lithuania Paint Thinners Market Revenues & Volume By Epoxy Paint Thinner for the Period 2022 - 2032
- Historical Data and Forecast of Lithuania Paint Thinners Market Revenues & Volume By Alkyd Paint Thinner for the Period 2022 - 2032
- Historical Data and Forecast of Lithuania Paint Thinners Market Revenues & Volume By Polyurethane Paint Thinner for the Period 2022 - 2032
- Historical Data and Forecast of Lithuania Paint Thinners Market Revenues & Volume By Acrylic Paint Thinner for the Period 2022 - 2032
- Historical Data and Forecast of Lithuania Paint Thinners Market Revenues & Volume By Application for the Period 2022 - 2032
- Historical Data and Forecast of Lithuania Paint Thinners Market Revenues & Volume By Paints & coatings for the Period 2022 - 2032
- Historical Data and Forecast of Lithuania Paint Thinners Market Revenues & Volume By Industrial Equipment for the Period 2022 - 2032
- Historical Data and Forecast of Lithuania Paint Thinners Market Revenues & Volume By Pharmaceuticals for the Period 2022 - 2032
- Lithuania Paint Thinners Import Export Trade Statistics
- Market Opportunity Assessment By Material
- Market Opportunity Assessment By Type
- Market Opportunity Assessment By Application
- Lithuania Paint Thinners Top Companies Market Share
- Lithuania Paint Thinners Competitive Benchmarking By Technical and Operational Parameters
- Lithuania Paint Thinners Company Profiles
- Lithuania Paint Thinners Key Strategic Recommendations
Frequently Asked Questions About the Market Study (FAQs):
6Wresearch actively monitors the Lithuania Paint Thinners Market and publishes its comprehensive annual report, highlighting emerging trends, growth drivers, revenue analysis, and forecast outlook. Our insights help businesses to make data-backed strategic decisions with ongoing market dynamics. Our analysts track relevent industries related to the Lithuania Paint Thinners Market, allowing our clients with actionable intelligence and reliable forecasts tailored to emerging regional needs.
Yes, we provide customisation as per your requirements. To learn more, feel free to contact us on sales@6wresearch.com
1 Executive Summary |
2 Introduction |
2.1 Key Highlights of the Report |
2.2 Report Description |
2.3 Market Scope & Segmentation |
2.4 Research Methodology |
2.5 Assumptions |
3 Lithuania Paint Thinners Market Overview |
3.1 Lithuania Country Macro Economic Indicators |
3.2 Lithuania Paint Thinners Market Revenues & Volume, 2022 & 2032F |
3.3 Lithuania Paint Thinners Market - Industry Life Cycle |
3.4 Lithuania Paint Thinners Market - Porter's Five Forces |
3.5 Lithuania Paint Thinners Market Revenues & Volume Share, By Material, 2022 & 2032F |
3.6 Lithuania Paint Thinners Market Revenues & Volume Share, By Type, 2022 & 2032F |
3.7 Lithuania Paint Thinners Market Revenues & Volume Share, By Application, 2022 & 2032F |
4 Lithuania Paint Thinners Market Dynamics |
4.1 Impact Analysis |
4.2 Market Drivers |
4.2.1 Growing construction industry in Lithuania leading to increased demand for paint thinners |
4.2.2 Increasing awareness about environmental regulations pushing manufacturers to develop eco-friendly paint thinners |
4.2.3 Rising disposable income levels driving consumer spending on home improvement projects |
4.3 Market Restraints |
4.3.1 Fluctuating raw material prices impacting production costs of paint thinners |
4.3.2 Stringent government regulations on volatile organic compounds (VOCs) limiting the use of traditional paint thinners |
5 Lithuania Paint Thinners Market Trends |
6 Lithuania Paint Thinners Market, By Types |
6.1 Lithuania Paint Thinners Market, By Material |
6.1.1 Overview and Analysis |
6.1.2 Lithuania Paint Thinners Market Revenues & Volume, By Material, 2022 - 2032F |
6.1.3 Lithuania Paint Thinners Market Revenues & Volume, By Acetone, 2022 - 2032F |
6.1.4 Lithuania Paint Thinners Market Revenues & Volume, By Turpentine, 2022 - 2032F |
6.1.5 Lithuania Paint Thinners Market Revenues & Volume, By Naphtha, 2022 - 2032F |
6.1.6 Lithuania Paint Thinners Market Revenues & Volume, By Toluene, 2022 - 2032F |
6.1.7 Lithuania Paint Thinners Market Revenues & Volume, By Methyl Ethyl Ketone, 2022 - 2032F |
6.1.8 Lithuania Paint Thinners Market Revenues & Volume, By Dimethylformamide, 2022 - 2032F |
6.2 Lithuania Paint Thinners Market, By Type |
6.2.1 Overview and Analysis |
6.2.2 Lithuania Paint Thinners Market Revenues & Volume, By Epoxy Paint Thinner, 2022 - 2032F |
6.2.3 Lithuania Paint Thinners Market Revenues & Volume, By Alkyd Paint Thinner, 2022 - 2032F |
6.2.4 Lithuania Paint Thinners Market Revenues & Volume, By Polyurethane Paint Thinner, 2022 - 2032F |
6.2.5 Lithuania Paint Thinners Market Revenues & Volume, By Acrylic Paint Thinner, 2022 - 2032F |
6.3 Lithuania Paint Thinners Market, By Application |
6.3.1 Overview and Analysis |
6.3.2 Lithuania Paint Thinners Market Revenues & Volume, By Paints & coatings, 2022 - 2032F |
6.3.3 Lithuania Paint Thinners Market Revenues & Volume, By Industrial Equipment, 2022 - 2032F |
6.3.4 Lithuania Paint Thinners Market Revenues & Volume, By Pharmaceuticals, 2022 - 2032F |
7 Lithuania Paint Thinners Market Import-Export Trade Statistics |
7.1 Lithuania Paint Thinners Market Export to Major Countries |
7.2 Lithuania Paint Thinners Market Imports from Major Countries |
8 Lithuania Paint Thinners Market Key Performance Indicators |
8.1 Number of new construction projects in Lithuania |
8.2 Adoption rate of eco-friendly paint thinners in the market |
8.3 Average household expenditure on home improvement projects |
9 Lithuania Paint Thinners Market - Opportunity Assessment |
9.1 Lithuania Paint Thinners Market Opportunity Assessment, By Material, 2022 & 2032F |
9.2 Lithuania Paint Thinners Market Opportunity Assessment, By Type, 2022 & 2032F |
9.3 Lithuania Paint Thinners Market Opportunity Assessment, By Application, 2022 & 2032F |
10 Lithuania Paint Thinners Market - Competitive Landscape |
10.1 Lithuania Paint Thinners Market Revenue Share, By Companies, 2025 |
10.2 Lithuania Paint Thinners Market Competitive Benchmarking, By Operating and Technical Parameters |
11 Company Profiles |
12 Recommendations |
13 Disclaimer |
Global Go To Market Strategy - 2030
Export potential enables firms to identify high-growth global markets with greater confidence by combining advanced trade intelligence with a structured quantitative methodology. The framework analyzes emerging demand trends and country-level import patterns while integrating macroeconomic and trade datasets such as GDP and population forecasts, bilateral import–export flows, tariff structures, elasticity differentials between developed and developing economies, geographic distance, and import demand projections. Using weighted trade values from 2020–2024 as the base period to project country-to-country export potential for 2030, these inputs are operationalized through calculated drivers such as gravity model parameters, tariff impact factors, and projected GDP per-capita growth. Through an analysis of hidden potentials, demand hotspots, and market conditions that are most favorable to success, this method enables firms to focus on target countries, maximize returns, and global expansion with data, backed by accuracy.
By factoring in the projected importer demand gap that is currently unmet and could be potential opportunity, it identifies the potential for the Exporter (Country) among 190 countries, against the general trade analysis, which identifies the biggest importer or exporter.
To discover high-growth global markets and optimize your business strategy:
Click Here
Pricing
- Single User License$ 1,995
- Department License$ 2,400
- Site License$ 3,120
- Global License$ 3,795

Leadership Perspectives from Industry Events
Search
Thought Leadership and Analyst Meet


Our Clients
6WResearch In News
- India Export Attractiveness Tracker 2026
- India Air Conditioner Market Set for Strong Rebound in 2026 After Weather-Led Correction and GST-Driven Recovery: 6Wresearch
- ADAS in India: How Automatic Emergency Braking, Blind Spot Detection & Driver Monitoring are Transforming Road Safety
- Doha a strategic location for EV manufacturing hub: IPA Qatar
- Demand for luxury TVs surging in the GCC, says Samsung
- Empowering Growth: The Thriving Journey of Bangladesh’s Cable Industry
Latest Reports
- Qatar Access and Home Network Market (2026-2032)
- Nicaragua RPG Gaming Market (2026-2032)
- New Zealand RPG Gaming Market (2026-2032)
- Netherlands RPG Gaming Market (2026-2032)
- Nauru RPG Gaming Market (2026-2032)
- Namibia RPG Gaming Market (2026-2032)
- Mozambique RPG Gaming Market (2026-2032)
- Montenegro RPG Gaming Market (2026-2032)
- Mongolia RPG Gaming Market (2026-2032)
- Monaco RPG Gaming Market (2026-2032)
Industry Events and Analyst Meet

EV India Expo 2026

HIMTEX 2026

India Refining Summit 2026

India EV Show 2026

EV tech India Expo 2026
Whitepaper
- Middle East & Africa Commercial Security Market Click here to view more.
- Middle East & Africa Fire Safety Systems & Equipment Market Click here to view more.
- GCC Drone Market Click here to view more.
- Middle East Lighting Fixture Market Click here to view more.
- GCC Physical & Perimeter Security Market Click here to view more.