Lithuania Sensor Bearing Market (2026-2032) | Analysis, Industry, Share, Value, Trends, Outlook, Companies, Revenue, Segmentation, Growth, Forecast & Size
Market Forecast By Functionality (Speed, Temperature, Vibration, Displacement), By Application (ABS, Material Handling Equipment, Electric Motors), By End Use Industry (Automotive, Transportation, Metal & Mining) And Competitive Landscape
| Product Code: ETC5699356 | Publication Date: Nov 2023 | Updated Date: Mar 2026 | Product Type: Market Research Report | |
| Publisher: 6Wresearch | Author: Ravi Bhandari | No. of Pages: 60 | No. of Figures: 30 | No. of Tables: 5 |
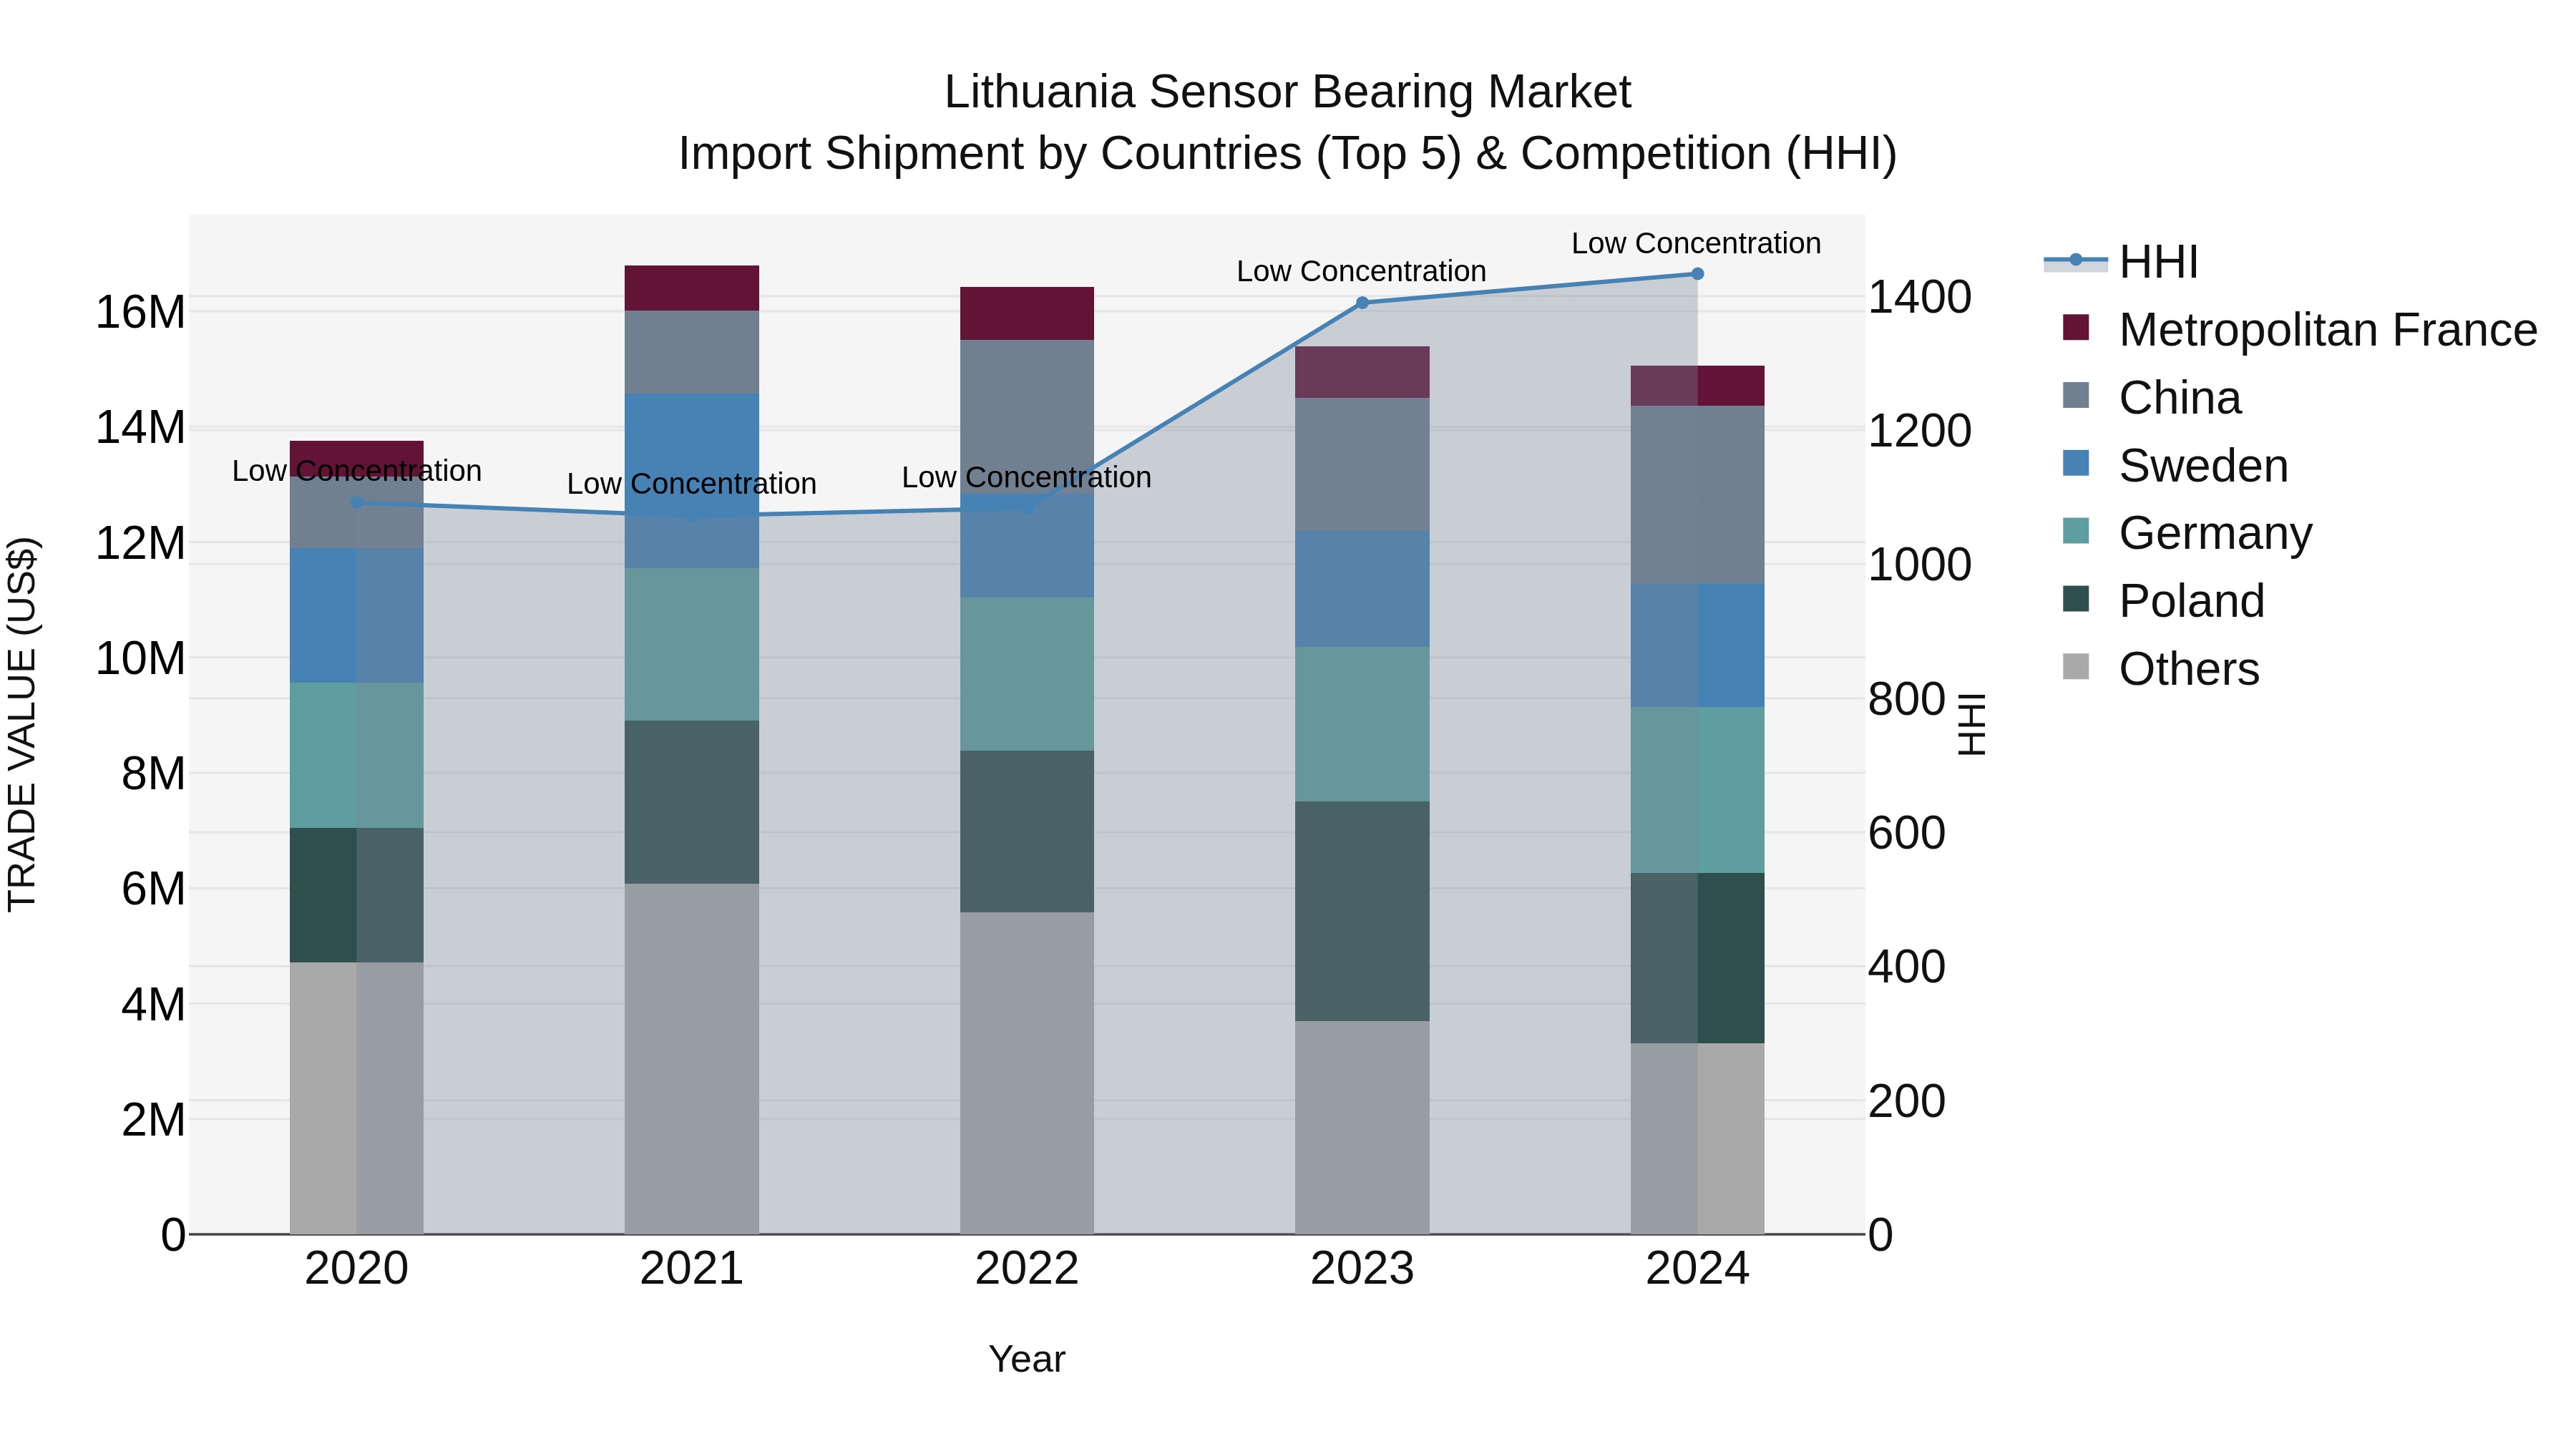
Lithuania Sensor Bearing Market Top 5 Importing Countries and Market Competition (HHI) Analysis
In 2024, Lithuania saw a steady increase in sensor bearing import shipments, with top exporting countries being China, Poland, Germany, Sweden, and Metropolitan France. The market remained competitive with low concentration, indicating a diverse range of suppliers. Despite a slight dip in growth rate from 2023 to 2024, the compound annual growth rate (CAGR) over the 4-year period was a respectable 2.27%. This data suggests a stable and growing market for sensor bearings in Lithuania, with opportunities for continued expansion and partnerships with leading global exporters.
Key Highlights of the Report:
- Lithuania Sensor Bearing Market Outlook
- Market Size of Lithuania Sensor Bearing Market, 2025
- Forecast of Lithuania Sensor Bearing Market, 2032
- Historical Data and Forecast of Lithuania Sensor Bearing Revenues & Volume for the Period 2022 - 2032F
- Lithuania Sensor Bearing Market Trend Evolution
- Lithuania Sensor Bearing Market Drivers and Challenges
- Lithuania Sensor Bearing Price Trends
- Lithuania Sensor Bearing Porter`s Five Forces
- Lithuania Sensor Bearing Industry Life Cycle
- Historical Data and Forecast of Lithuania Sensor Bearing Market Revenues & Volume By Functionality for the Period 2022 - 2032F
- Historical Data and Forecast of Lithuania Sensor Bearing Market Revenues & Volume By Speed for the Period 2022 - 2032F
- Historical Data and Forecast of Lithuania Sensor Bearing Market Revenues & Volume By Temperature for the Period 2022 - 2032F
- Historical Data and Forecast of Lithuania Sensor Bearing Market Revenues & Volume By Vibration for the Period 2022 - 2032F
- Historical Data and Forecast of Lithuania Sensor Bearing Market Revenues & Volume By Displacement for the Period 2022 - 2032F
- Historical Data and Forecast of Lithuania Sensor Bearing Market Revenues & Volume By Application for the Period 2022 - 2032F
- Historical Data and Forecast of Lithuania Sensor Bearing Market Revenues & Volume By ABS for the Period 2022 - 2032F
- Historical Data and Forecast of Lithuania Sensor Bearing Market Revenues & Volume By Material Handling Equipment for the Period 2022 - 2032F
- Historical Data and Forecast of Lithuania Sensor Bearing Market Revenues & Volume By Electric Motors for the Period 2022 - 2032F
- Historical Data and Forecast of Lithuania Sensor Bearing Market Revenues & Volume By End Use Industry for the Period 2022 - 2032F
- Historical Data and Forecast of Lithuania Sensor Bearing Market Revenues & Volume By Automotive for the Period 2022 - 2032F
- Historical Data and Forecast of Lithuania Sensor Bearing Market Revenues & Volume By Transportation for the Period 2022 - 2032F
- Historical Data and Forecast of Lithuania Sensor Bearing Market Revenues & Volume By Metal & Mining for the Period 2022 - 2032F
- Lithuania Sensor Bearing Import Export Trade Statistics
- Market Opportunity Assessment By Functionality
- Market Opportunity Assessment By Application
- Market Opportunity Assessment By End Use Industry
- Lithuania Sensor Bearing Top Companies Market Share
- Lithuania Sensor Bearing Competitive Benchmarking By Technical and Operational Parameters
- Lithuania Sensor Bearing Company Profiles
- Lithuania Sensor Bearing Key Strategic Recommendations
Frequently Asked Questions About the Market Study (FAQs):
6Wresearch actively monitors the Lithuania Sensor Bearing Market and publishes its comprehensive annual report, highlighting emerging trends, growth drivers, revenue analysis, and forecast outlook. Our insights help businesses to make data-backed strategic decisions with ongoing market dynamics. Our analysts track relevent industries related to the Lithuania Sensor Bearing Market, allowing our clients with actionable intelligence and reliable forecasts tailored to emerging regional needs.
Yes, we provide customisation as per your requirements. To learn more, feel free to contact us on sales@6wresearch.com
1 Executive Summary |
2 Introduction |
2.1 Key Highlights of the Report |
2.2 Report Description |
2.3 Market Scope & Segmentation |
2.4 Research Methodology |
2.5 Assumptions |
3 Lithuania Sensor Bearing Market Overview |
3.1 Lithuania Country Macro Economic Indicators |
3.2 Lithuania Sensor Bearing Market Revenues & Volume, 2022 & 2032F |
3.3 Lithuania Sensor Bearing Market - Industry Life Cycle |
3.4 Lithuania Sensor Bearing Market - Porter's Five Forces |
3.5 Lithuania Sensor Bearing Market Revenues & Volume Share, By Functionality, 2022 & 2032F |
3.6 Lithuania Sensor Bearing Market Revenues & Volume Share, By Application, 2022 & 2032F |
3.7 Lithuania Sensor Bearing Market Revenues & Volume Share, By End Use Industry, 2022 & 2032F |
4 Lithuania Sensor Bearing Market Dynamics |
4.1 Impact Analysis |
4.2 Market Drivers |
4.2.1 Increasing demand for sensor bearings in industries such as automotive, aerospace, and manufacturing due to their ability to monitor and improve operational efficiency. |
4.2.2 Technological advancements leading to the development of more sophisticated sensor bearings with enhanced capabilities and accuracy. |
4.2.3 Growing focus on predictive maintenance and condition monitoring practices, driving the adoption of sensor bearings for real-time data collection and analysis. |
4.3 Market Restraints |
4.3.1 High initial investment costs associated with implementing sensor bearings, especially for small and medium-sized enterprises, limiting adoption rates. |
4.3.2 Concerns regarding data security and privacy, especially in industries where sensitive information is collected and transmitted through sensor bearings. |
4.3.3 Limited availability of skilled professionals capable of effectively utilizing sensor bearing data for optimizing operations and decision-making processes. |
5 Lithuania Sensor Bearing Market Trends |
6 Lithuania Sensor Bearing Market Segmentations |
6.1 Lithuania Sensor Bearing Market, By Functionality |
6.1.1 Overview and Analysis |
6.1.2 Lithuania Sensor Bearing Market Revenues & Volume, By Speed, 2022 - 2032F |
6.1.3 Lithuania Sensor Bearing Market Revenues & Volume, By Temperature, 2022 - 2032F |
6.1.4 Lithuania Sensor Bearing Market Revenues & Volume, By Vibration, 2022 - 2032F |
6.1.5 Lithuania Sensor Bearing Market Revenues & Volume, By Displacement, 2022 - 2032F |
6.2 Lithuania Sensor Bearing Market, By Application |
6.2.1 Overview and Analysis |
6.2.2 Lithuania Sensor Bearing Market Revenues & Volume, By ABS, 2022 - 2032F |
6.2.3 Lithuania Sensor Bearing Market Revenues & Volume, By Material Handling Equipment, 2022 - 2032F |
6.2.4 Lithuania Sensor Bearing Market Revenues & Volume, By Electric Motors, 2022 - 2032F |
6.3 Lithuania Sensor Bearing Market, By End Use Industry |
6.3.1 Overview and Analysis |
6.3.2 Lithuania Sensor Bearing Market Revenues & Volume, By Automotive, 2022 - 2032F |
6.3.3 Lithuania Sensor Bearing Market Revenues & Volume, By Transportation, 2022 - 2032F |
6.3.4 Lithuania Sensor Bearing Market Revenues & Volume, By Metal & Mining, 2022 - 2032F |
7 Lithuania Sensor Bearing Market Import-Export Trade Statistics |
7.1 Lithuania Sensor Bearing Market Export to Major Countries |
7.2 Lithuania Sensor Bearing Market Imports from Major Countries |
8 Lithuania Sensor Bearing Market Key Performance Indicators |
8.1 Mean Time Between Failures (MTBF) of sensor bearings, indicating their reliability and durability in various applications. |
8.2 Percentage increase in predictive maintenance efficiency achieved through the use of sensor bearings, showcasing their impact on reducing downtime and maintenance costs. |
8.3 Rate of successful integration of sensor bearings with existing systems and processes, reflecting the ease of adoption and compatibility of sensor bearing solutions. |
9 Lithuania Sensor Bearing Market - Opportunity Assessment |
9.1 Lithuania Sensor Bearing Market Opportunity Assessment, By Functionality, 2022 & 2032F |
9.2 Lithuania Sensor Bearing Market Opportunity Assessment, By Application, 2022 & 2032F |
9.3 Lithuania Sensor Bearing Market Opportunity Assessment, By End Use Industry, 2022 & 2032F |
10 Lithuania Sensor Bearing Market - Competitive Landscape |
10.1 Lithuania Sensor Bearing Market Revenue Share, By Companies, 2025 |
10.2 Lithuania Sensor Bearing Market Competitive Benchmarking, By Operating and Technical Parameters |
11 Company Profiles |
12 Recommendations | 13 Disclaimer |
Global Go To Market Strategy - 2030
Export potential enables firms to identify high-growth global markets with greater confidence by combining advanced trade intelligence with a structured quantitative methodology. The framework analyzes emerging demand trends and country-level import patterns while integrating macroeconomic and trade datasets such as GDP and population forecasts, bilateral import–export flows, tariff structures, elasticity differentials between developed and developing economies, geographic distance, and import demand projections. Using weighted trade values from 2020–2024 as the base period to project country-to-country export potential for 2030, these inputs are operationalized through calculated drivers such as gravity model parameters, tariff impact factors, and projected GDP per-capita growth. Through an analysis of hidden potentials, demand hotspots, and market conditions that are most favorable to success, this method enables firms to focus on target countries, maximize returns, and global expansion with data, backed by accuracy.
By factoring in the projected importer demand gap that is currently unmet and could be potential opportunity, it identifies the potential for the Exporter (Country) among 190 countries, against the general trade analysis, which identifies the biggest importer or exporter.
To discover high-growth global markets and optimize your business strategy:
Click Here
Pricing
- Single User License$ 1,995
- Department License$ 2,400
- Site License$ 3,120
- Global License$ 3,795

Leadership Perspectives from Industry Events
Search
Thought Leadership and Analyst Meet


Our Clients
6WResearch In News
- Doha a strategic location for EV manufacturing hub: IPA Qatar
- Demand for luxury TVs surging in the GCC, says Samsung
- Empowering Growth: The Thriving Journey of Bangladesh’s Cable Industry
- Demand for luxury TVs surging in the GCC, says Samsung
- Video call with a traditional healer? Once unthinkable, it’s now common in South Africa
- Intelligent Buildings To Smooth GCC’s Path To Net Zero
Latest Reports
- Cape Verde Portable Hand-Thrown Extinguisher Market (2026-2032)
- Canada Portable Hand-Thrown Extinguisher Market (2026-2032)
- Cameroon Portable Hand-Thrown Extinguisher Market (2026-2032)
- Burundi Portable Hand-Thrown Extinguisher Market (2026-2032)
- Burkina Faso Portable Hand-Thrown Extinguisher Market (2026-2032)
- Bulgaria Portable Hand-Thrown Extinguisher Market (2026-2032)
- Brunei Portable Hand-Thrown Extinguisher Market (2026-2032)
- Botswana Portable Hand-Thrown Extinguisher Market (2026-2032)
- Bosnia and Herzegovina Portable Hand-Thrown Extinguisher Market (2026-2032)
- Bolivia Portable Hand-Thrown Extinguisher Market (2026-2032)
Industry Events and Analyst Meet

HIMTEX 2026

India Refining Summit 2026

India EV Show 2026

EV tech India Expo 2026

Auto Tech Asia 2026
Whitepaper
- Middle East & Africa Commercial Security Market Click here to view more.
- Middle East & Africa Fire Safety Systems & Equipment Market Click here to view more.
- GCC Drone Market Click here to view more.
- Middle East Lighting Fixture Market Click here to view more.
- GCC Physical & Perimeter Security Market Click here to view more.