Lithuania Shaft Couplings Market (2026-2032) | Companies, Trends, Size, Growth, Analysis, Segmentation, Value, Share, Industry, Outlook, Forecast & Revenue
Market Forecast By Type (Flexible Couplings, Disc Rigid Couplings), By Application (Power and Energy, Automotive Industry, Steel Industry) And Competitive Landscape
| Product Code: ETC5521402 | Publication Date: Nov 2023 | Updated Date: Apr 2026 | Product Type: Market Research Report | |
| Publisher: 6Wresearch | Author: Ravi Bhandari | No. of Pages: 60 | No. of Figures: 30 | No. of Tables: 5 |
Lithuania Shaft Couplings Market Size (2020-2030)
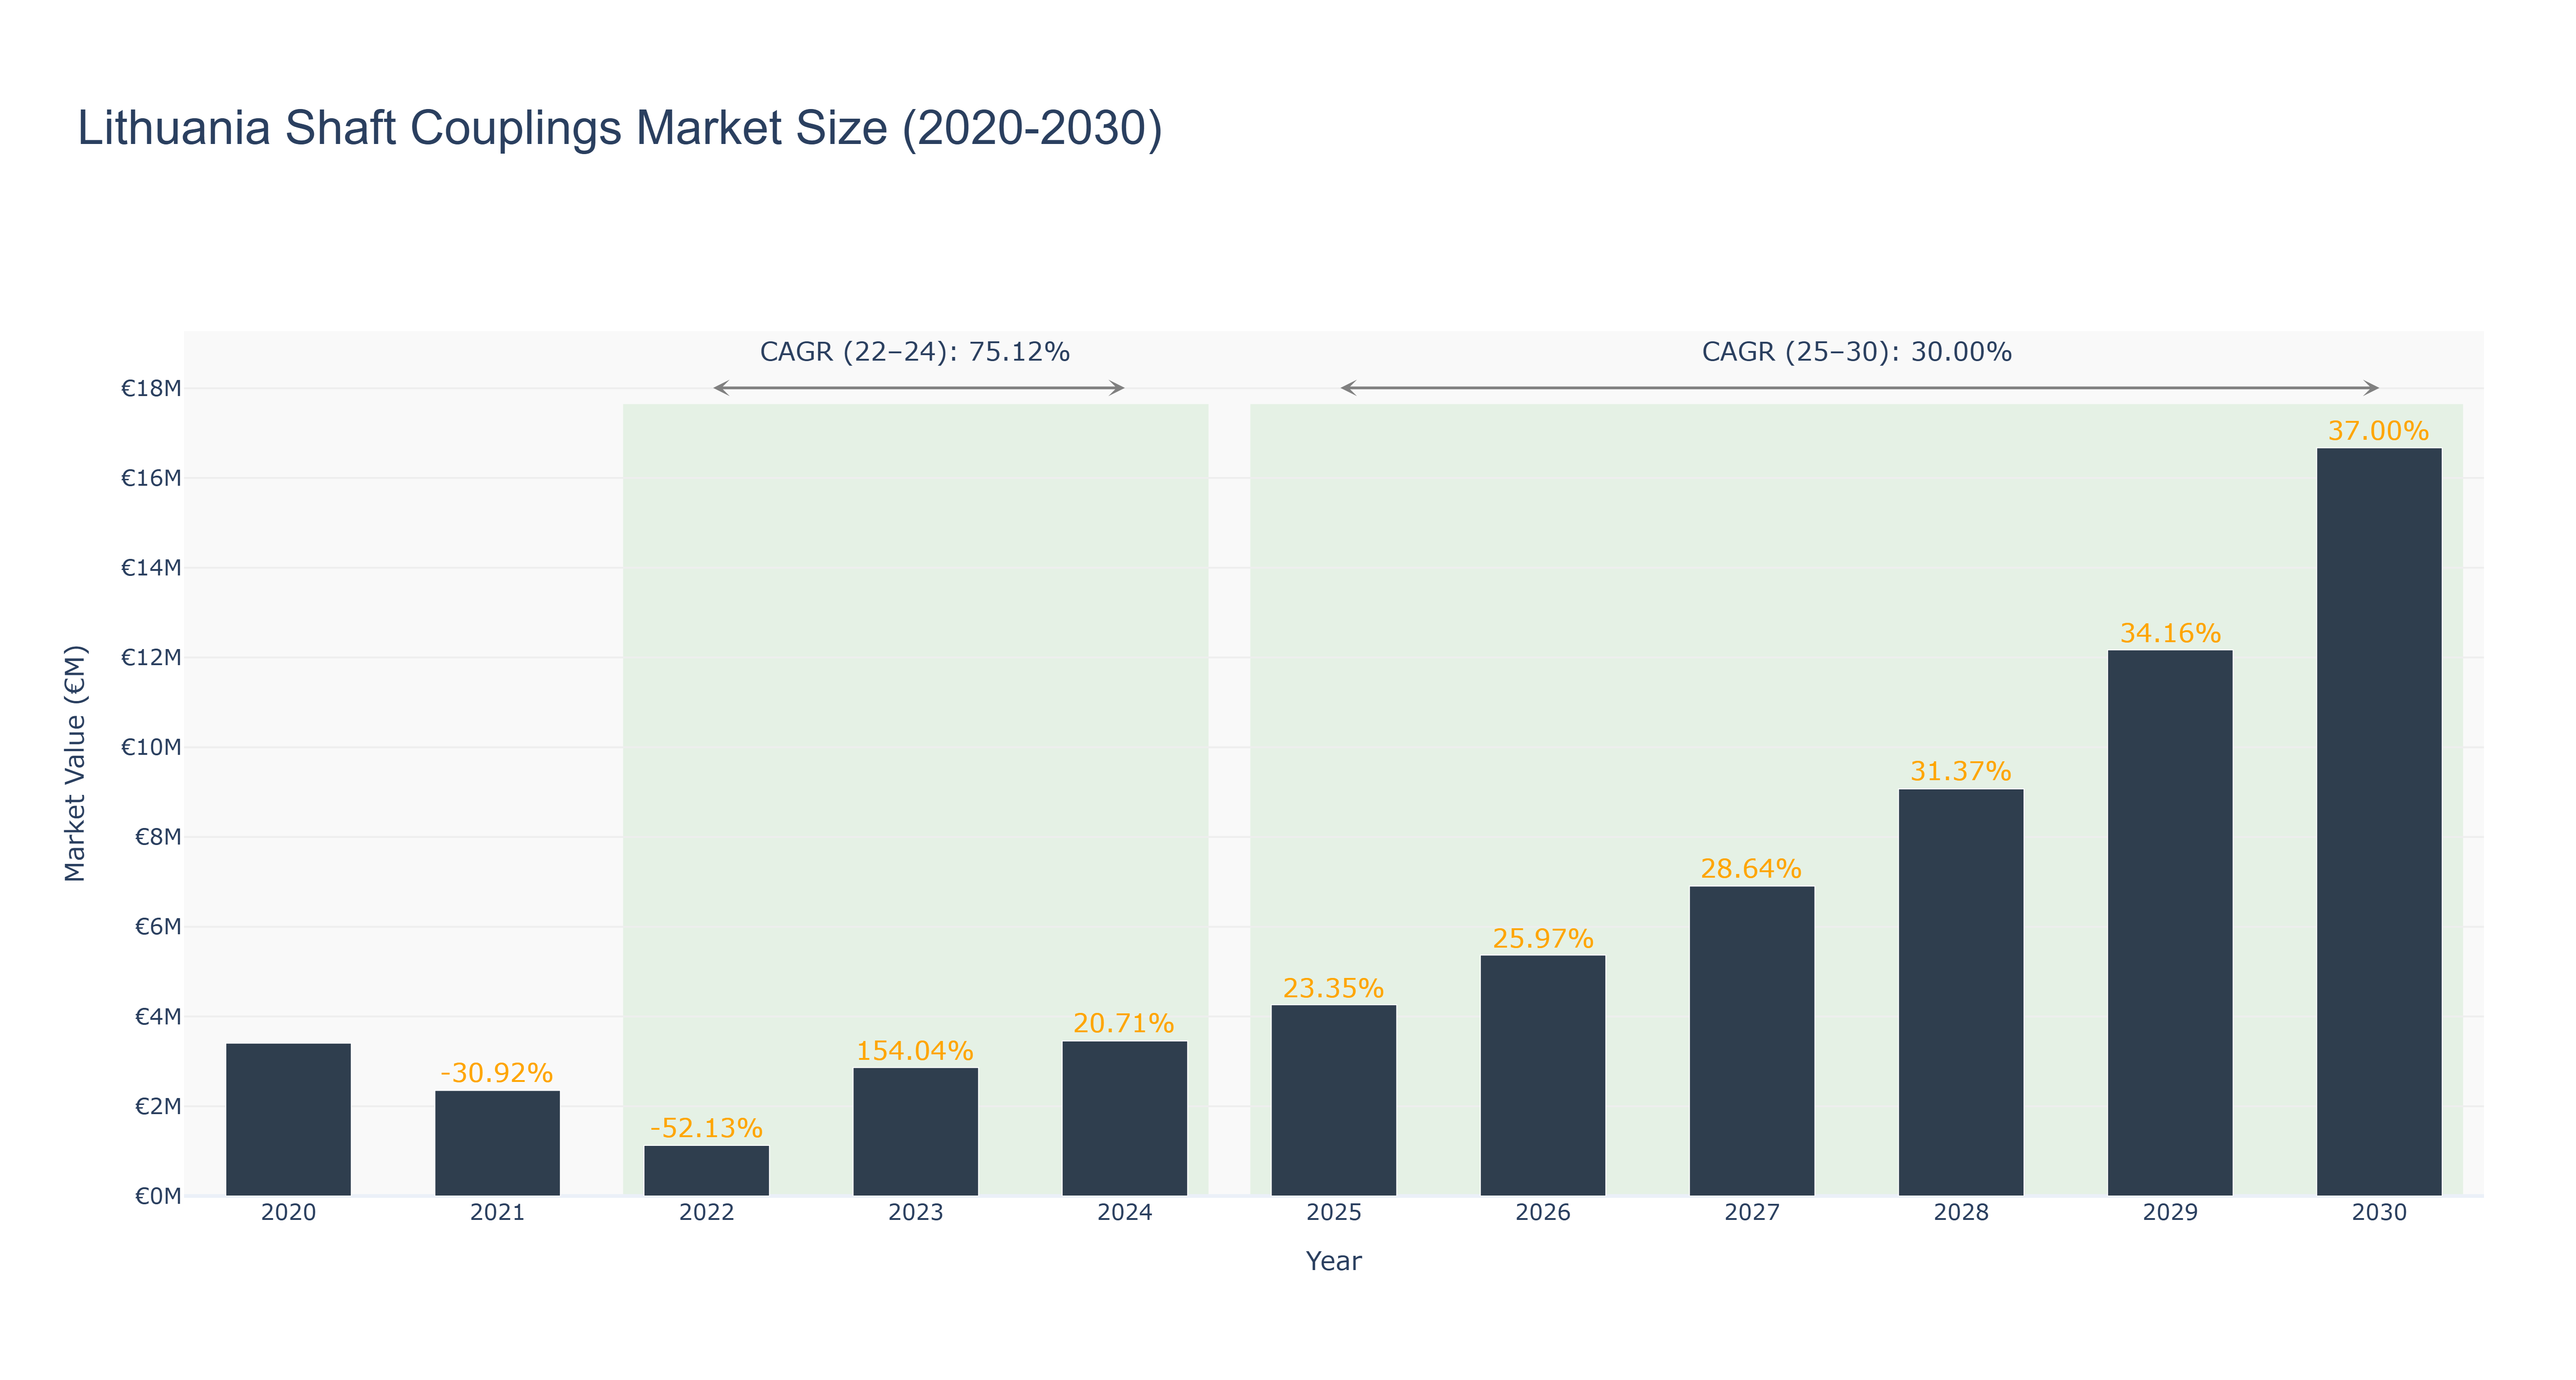
The Lithuania Shaft Couplings Market experienced a significant decline in market size from €3.41 million in 2020 to €1.13 million in 2022, attributed to economic downturn and reduced industrial demand. However, the market rebounded strongly with a remarkable growth rate of 154.04% in 2023, reaching €2.86 million. The market continued its upward trajectory, with a forecasted market size of €16.67 million in 2030, driven by increasing investments in industrial infrastructure and technological advancements. The CAGR for the period 2022-24 stood at 75.12%, showcasing rapid recovery and growth potential. Looking ahead, with a CAGR of 30.0% from 2025-30, the market is poised for sustained expansion. Recent developments in Lithuania's manufacturing sector, particularly in the renewable energy industry, are expected to further drive demand for shaft couplings in the coming years.
Lithuania Shaft Couplings Market: Production & Trade Performance (2019-2025)
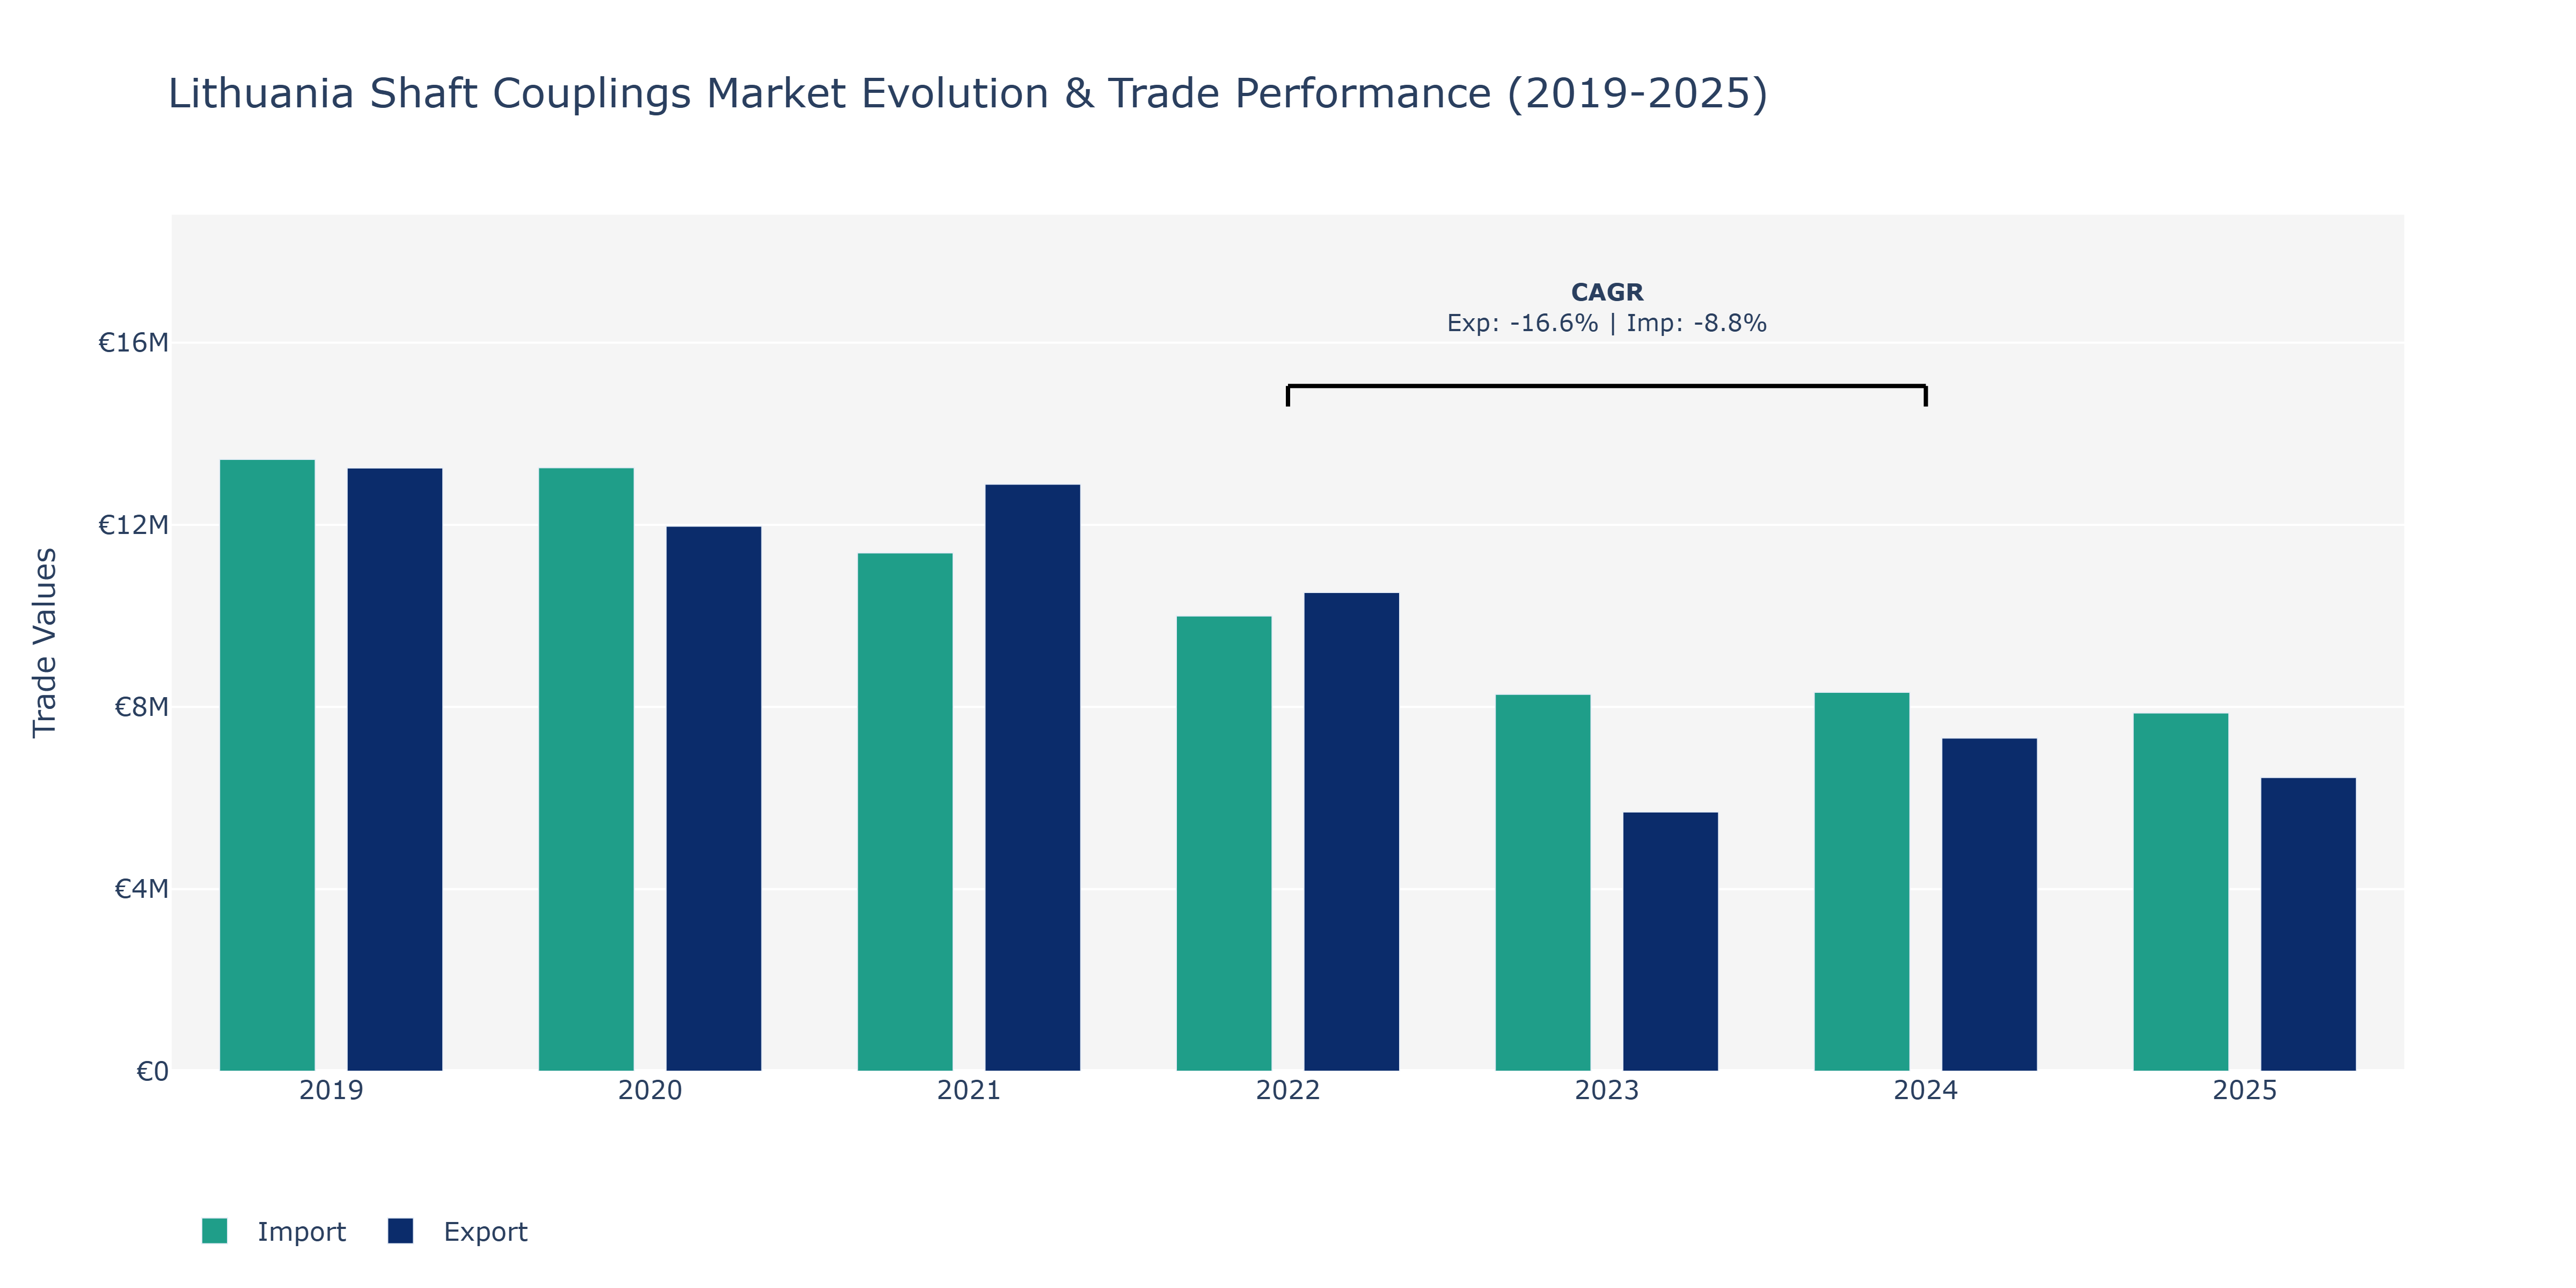
Between 2019 and 2025, Lithuania's Shaft Couplings Market experienced notable shifts in both Exports and Imports. The Exports started at €13.25 million in 2019, decreasing to €5.69 million in 2023 before rising to €6.45 million in 2025. Conversely, Imports began at €13.44 million in 2019, then decreased to €8.28 million in 2023, and slightly climbed to €7.87 million in 2025. The declining trend in Exports from 2019 to 2023 could be attributed to global economic uncertainties and trade disruptions. Conversely, the rebound in both Exports and Imports post-2023 might indicate market stabilization and recovery efforts. The fluctuations in demand for shaft couplings, perhaps influenced by varying industrial activities and technological advancements, could have contributed to these shifts. Furthermore, the negative CAGR for both Exports and Imports during 2022-2024 showcases the market's challenges, urging stakeholders to strategize for resilience and competitiveness amidst changing market dynamics.
Key Highlights of the Report:
- Lithuania Shaft Couplings Market Outlook
- Market Size of Lithuania Shaft Couplings Market, 2025
- Forecast of Lithuania Shaft Couplings Market, 2032
- Historical Data and Forecast of Lithuania Shaft Couplings Revenues & Volume for the Period 2022 - 2032F
- Lithuania Shaft Couplings Market Trend Evolution
- Lithuania Shaft Couplings Market Drivers and Challenges
- Lithuania Shaft Couplings Price Trends
- Lithuania Shaft Couplings Porter`s Five Forces
- Lithuania Shaft Couplings Industry Life Cycle
- Historical Data and Forecast of Lithuania Shaft Couplings Market Revenues & Volume By Type for the Period 2022 - 2032F
- Historical Data and Forecast of Lithuania Shaft Couplings Market Revenues & Volume By Flexible Couplings for the Period 2022 - 2032F
- Historical Data and Forecast of Lithuania Shaft Couplings Market Revenues & Volume By Disc Rigid Couplings for the Period 2022 - 2032F
- Historical Data and Forecast of Lithuania Shaft Couplings Market Revenues & Volume By Application for the Period 2022 - 2032F
- Historical Data and Forecast of Lithuania Shaft Couplings Market Revenues & Volume By Power and Energy for the Period 2022 - 2032F
- Historical Data and Forecast of Lithuania Shaft Couplings Market Revenues & Volume By Automotive Industry for the Period 2022 - 2032F
- Historical Data and Forecast of Lithuania Shaft Couplings Market Revenues & Volume By Steel Industry for the Period 2022 - 2032F
- Lithuania Shaft Couplings Import Export Trade Statistics
- Market Opportunity Assessment By Type
- Market Opportunity Assessment By Application
- Lithuania Shaft Couplings Top Companies Market Share
- Lithuania Shaft Couplings Competitive Benchmarking By Technical and Operational Parameters
- Lithuania Shaft Couplings Company Profiles
- Lithuania Shaft Couplings Key Strategic Recommendations
Frequently Asked Questions About the Market Study (FAQs):
6Wresearch actively monitors the Lithuania Shaft Couplings Market and publishes its comprehensive annual report, highlighting emerging trends, growth drivers, revenue analysis, and forecast outlook. Our insights help businesses to make data-backed strategic decisions with ongoing market dynamics. Our analysts track relevent industries related to the Lithuania Shaft Couplings Market, allowing our clients with actionable intelligence and reliable forecasts tailored to emerging regional needs.
Yes, we provide customisation as per your requirements. To learn more, feel free to contact us on sales@6wresearch.com
1 Executive Summary |
2 Introduction |
2.1 Key Highlights of the Report |
2.2 Report Description |
2.3 Market Scope & Segmentation |
2.4 Research Methodology |
2.5 Assumptions |
3 Lithuania Shaft Couplings Market Overview |
3.1 Lithuania Country Macro Economic Indicators |
3.2 Lithuania Shaft Couplings Market Revenues & Volume, 2022 & 2032F |
3.3 Lithuania Shaft Couplings Market - Industry Life Cycle |
3.4 Lithuania Shaft Couplings Market - Porter's Five Forces |
3.5 Lithuania Shaft Couplings Market Revenues & Volume Share, By Type, 2022 & 2032F |
3.6 Lithuania Shaft Couplings Market Revenues & Volume Share, By Application, 2022 & 2032F |
4 Lithuania Shaft Couplings Market Dynamics |
4.1 Impact Analysis |
4.2 Market Drivers |
4.2.1 Growing industrial automation in Lithuania leading to increased demand for shaft couplings |
4.2.2 Expansion of manufacturing sector in Lithuania driving the need for efficient machinery components like shaft couplings |
4.2.3 Technological advancements in shaft coupling materials and design enhancing performance and durability |
4.3 Market Restraints |
4.3.1 Economic fluctuations impacting investments in industrial machinery and equipment, affecting shaft coupling market growth |
4.3.2 Competition from substitute products like flexible couplings impacting the market share of shaft couplings |
4.3.3 Regulatory challenges and compliance requirements affecting the production and distribution of shaft couplings in Lithuania |
5 Lithuania Shaft Couplings Market Trends |
6 Lithuania Shaft Couplings Market Segmentations |
6.1 Lithuania Shaft Couplings Market, By Type |
6.1.1 Overview and Analysis |
6.1.2 Lithuania Shaft Couplings Market Revenues & Volume, By Flexible Couplings, 2022 - 2032F |
6.1.3 Lithuania Shaft Couplings Market Revenues & Volume, By Disc Rigid Couplings, 2022 - 2032F |
6.2 Lithuania Shaft Couplings Market, By Application |
6.2.1 Overview and Analysis |
6.2.2 Lithuania Shaft Couplings Market Revenues & Volume, By Power and Energy, 2022 - 2032F |
6.2.3 Lithuania Shaft Couplings Market Revenues & Volume, By Automotive Industry, 2022 - 2032F |
6.2.4 Lithuania Shaft Couplings Market Revenues & Volume, By Steel Industry, 2022 - 2032F |
7 Lithuania Shaft Couplings Market Import-Export Trade Statistics |
7.1 Lithuania Shaft Couplings Market Export to Major Countries |
7.2 Lithuania Shaft Couplings Market Imports from Major Countries |
8 Lithuania Shaft Couplings Market Key Performance Indicators |
8.1 Average order value per customer for shaft couplings in Lithuania |
8.2 Number of new product launches or innovations in the shaft coupling market |
8.3 Percentage of repeat customers or customer retention rate for shaft coupling suppliers in Lithuania |
9 Lithuania Shaft Couplings Market - Opportunity Assessment |
9.1 Lithuania Shaft Couplings Market Opportunity Assessment, By Type, 2022 & 2032F |
9.2 Lithuania Shaft Couplings Market Opportunity Assessment, By Application, 2022 & 2032F |
10 Lithuania Shaft Couplings Market - Competitive Landscape |
10.1 Lithuania Shaft Couplings Market Revenue Share, By Companies, 2025 |
10.2 Lithuania Shaft Couplings Market Competitive Benchmarking, By Operating and Technical Parameters |
11 Company Profiles |
12 Recommendations | 13 Disclaimer |
Global Go To Market Strategy - 2030
Export potential enables firms to identify high-growth global markets with greater confidence by combining advanced trade intelligence with a structured quantitative methodology. The framework analyzes emerging demand trends and country-level import patterns while integrating macroeconomic and trade datasets such as GDP and population forecasts, bilateral import–export flows, tariff structures, elasticity differentials between developed and developing economies, geographic distance, and import demand projections. Using weighted trade values from 2020–2024 as the base period to project country-to-country export potential for 2030, these inputs are operationalized through calculated drivers such as gravity model parameters, tariff impact factors, and projected GDP per-capita growth. Through an analysis of hidden potentials, demand hotspots, and market conditions that are most favorable to success, this method enables firms to focus on target countries, maximize returns, and global expansion with data, backed by accuracy.
By factoring in the projected importer demand gap that is currently unmet and could be potential opportunity, it identifies the potential for the Exporter (Country) among 190 countries, against the general trade analysis, which identifies the biggest importer or exporter.
To discover high-growth global markets and optimize your business strategy:
Click Here
Pricing
- Single User License$ 1,995
- Department License$ 2,400
- Site License$ 3,120
- Global License$ 3,795

Leadership Perspectives from Industry Events
Search
Thought Leadership and Analyst Meet


Our Clients
6WResearch In News
- India Export Attractiveness Tracker 2026
- India Air Conditioner Market Set for Strong Rebound in 2026 After Weather-Led Correction and GST-Driven Recovery: 6Wresearch
- ADAS in India: How Automatic Emergency Braking, Blind Spot Detection & Driver Monitoring are Transforming Road Safety
- Doha a strategic location for EV manufacturing hub: IPA Qatar
- Demand for luxury TVs surging in the GCC, says Samsung
- Empowering Growth: The Thriving Journey of Bangladesh’s Cable Industry
Latest Reports
- Qatar Access and Home Network Market (2026-2032)
- Nicaragua RPG Gaming Market (2026-2032)
- New Zealand RPG Gaming Market (2026-2032)
- Netherlands RPG Gaming Market (2026-2032)
- Nauru RPG Gaming Market (2026-2032)
- Namibia RPG Gaming Market (2026-2032)
- Mozambique RPG Gaming Market (2026-2032)
- Montenegro RPG Gaming Market (2026-2032)
- Mongolia RPG Gaming Market (2026-2032)
- Monaco RPG Gaming Market (2026-2032)
Industry Events and Analyst Meet

EV India Expo 2026

HIMTEX 2026

India Refining Summit 2026

India EV Show 2026

EV tech India Expo 2026
Whitepaper
- Middle East & Africa Commercial Security Market Click here to view more.
- Middle East & Africa Fire Safety Systems & Equipment Market Click here to view more.
- GCC Drone Market Click here to view more.
- Middle East Lighting Fixture Market Click here to view more.
- GCC Physical & Perimeter Security Market Click here to view more.