Lithuania Silver Market (2026-2032) | Companies, Industry, Analysis, Share, Outlook, Revenue, Trends, Forecast, Growth, Size, Segmentation & Value
Market Forecast By Type (Sterling Silver, German Silver, Coin Silver, Britannia Silver, Mexican Silver, Russian Silver, Oxidized Silver, Others), By Application (Silverware, Industrial, Jewelry, Investment, Photographic , Films, Electrical And Electronics, Pharmaceuticals) And Competitive Landscape
| Product Code: ETC5214324 | Publication Date: Nov 2023 | Updated Date: Apr 2026 | Product Type: Market Research Report | |
| Publisher: 6Wresearch | Author: Shubham Padhi | No. of Pages: 60 | No. of Figures: 30 | No. of Tables: 5 |
Lithuania Silver Market Size (2020-2030)
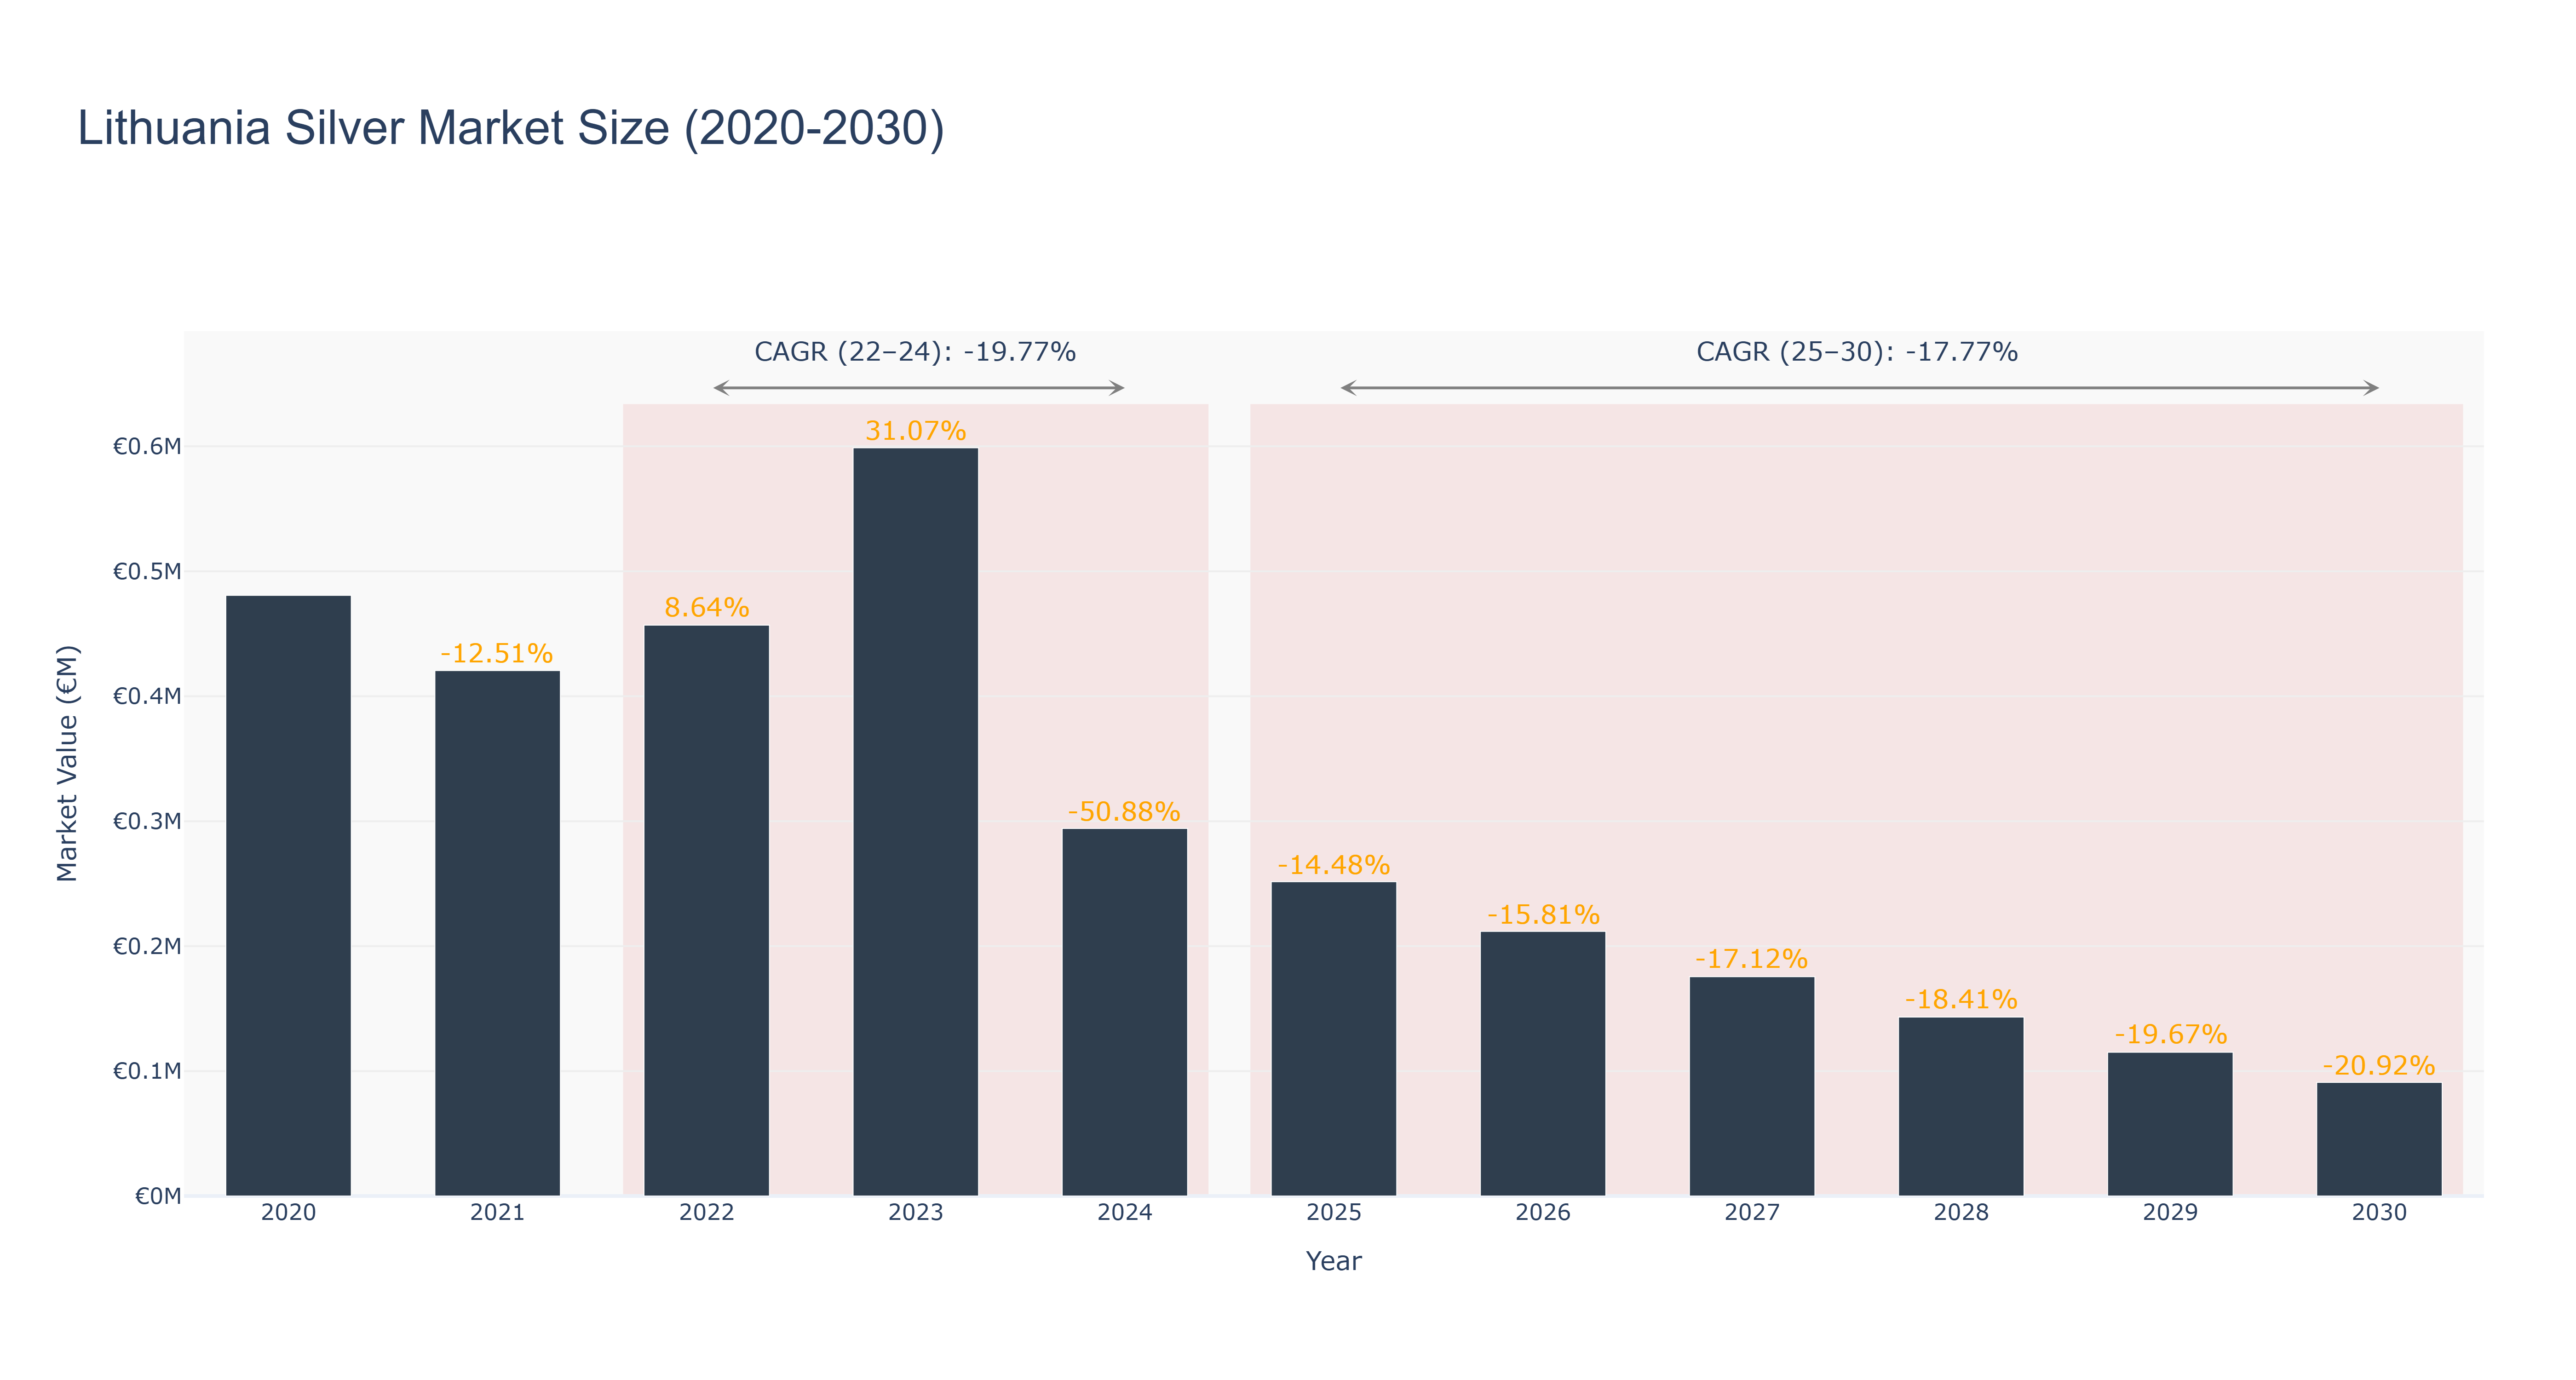
The Lithuania Silver Market experienced fluctuations between 2020 and 2024, peaking at €480.71 thousand in 2020 before witnessing a decline to €294.13 thousand by 2024, which represents a cumulative annual growth rate (CAGR) of -19.77% for the actual period. The market displayed a notable recovery in 2023, with a growth rate of 31.07%, attributed to rising consumer interest in silver as an investment amidst economic uncertainty. However, the forecasted period from 2025 to 2030 predicts a continuous decline, with market sizes projected to decrease from €251.52 thousand in 2025 to €90.96 thousand by 2030, reflecting a CAGR of -17.77%. This downturn may stem from increased competition from alternative investment vehicles and potential shifts in consumer preferences. While there are no specific upcoming projects identified, macroeconomic factors such as inflation and geopolitical tensions will likely influence market dynamics going forward.
Lithuania Silver Market: Production & Trade Performance (2019-2025)
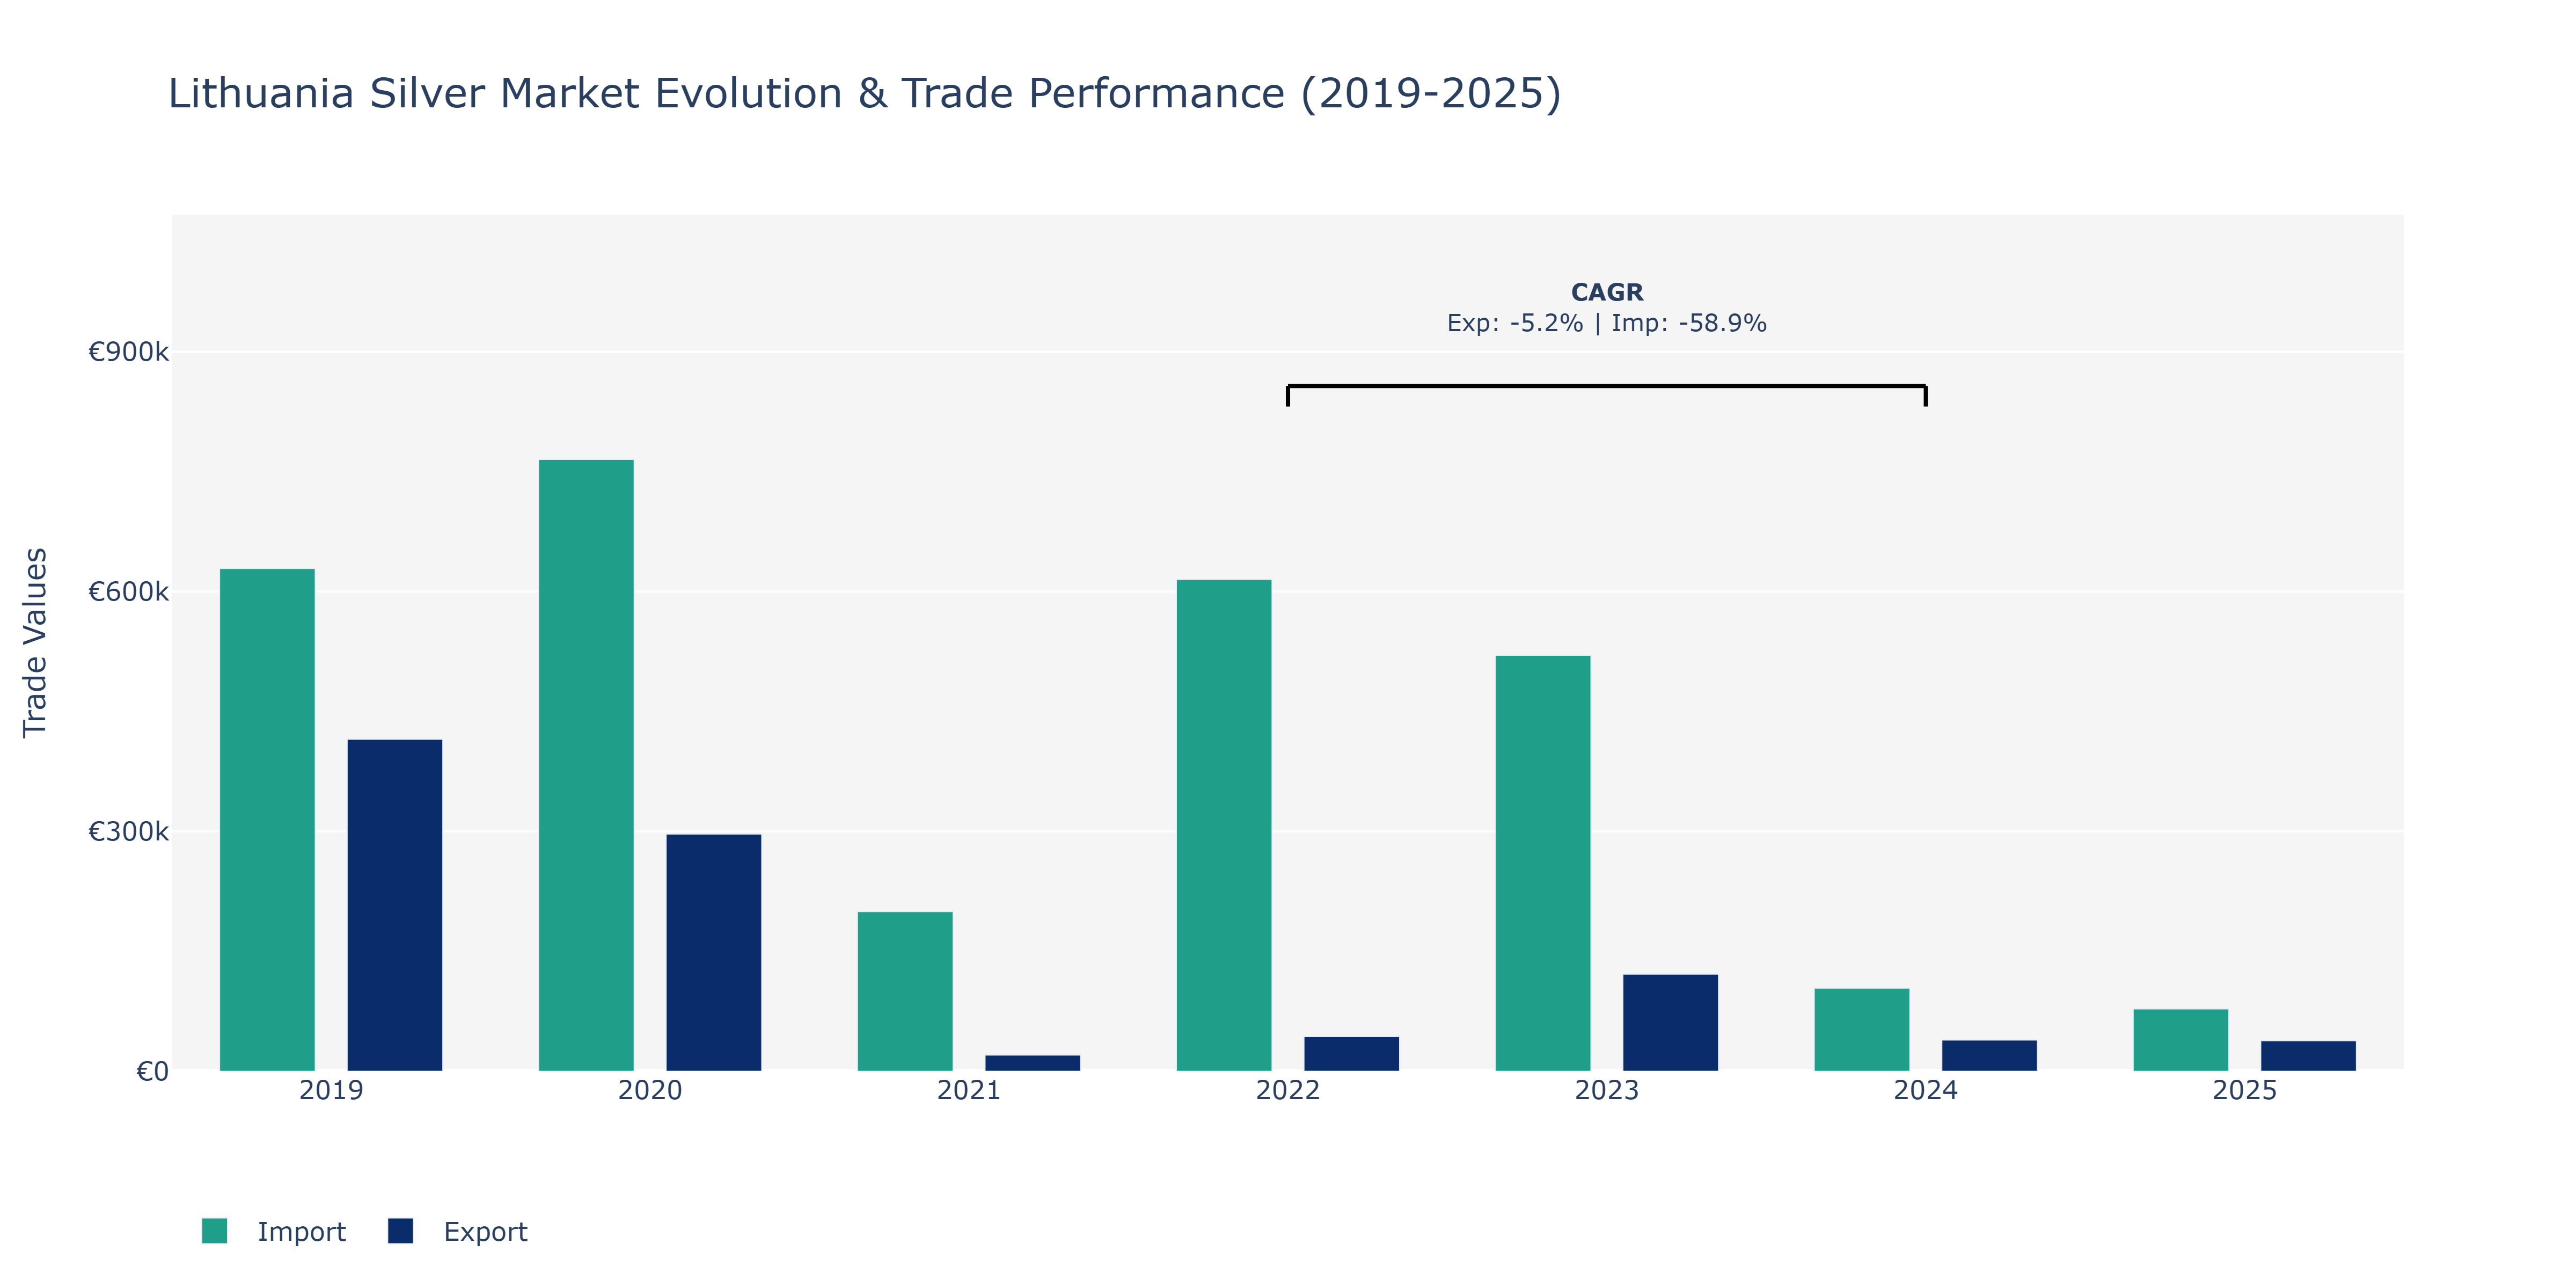
Between 2019 and 2025, Lithuania's Silver Market experienced notable fluctuations in exports and imports. The sector saw a substantial decrease in exports from €415.19 thousand in 2019 to €20.38 thousand in 2021, before a slight recovery to €38.17 thousand in 2025. In contrast, imports peaked at €765.4 thousand in 2020 and then gradually declined to €77.95 thousand in 2025. The drop in imports by nearly €688 million can be attributed to shifting consumer preferences towards locally sourced silver products, leading to reduced demand for imported goods. The export decline may be associated with global economic challenges impacting trade volumes. Furthermore, the significant CAGR of -58.95% in imports from 2022 to 2024 suggests a rapid shift in market dynamics, possibly influenced by increased domestic production capabilities or trade regulations favoring local industries. These trends highlight the market's sensitivity to economic conditions and evolving consumer behavior.
Key Highlights of the Report:
- Lithuania Silver Market Outlook
- Market Size of Lithuania Silver Market, 2025
- Forecast of Lithuania Silver Market, 2032
- Historical Data and Forecast of Lithuania Silver Revenues & Volume for the Period 2022 - 2032F
- Lithuania Silver Market Trend Evolution
- Lithuania Silver Market Drivers and Challenges
- Lithuania Silver Price Trends
- Lithuania Silver Porter`s Five Forces
- Lithuania Silver Industry Life Cycle
- Historical Data and Forecast of Lithuania Silver Market Revenues & Volume By Type for the Period 2022 - 2032F
- Historical Data and Forecast of Lithuania Silver Market Revenues & Volume By Sterling Silver for the Period 2022 - 2032F
- Historical Data and Forecast of Lithuania Silver Market Revenues & Volume By German Silver for the Period 2022 - 2032F
- Historical Data and Forecast of Lithuania Silver Market Revenues & Volume By Coin Silver for the Period 2022 - 2032F
- Historical Data and Forecast of Lithuania Silver Market Revenues & Volume By Britannia Silver for the Period 2022 - 2032F
- Historical Data and Forecast of Lithuania Silver Market Revenues & Volume By Mexican Silver for the Period 2022 - 2032F
- Historical Data and Forecast of Lithuania Silver Market Revenues & Volume By Russian Silver for the Period 2022 - 2032F
- Historical Data and Forecast of Lithuania Silver Market Revenues & Volume By Oxidized Silver for the Period 2022 - 2032F
- Historical Data and Forecast of Lithuania Sterling Silver Silver Market Revenues & Volume By Others for the Period 2022 - 2032F
- Historical Data and Forecast of Lithuania Silver Market Revenues & Volume By Application for the Period 2022 - 2032F
- Historical Data and Forecast of Lithuania Silver Market Revenues & Volume By Silverware for the Period 2022 - 2032F
- Historical Data and Forecast of Lithuania Silver Market Revenues & Volume By Industrial for the Period 2022 - 2032F
- Historical Data and Forecast of Lithuania Silver Market Revenues & Volume By Jewelry for the Period 2022 - 2032F
- Historical Data and Forecast of Lithuania Silver Market Revenues & Volume By Investment for the Period 2022 - 2032F
- Historical Data and Forecast of Lithuania Silver Market Revenues & Volume By Photographic for the Period 2022 - 2032F
- Historical Data and Forecast of Lithuania Silver Market Revenues & Volume By Films for the Period 2022 - 2032F
- Historical Data and Forecast of Lithuania Silver Market Revenues & Volume By Electrical And Electronics for the Period 2022 - 2032F
- Historical Data and Forecast of Lithuania Silver Market Revenues & Volume By Pharmaceuticals for the Period 2022 - 2032F
- Lithuania Silver Import Export Trade Statistics
- Market Opportunity Assessment By Type
- Market Opportunity Assessment By Application
- Lithuania Silver Top Companies Market Share
- Lithuania Silver Competitive Benchmarking By Technical and Operational Parameters
- Lithuania Silver Company Profiles
- Lithuania Silver Key Strategic Recommendations
Frequently Asked Questions About the Market Study (FAQs):
6Wresearch actively monitors the Lithuania Silver Market and publishes its comprehensive annual report, highlighting emerging trends, growth drivers, revenue analysis, and forecast outlook. Our insights help businesses to make data-backed strategic decisions with ongoing market dynamics. Our analysts track relevent industries related to the Lithuania Silver Market, allowing our clients with actionable intelligence and reliable forecasts tailored to emerging regional needs.
Yes, we provide customisation as per your requirements. To learn more, feel free to contact us on sales@6wresearch.com
1 Executive Summary |
2 Introduction |
2.1 Key Highlights of the Report |
2.2 Report Description |
2.3 Market Scope & Segmentation |
2.4 Research Methodology |
2.5 Assumptions |
3 Lithuania Silver Market Overview |
3.1 Lithuania Country Macro Economic Indicators |
3.2 Lithuania Silver Market Revenues & Volume, 2022 & 2032F |
3.3 Lithuania Silver Market - Industry Life Cycle |
3.4 Lithuania Silver Market - Porter's Five Forces |
3.5 Lithuania Silver Market Revenues & Volume Share, By Type, 2022 & 2032F |
3.6 Lithuania Silver Market Revenues & Volume Share, By Application, 2022 & 2032F |
4 Lithuania Silver Market Dynamics |
4.1 Impact Analysis |
4.2 Market Drivers |
4.2.1 Increasing disposable income in Lithuania, leading to higher purchasing power for luxury items like silver jewelry. |
4.2.2 Growing fashion consciousness among consumers, driving demand for trendy silver accessories. |
4.2.3 Rising popularity of online shopping platforms, providing easier access to a wider range of silver products. |
4.3 Market Restraints |
4.3.1 Fluctuating silver prices in the global market impacting the cost of production and ultimately the retail prices of silver items. |
4.3.2 Competition from alternative materials like stainless steel or imitation silver affecting the demand for pure silver products. |
4.3.3 Economic uncertainties or downturns affecting consumer spending on non-essential items like silver jewelry. |
5 Lithuania Silver Market Trends |
6 Lithuania Silver Market Segmentations |
6.1 Lithuania Silver Market, By Type |
6.1.1 Overview and Analysis |
6.1.2 Lithuania Silver Market Revenues & Volume, By Sterling Silver, 2022 - 2032F |
6.1.3 Lithuania Silver Market Revenues & Volume, By German Silver, 2022 - 2032F |
6.1.4 Lithuania Silver Market Revenues & Volume, By Coin Silver, 2022 - 2032F |
6.1.5 Lithuania Silver Market Revenues & Volume, By Britannia Silver, 2022 - 2032F |
6.1.6 Lithuania Silver Market Revenues & Volume, By Mexican Silver, 2022 - 2032F |
6.1.7 Lithuania Silver Market Revenues & Volume, By Russian Silver, 2022 - 2032F |
6.1.9 Lithuania Silver Market Revenues & Volume, By Others, 2022 - 2032F |
6.1.10 Lithuania Silver Market Revenues & Volume, By Others, 2022 - 2032F |
6.2 Lithuania Silver Market, By Application |
6.2.1 Overview and Analysis |
6.2.2 Lithuania Silver Market Revenues & Volume, By Silverware, 2022 - 2032F |
6.2.3 Lithuania Silver Market Revenues & Volume, By Industrial, 2022 - 2032F |
6.2.4 Lithuania Silver Market Revenues & Volume, By Jewelry, 2022 - 2032F |
6.2.5 Lithuania Silver Market Revenues & Volume, By Investment, 2022 - 2032F |
6.2.6 Lithuania Silver Market Revenues & Volume, By Photographic , 2022 - 2032F |
6.2.7 Lithuania Silver Market Revenues & Volume, By Films, 2022 - 2032F |
6.2.8 Lithuania Silver Market Revenues & Volume, By Pharmaceuticals, 2022 - 2032F |
6.2.9 Lithuania Silver Market Revenues & Volume, By Pharmaceuticals, 2022 - 2032F |
7 Lithuania Silver Market Import-Export Trade Statistics |
7.1 Lithuania Silver Market Export to Major Countries |
7.2 Lithuania Silver Market Imports from Major Countries |
8 Lithuania Silver Market Key Performance Indicators |
8.1 Average order value for silver products in Lithuania. |
8.2 Customer retention rate for silver jewelry stores. |
8.3 Website traffic and conversion rates for online silver jewelry retailers. |
8.4 Social media engagement and following for silver brands in Lithuania. |
8.5 Percentage of repeat purchases in the silver market segment. |
9 Lithuania Silver Market - Opportunity Assessment |
9.1 Lithuania Silver Market Opportunity Assessment, By Type, 2022 & 2032F |
9.2 Lithuania Silver Market Opportunity Assessment, By Application, 2022 & 2032F |
10 Lithuania Silver Market - Competitive Landscape |
10.1 Lithuania Silver Market Revenue Share, By Companies, 2025 |
10.2 Lithuania Silver Market Competitive Benchmarking, By Operating and Technical Parameters |
11 Company Profiles |
12 Recommendations | 13 Disclaimer |
Global Go To Market Strategy - 2030
Export potential enables firms to identify high-growth global markets with greater confidence by combining advanced trade intelligence with a structured quantitative methodology. The framework analyzes emerging demand trends and country-level import patterns while integrating macroeconomic and trade datasets such as GDP and population forecasts, bilateral import–export flows, tariff structures, elasticity differentials between developed and developing economies, geographic distance, and import demand projections. Using weighted trade values from 2020–2024 as the base period to project country-to-country export potential for 2030, these inputs are operationalized through calculated drivers such as gravity model parameters, tariff impact factors, and projected GDP per-capita growth. Through an analysis of hidden potentials, demand hotspots, and market conditions that are most favorable to success, this method enables firms to focus on target countries, maximize returns, and global expansion with data, backed by accuracy.
By factoring in the projected importer demand gap that is currently unmet and could be potential opportunity, it identifies the potential for the Exporter (Country) among 190 countries, against the general trade analysis, which identifies the biggest importer or exporter.
To discover high-growth global markets and optimize your business strategy:
Click Here
Pricing
- Single User License$ 1,995
- Department License$ 2,400
- Site License$ 3,120
- Global License$ 3,795

Leadership Perspectives from Industry Events
Search
Thought Leadership and Analyst Meet


Our Clients
6WResearch In News
- Doha a strategic location for EV manufacturing hub: IPA Qatar
- Demand for luxury TVs surging in the GCC, says Samsung
- Empowering Growth: The Thriving Journey of Bangladesh’s Cable Industry
- Demand for luxury TVs surging in the GCC, says Samsung
- Video call with a traditional healer? Once unthinkable, it’s now common in South Africa
- Intelligent Buildings To Smooth GCC’s Path To Net Zero
Latest Reports
- Cape Verde Portable Hand-Thrown Extinguisher Market (2026-2032)
- Canada Portable Hand-Thrown Extinguisher Market (2026-2032)
- Cameroon Portable Hand-Thrown Extinguisher Market (2026-2032)
- Burundi Portable Hand-Thrown Extinguisher Market (2026-2032)
- Burkina Faso Portable Hand-Thrown Extinguisher Market (2026-2032)
- Bulgaria Portable Hand-Thrown Extinguisher Market (2026-2032)
- Brunei Portable Hand-Thrown Extinguisher Market (2026-2032)
- Botswana Portable Hand-Thrown Extinguisher Market (2026-2032)
- Bosnia and Herzegovina Portable Hand-Thrown Extinguisher Market (2026-2032)
- Bolivia Portable Hand-Thrown Extinguisher Market (2026-2032)
Industry Events and Analyst Meet

HIMTEX 2026

India Refining Summit 2026

India EV Show 2026

EV tech India Expo 2026

Auto Tech Asia 2026
Whitepaper
- Middle East & Africa Commercial Security Market Click here to view more.
- Middle East & Africa Fire Safety Systems & Equipment Market Click here to view more.
- GCC Drone Market Click here to view more.
- Middle East Lighting Fixture Market Click here to view more.
- GCC Physical & Perimeter Security Market Click here to view more.