Lithuania Sodium Thiosulfate Market (2026-2032) | Forecast, Size, Revenue, Consumer Insights, Supply, Pricing Analysis, Demand, Share, Segmentation, Competition, Restraints, Companies, Segments, Competitive, Outlook, Drivers, Opportunities, Strategy, Growth, Trends, Investment Trends, Strategic Insights, Challenges, Analysis, Value, Industry
Market Forecast By Form (Powder, Granular, Liquid, Crystalline), By Application (Medical Detoxification, Water Dechlorination, Photography, Gold Extraction), By Manufacturing Process (Sulfur Reduction, Electrolytic Process, Chemical Synthesis, Sulfite Process), By End User (Pharmaceuticals, Water Treatment, Photography Industry, Mining Industry), By Packaging Type (Bags, Drums, Containers, Bulk Storage) And Competitive Landscape
| Product Code: ETC10860666 | Publication Date: Apr 2025 | Updated Date: Apr 2026 | Product Type: Market Research Report | |
| Publisher: 6Wresearch | No. of Pages: 65 | No. of Figures: 34 | No. of Tables: 19 | |
Lithuania Sodium Thiosulfate Market Size (2020-2030)
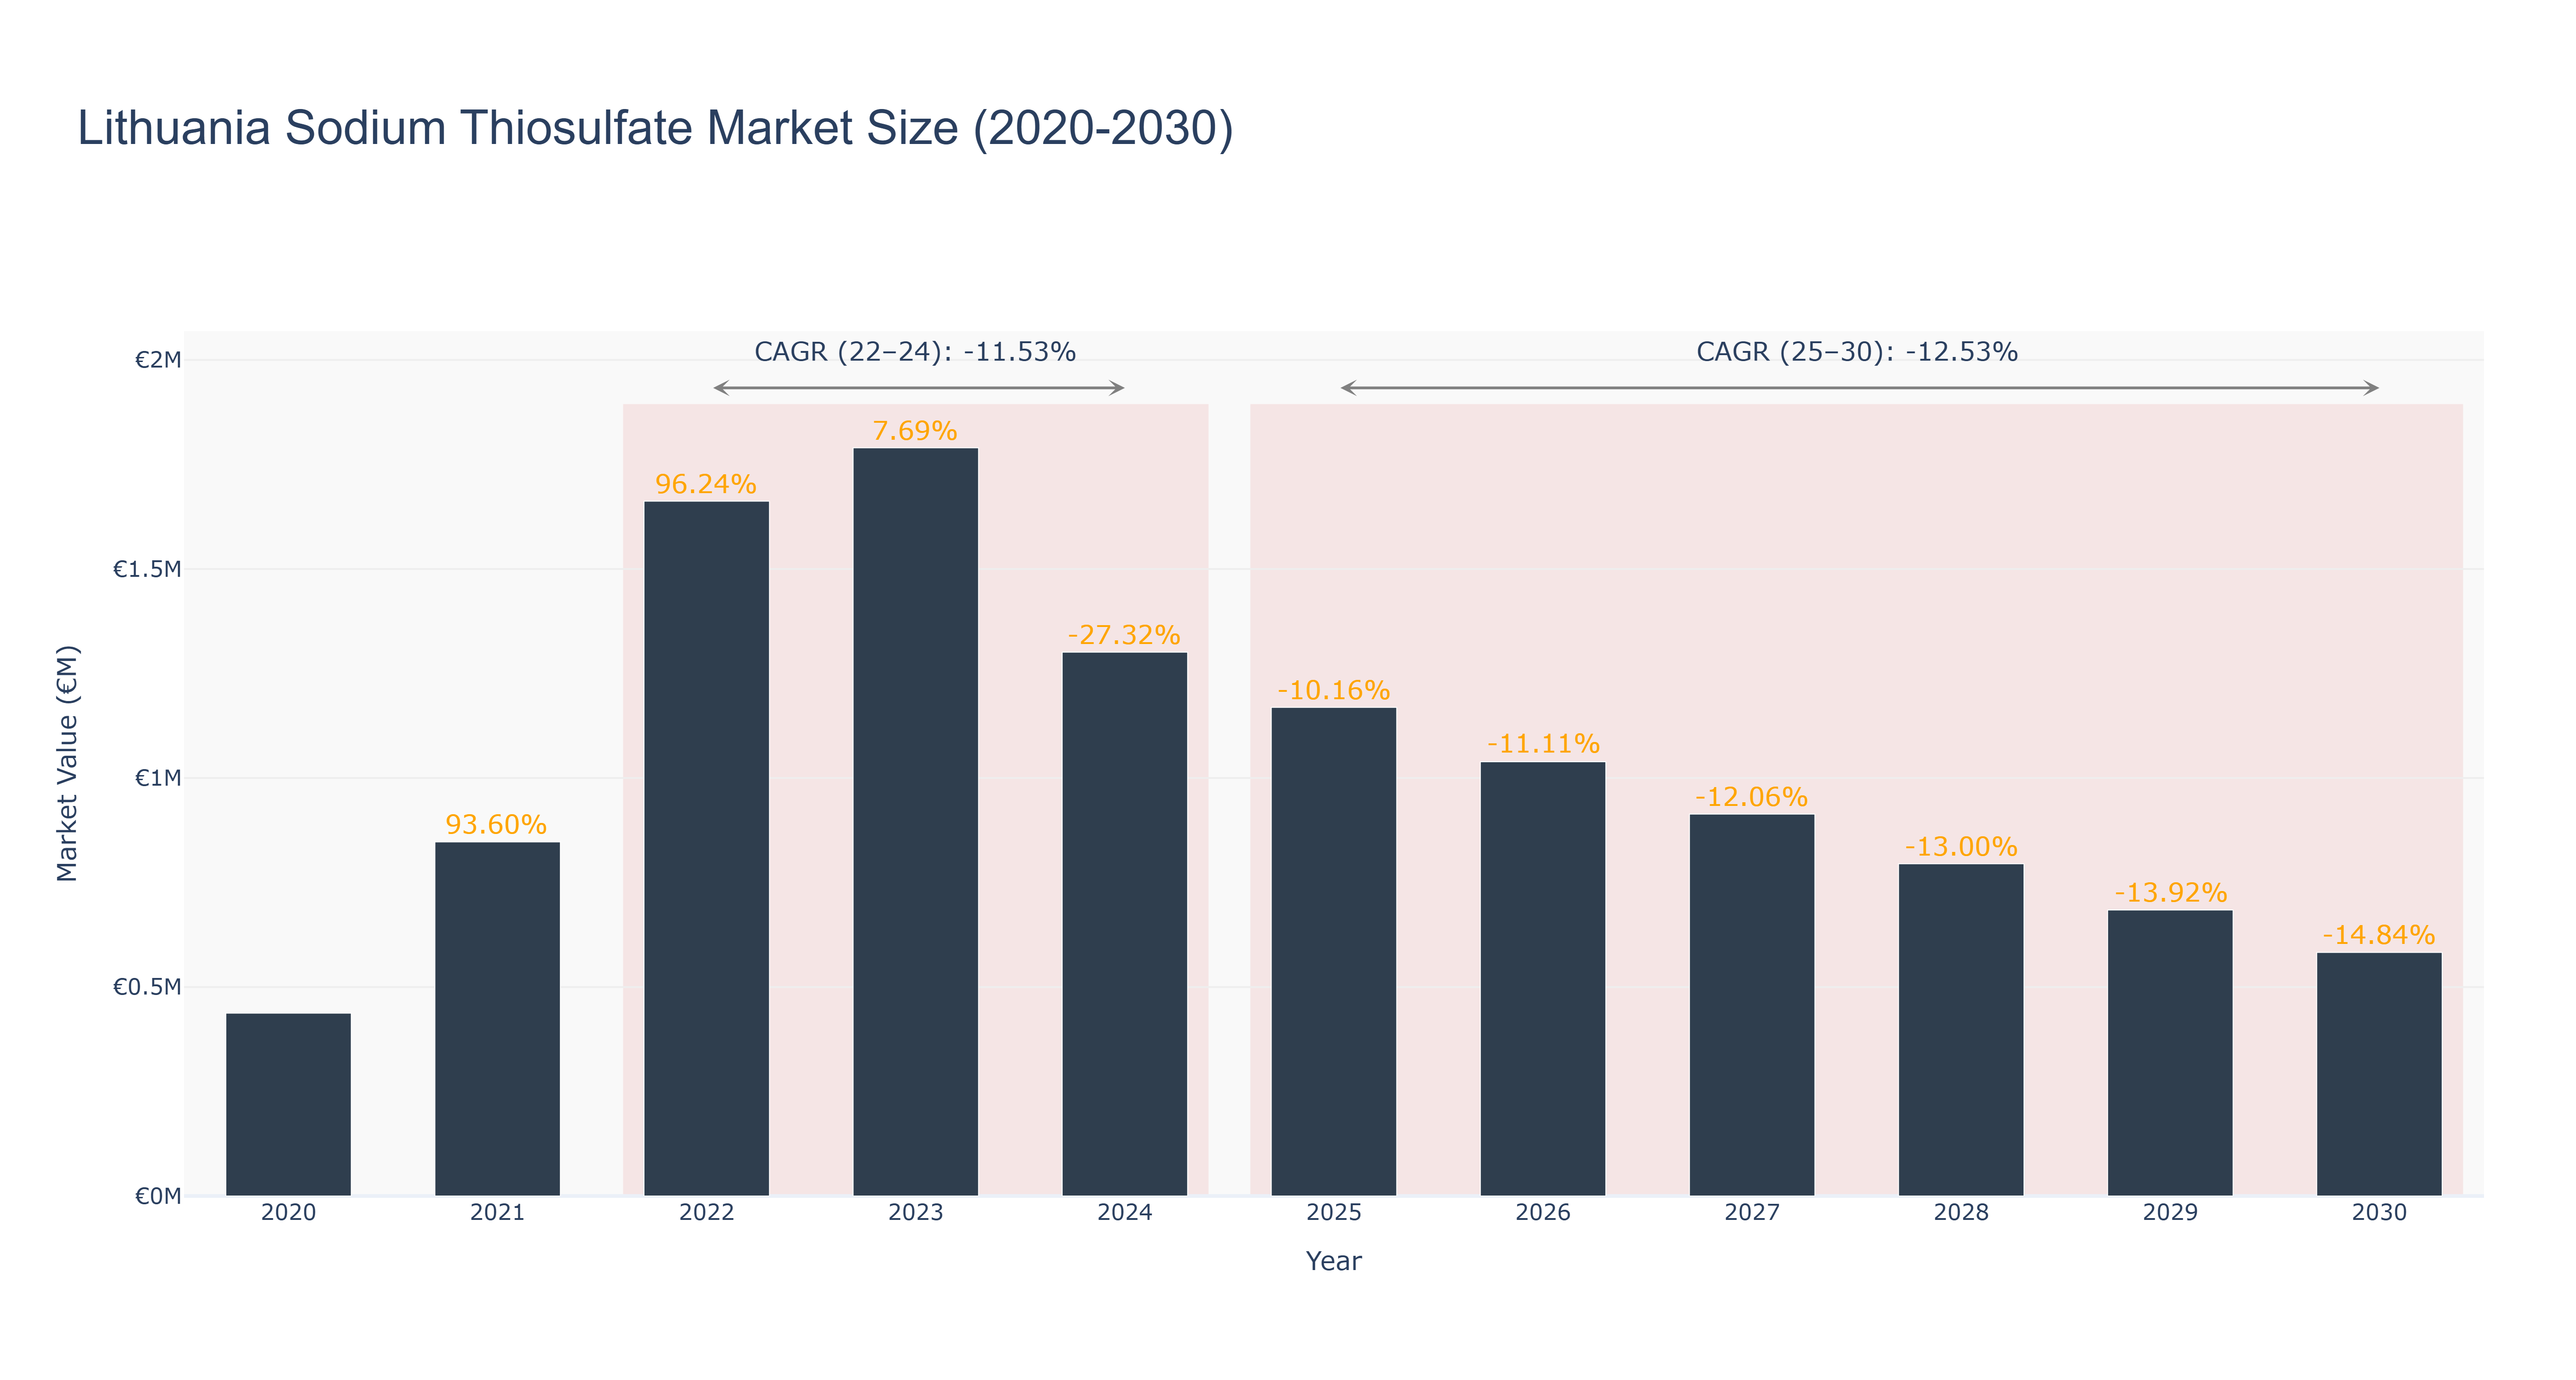
The Lithuania Sodium Thiosulfate Market experienced a peak in 2023 with a market size of €1.79 million before facing a decline. From 2020 to 2024, the market size decreased steadily, reaching €1.30 million in 2024 due to factors like changing consumer preferences and economic conditions. The forecasted market size from 2025 to 2030 shows a continued downward trend with an expected size of €0.58 million in 2030. The CAGR for the period 2022-24 is -11.53%, reflecting the market's contraction, while the CAGR for 2025-30 is projected at -12.53%. Industry drivers such as increasing competition and technological advancements are influencing this downward trend. In the near future, Lithuania is planning to invest in sustainable agriculture practices, which may impact the sodium thiosulfate market positively by creating opportunities for innovative applications in farming practices.
Lithuania Sodium Thiosulfate Market: Production & Trade Performance (2019-2025)
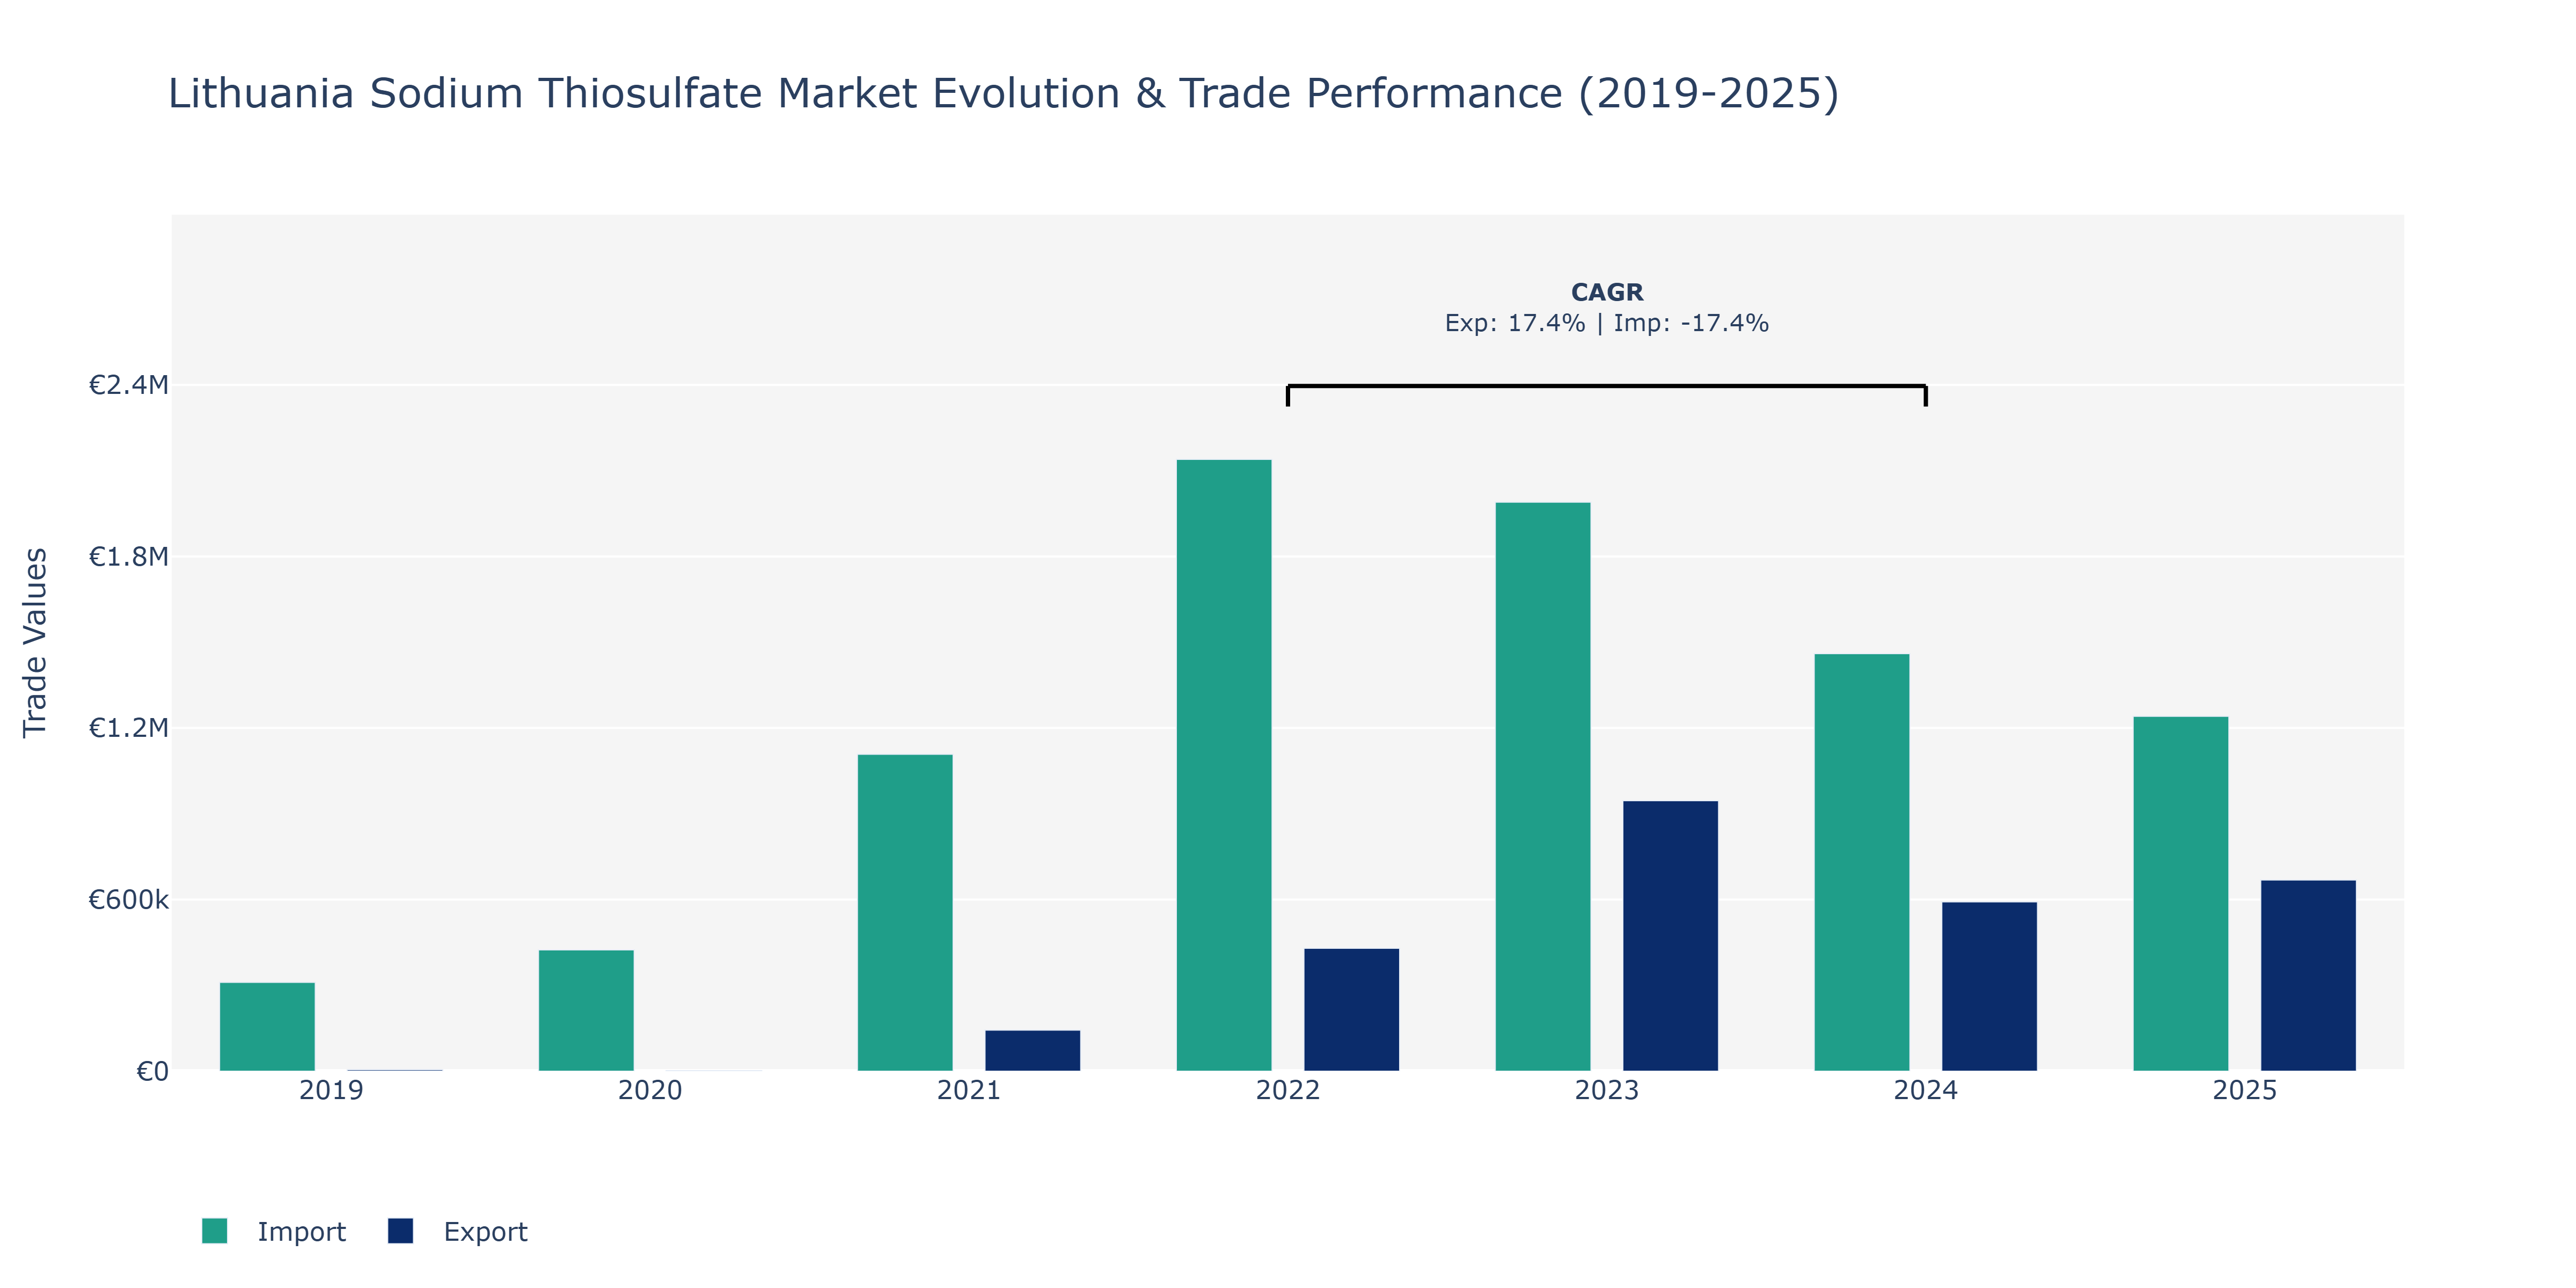
In the Lithuania Sodium Thiosulfate Market, exports exhibited a fluctuating pattern over the years provided, ranging from €5.18 thousand in 2019 to a peak of €945.98 thousand in 2023, before decreasing to €592.21 thousand in 2024. This decline could be attributed to various factors such as shifts in global demand, changes in pricing strategies, or alterations in market dynamics. On the other hand, imports notably increased from €310.64 thousand in 2019 to €1.24 million in 2025. The substantial growth in imports could be linked to increased domestic consumption, technological advancements requiring higher imports of raw materials, or strategic sourcing decisions by local manufacturers. The market's dynamics seem to have led to an inverse relationship between exports and imports, with a significant surge in imports post-2023 possibly impacting the local competitive landscape and supply chain strategies within the industry.
Key Highlights of the Report:
- Lithuania Sodium Thiosulfate Market Outlook
- Market Size of Lithuania Sodium Thiosulfate Market, 2025
- Forecast of Lithuania Sodium Thiosulfate Market, 2032
- Historical Data and Forecast of Lithuania Sodium Thiosulfate Revenues & Volume for the Period 2022 - 2032F
- Lithuania Sodium Thiosulfate Market Trend Evolution
- Lithuania Sodium Thiosulfate Market Drivers and Challenges
- Lithuania Sodium Thiosulfate Price Trends
- Lithuania Sodium Thiosulfate Porter's Five Forces
- Lithuania Sodium Thiosulfate Industry Life Cycle
- Historical Data and Forecast of Lithuania Sodium Thiosulfate Market Revenues & Volume By Form for the Period 2022 - 2032F
- Historical Data and Forecast of Lithuania Sodium Thiosulfate Market Revenues & Volume By Powder for the Period 2022 - 2032F
- Historical Data and Forecast of Lithuania Sodium Thiosulfate Market Revenues & Volume By Granular for the Period 2022 - 2032F
- Historical Data and Forecast of Lithuania Sodium Thiosulfate Market Revenues & Volume By Liquid for the Period 2022 - 2032F
- Historical Data and Forecast of Lithuania Sodium Thiosulfate Market Revenues & Volume By Crystalline for the Period 2022 - 2032F
- Historical Data and Forecast of Lithuania Sodium Thiosulfate Market Revenues & Volume By Application for the Period 2022 - 2032F
- Historical Data and Forecast of Lithuania Sodium Thiosulfate Market Revenues & Volume By Medical Detoxification for the Period 2022 - 2032F
- Historical Data and Forecast of Lithuania Sodium Thiosulfate Market Revenues & Volume By Water Dechlorination for the Period 2022 - 2032F
- Historical Data and Forecast of Lithuania Sodium Thiosulfate Market Revenues & Volume By Photography for the Period 2022 - 2032F
- Historical Data and Forecast of Lithuania Sodium Thiosulfate Market Revenues & Volume By Gold Extraction for the Period 2022 - 2032F
- Historical Data and Forecast of Lithuania Sodium Thiosulfate Market Revenues & Volume By Manufacturing Process for the Period 2022 - 2032F
- Historical Data and Forecast of Lithuania Sodium Thiosulfate Market Revenues & Volume By Sulfur Reduction for the Period 2022 - 2032F
- Historical Data and Forecast of Lithuania Sodium Thiosulfate Market Revenues & Volume By Electrolytic Process for the Period 2022 - 2032F
- Historical Data and Forecast of Lithuania Sodium Thiosulfate Market Revenues & Volume By Chemical Synthesis for the Period 2022 - 2032F
- Historical Data and Forecast of Lithuania Sodium Thiosulfate Market Revenues & Volume By Sulfite Process for the Period 2022 - 2032F
- Historical Data and Forecast of Lithuania Sodium Thiosulfate Market Revenues & Volume By End User for the Period 2022 - 2032F
- Historical Data and Forecast of Lithuania Sodium Thiosulfate Market Revenues & Volume By Pharmaceuticals for the Period 2022 - 2032F
- Historical Data and Forecast of Lithuania Sodium Thiosulfate Market Revenues & Volume By Water Treatment for the Period 2022 - 2032F
- Historical Data and Forecast of Lithuania Sodium Thiosulfate Market Revenues & Volume By Photography Industry for the Period 2022 - 2032F
- Historical Data and Forecast of Lithuania Sodium Thiosulfate Market Revenues & Volume By Mining Industry for the Period 2022 - 2032F
- Historical Data and Forecast of Lithuania Sodium Thiosulfate Market Revenues & Volume By Packaging Type for the Period 2022 - 2032F
- Historical Data and Forecast of Lithuania Sodium Thiosulfate Market Revenues & Volume By Bags for the Period 2022 - 2032F
- Historical Data and Forecast of Lithuania Sodium Thiosulfate Market Revenues & Volume By Drums for the Period 2022 - 2032F
- Historical Data and Forecast of Lithuania Sodium Thiosulfate Market Revenues & Volume By Containers for the Period 2022 - 2032F
- Historical Data and Forecast of Lithuania Sodium Thiosulfate Market Revenues & Volume By Bulk Storage for the Period 2022 - 2032F
- Lithuania Sodium Thiosulfate Import Export Trade Statistics
- Market Opportunity Assessment By Form
- Market Opportunity Assessment By Application
- Market Opportunity Assessment By Manufacturing Process
- Market Opportunity Assessment By End User
- Market Opportunity Assessment By Packaging Type
- Lithuania Sodium Thiosulfate Top Companies Market Share
- Lithuania Sodium Thiosulfate Competitive Benchmarking By Technical and Operational Parameters
- Lithuania Sodium Thiosulfate Company Profiles
- Lithuania Sodium Thiosulfate Key Strategic Recommendations
Frequently Asked Questions About the Market Study (FAQs):
6Wresearch actively monitors the Lithuania Sodium Thiosulfate Market and publishes its comprehensive annual report, highlighting emerging trends, growth drivers, revenue analysis, and forecast outlook. Our insights help businesses to make data-backed strategic decisions with ongoing market dynamics. Our analysts track relevent industries related to the Lithuania Sodium Thiosulfate Market, allowing our clients with actionable intelligence and reliable forecasts tailored to emerging regional needs.
Yes, we provide customisation as per your requirements. To learn more, feel free to contact us on sales@6wresearch.com
1 Executive Summary |
2 Introduction |
2.1 Key Highlights of the Report |
2.2 Report Description |
2.3 Market Scope & Segmentation |
2.4 Research Methodology |
2.5 Assumptions |
3 Lithuania Sodium Thiosulfate Market Overview |
3.1 Lithuania Country Macro Economic Indicators |
3.2 Lithuania Sodium Thiosulfate Market Revenues & Volume, 2022 & 2032F |
3.3 Lithuania Sodium Thiosulfate Market - Industry Life Cycle |
3.4 Lithuania Sodium Thiosulfate Market - Porter's Five Forces |
3.5 Lithuania Sodium Thiosulfate Market Revenues & Volume Share, By Form, 2022 & 2032F |
3.6 Lithuania Sodium Thiosulfate Market Revenues & Volume Share, By Application, 2022 & 2032F |
3.7 Lithuania Sodium Thiosulfate Market Revenues & Volume Share, By Manufacturing Process, 2022 & 2032F |
3.8 Lithuania Sodium Thiosulfate Market Revenues & Volume Share, By End User, 2022 & 2032F |
3.9 Lithuania Sodium Thiosulfate Market Revenues & Volume Share, By Packaging Type, 2022 & 2032F |
4 Lithuania Sodium Thiosulfate Market Dynamics |
4.1 Impact Analysis |
4.2 Market Drivers |
4.2.1 Growing demand for sodium thiosulfate in the photography industry |
4.2.2 Increasing application of sodium thiosulfate in medical treatments |
4.2.3 Rising use of sodium thiosulfate in water treatment processes |
4.3 Market Restraints |
4.3.1 Fluctuating prices of raw materials used in sodium thiosulfate production |
4.3.2 Environmental concerns related to the disposal of sodium thiosulfate waste |
4.3.3 Intense competition from alternative chemicals in certain applications |
5 Lithuania Sodium Thiosulfate Market Trends |
6 Lithuania Sodium Thiosulfate Market, By Types |
6.1 Lithuania Sodium Thiosulfate Market, By Form |
6.1.1 Overview and Analysis |
6.1.2 Lithuania Sodium Thiosulfate Market Revenues & Volume, By Form, 2022 - 2032F |
6.1.3 Lithuania Sodium Thiosulfate Market Revenues & Volume, By Powder, 2022 - 2032F |
6.1.4 Lithuania Sodium Thiosulfate Market Revenues & Volume, By Granular, 2022 - 2032F |
6.1.5 Lithuania Sodium Thiosulfate Market Revenues & Volume, By Liquid, 2022 - 2032F |
6.1.6 Lithuania Sodium Thiosulfate Market Revenues & Volume, By Crystalline, 2022 - 2032F |
6.2 Lithuania Sodium Thiosulfate Market, By Application |
6.2.1 Overview and Analysis |
6.2.2 Lithuania Sodium Thiosulfate Market Revenues & Volume, By Medical Detoxification, 2022 - 2032F |
6.2.3 Lithuania Sodium Thiosulfate Market Revenues & Volume, By Water Dechlorination, 2022 - 2032F |
6.2.4 Lithuania Sodium Thiosulfate Market Revenues & Volume, By Photography, 2022 - 2032F |
6.2.5 Lithuania Sodium Thiosulfate Market Revenues & Volume, By Gold Extraction, 2022 - 2032F |
6.3 Lithuania Sodium Thiosulfate Market, By Manufacturing Process |
6.3.1 Overview and Analysis |
6.3.2 Lithuania Sodium Thiosulfate Market Revenues & Volume, By Sulfur Reduction, 2022 - 2032F |
6.3.3 Lithuania Sodium Thiosulfate Market Revenues & Volume, By Electrolytic Process, 2022 - 2032F |
6.3.4 Lithuania Sodium Thiosulfate Market Revenues & Volume, By Chemical Synthesis, 2022 - 2032F |
6.3.5 Lithuania Sodium Thiosulfate Market Revenues & Volume, By Sulfite Process, 2022 - 2032F |
6.4 Lithuania Sodium Thiosulfate Market, By End User |
6.4.1 Overview and Analysis |
6.4.2 Lithuania Sodium Thiosulfate Market Revenues & Volume, By Pharmaceuticals, 2022 - 2032F |
6.4.3 Lithuania Sodium Thiosulfate Market Revenues & Volume, By Water Treatment, 2022 - 2032F |
6.4.4 Lithuania Sodium Thiosulfate Market Revenues & Volume, By Photography Industry, 2022 - 2032F |
6.4.5 Lithuania Sodium Thiosulfate Market Revenues & Volume, By Mining Industry, 2022 - 2032F |
6.5 Lithuania Sodium Thiosulfate Market, By Packaging Type |
6.5.1 Overview and Analysis |
6.5.2 Lithuania Sodium Thiosulfate Market Revenues & Volume, By Bags, 2022 - 2032F |
6.5.3 Lithuania Sodium Thiosulfate Market Revenues & Volume, By Drums, 2022 - 2032F |
6.5.4 Lithuania Sodium Thiosulfate Market Revenues & Volume, By Containers, 2022 - 2032F |
6.5.5 Lithuania Sodium Thiosulfate Market Revenues & Volume, By Bulk Storage, 2022 - 2032F |
7 Lithuania Sodium Thiosulfate Market Import-Export Trade Statistics |
7.1 Lithuania Sodium Thiosulfate Market Export to Major Countries |
7.2 Lithuania Sodium Thiosulfate Market Imports from Major Countries |
8 Lithuania Sodium Thiosulfate Market Key Performance Indicators |
8.1 Average selling price of sodium thiosulfate in the Lithuanian market |
8.2 Percentage of sodium thiosulfate used in photography and medical applications |
8.3 Number of new water treatment projects utilizing sodium thiosulfate technology |
9 Lithuania Sodium Thiosulfate Market - Opportunity Assessment |
9.1 Lithuania Sodium Thiosulfate Market Opportunity Assessment, By Form, 2022 & 2032F |
9.2 Lithuania Sodium Thiosulfate Market Opportunity Assessment, By Application, 2022 & 2032F |
9.3 Lithuania Sodium Thiosulfate Market Opportunity Assessment, By Manufacturing Process, 2022 & 2032F |
9.4 Lithuania Sodium Thiosulfate Market Opportunity Assessment, By End User, 2022 & 2032F |
9.5 Lithuania Sodium Thiosulfate Market Opportunity Assessment, By Packaging Type, 2022 & 2032F |
10 Lithuania Sodium Thiosulfate Market - Competitive Landscape |
10.1 Lithuania Sodium Thiosulfate Market Revenue Share, By Companies, 2025 |
10.2 Lithuania Sodium Thiosulfate Market Competitive Benchmarking, By Operating and Technical Parameters |
11 Company Profiles |
12 Recommendations |
13 Disclaimer |
Global Go To Market Strategy - 2030
Export potential enables firms to identify high-growth global markets with greater confidence by combining advanced trade intelligence with a structured quantitative methodology. The framework analyzes emerging demand trends and country-level import patterns while integrating macroeconomic and trade datasets such as GDP and population forecasts, bilateral import–export flows, tariff structures, elasticity differentials between developed and developing economies, geographic distance, and import demand projections. Using weighted trade values from 2020–2024 as the base period to project country-to-country export potential for 2030, these inputs are operationalized through calculated drivers such as gravity model parameters, tariff impact factors, and projected GDP per-capita growth. Through an analysis of hidden potentials, demand hotspots, and market conditions that are most favorable to success, this method enables firms to focus on target countries, maximize returns, and global expansion with data, backed by accuracy.
By factoring in the projected importer demand gap that is currently unmet and could be potential opportunity, it identifies the potential for the Exporter (Country) among 190 countries, against the general trade analysis, which identifies the biggest importer or exporter.
To discover high-growth global markets and optimize your business strategy:
Click Here
Pricing
- Single User License$ 1,995
- Department License$ 2,400
- Site License$ 3,120
- Global License$ 3,795

Leadership Perspectives from Industry Events
Search
Thought Leadership and Analyst Meet


Our Clients
6WResearch In News
- India Air Conditioner Market Set for Strong Rebound in 2026 After Weather-Led Correction and GST-Driven Recovery: 6Wresearch
- ADAS in India: How Automatic Emergency Braking, Blind Spot Detection & Driver Monitoring are Transforming Road Safety
- Doha a strategic location for EV manufacturing hub: IPA Qatar
- Demand for luxury TVs surging in the GCC, says Samsung
- Empowering Growth: The Thriving Journey of Bangladesh’s Cable Industry
- Demand for luxury TVs surging in the GCC, says Samsung
Latest Reports
- Poland Fire Protection Systems Market (2026-2032)
- Cape Verde Portable Hand-Thrown Extinguisher Market (2026-2032)
- Canada Portable Hand-Thrown Extinguisher Market (2026-2032)
- Cameroon Portable Hand-Thrown Extinguisher Market (2026-2032)
- Burundi Portable Hand-Thrown Extinguisher Market (2026-2032)
- Burkina Faso Portable Hand-Thrown Extinguisher Market (2026-2032)
- Bulgaria Portable Hand-Thrown Extinguisher Market (2026-2032)
- Brunei Portable Hand-Thrown Extinguisher Market (2026-2032)
- Botswana Portable Hand-Thrown Extinguisher Market (2026-2032)
- Bosnia and Herzegovina Portable Hand-Thrown Extinguisher Market (2026-2032)
Industry Events and Analyst Meet

HIMTEX 2026

India Refining Summit 2026

India EV Show 2026

EV tech India Expo 2026

Auto Tech Asia 2026
Whitepaper
- Middle East & Africa Commercial Security Market Click here to view more.
- Middle East & Africa Fire Safety Systems & Equipment Market Click here to view more.
- GCC Drone Market Click here to view more.
- Middle East Lighting Fixture Market Click here to view more.
- GCC Physical & Perimeter Security Market Click here to view more.