Malaysia Marking Devices Market (2026-2032) Outlook | Trends, Revenue, Growth, Size, Companies, Analysis, Value, Forecast, Industry & Share
Market Forecast By Type (Laser Marking Devices, Inkjet Marking Devices), By Material Type (Metals, Plastic, Foils and Paints, Organic Materials), By Applications (Automotive, Cutting tools, Medical Instruments, Jewelry, Pumps, Electrical material, Metrology, Others) And Competitive Landscape
| Product Code: ETC129374 | Publication Date: Jun 2023 | Updated Date: Jun 2026 | Product Type: Report | |
| Publisher: 6Wresearch | Author: Ravi Bhandari | No. of Pages: 70 | No. of Figures: 35 | No. of Tables: 5 |
Malaysia Marking Devices Market Size, Share & Growth Rate
The Malaysia Marking Devices Market was estimated at USD 596 Million in 2025 and is projected to reach USD 886 Million by 2032, growing at a CAGR of 5.8% from 2026 to 2032. This growth trajectory is primarily fueled by the rapid industrialization occurring in various sectors, including automotive and electronics. As businesses increasingly prioritize product security and traceability, the demand for advanced marking solutions is set to rise, further bolstered by government initiatives aimed at supporting the manufacturing sector.
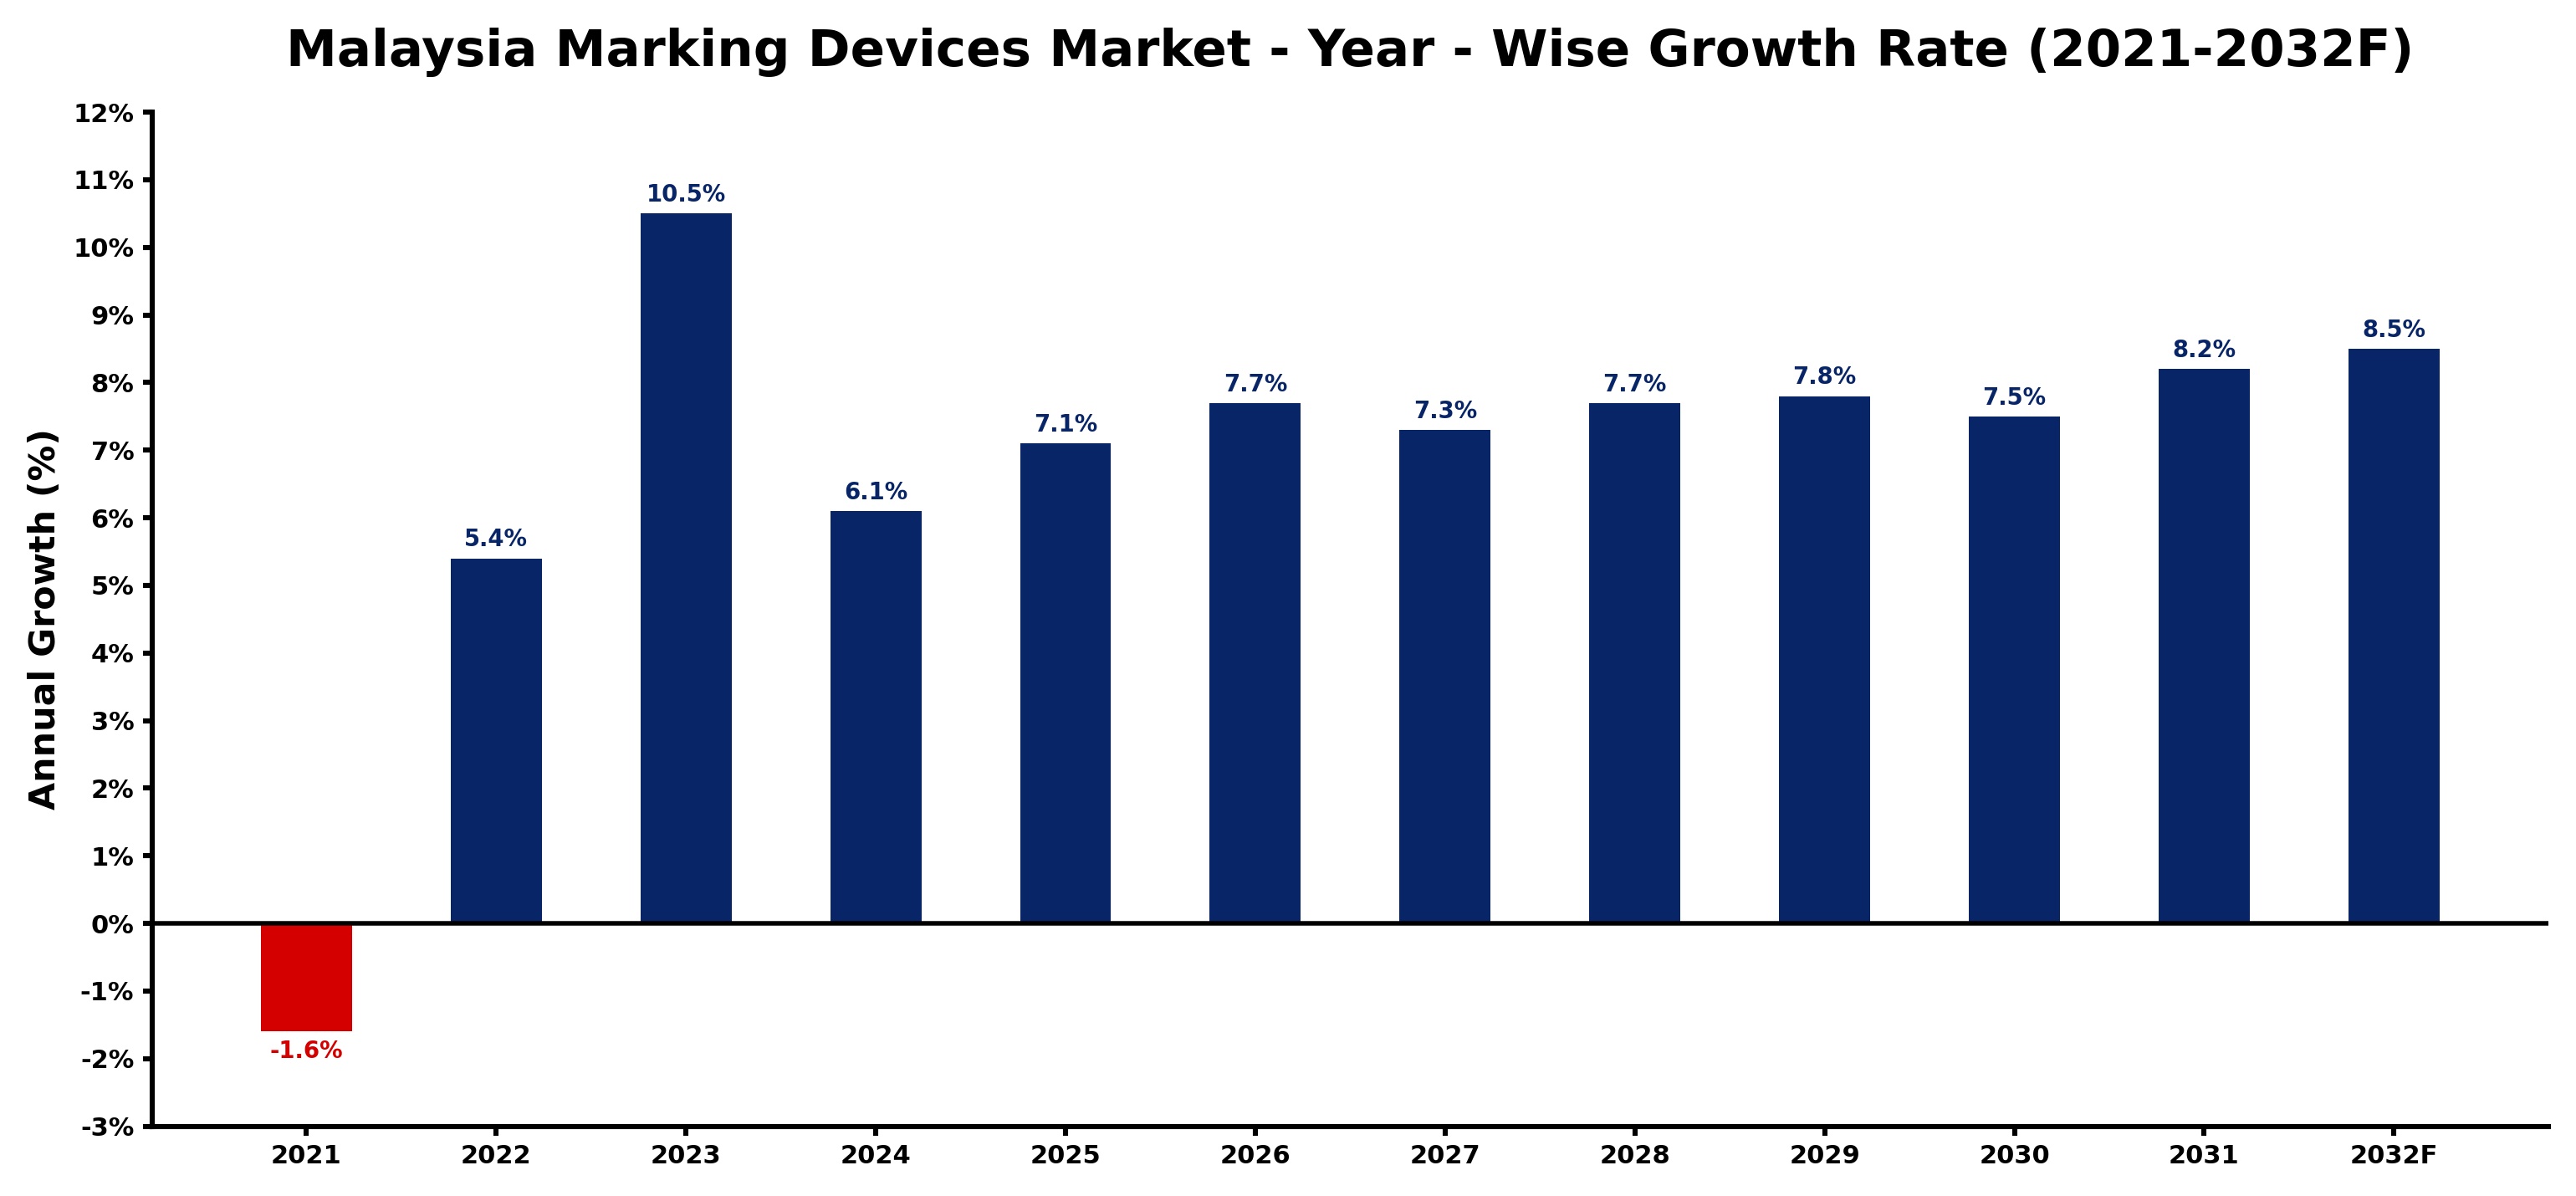
Malaysia Marking Devices Market Growth Rate Analysis (2021-2032)
The Malaysian marking devices market has shown a notable recovery following a -1.6% decline in 2021, driven primarily by a resurgence in industrial activities and heightened consumer demand in 2022, which propelled growth to 5.4%. The positive momentum accelerated further in 2023, achieving a remarkable 10.5% growth, aided by advancements in technology and the increasing adoption of digital solutions across various sectors. This trend is expected to maintain a robust pace, with growth projected at 6.1% in 2024 and gradually increasing to 8.5% by 2032. Investments in infrastructure and an ongoing energy transition are also fostering an environment conducive to sustained demand for innovative marking solutions in Malaysia.
Malaysia Marking Devices Market Year-wise Growth Rate and Key Drivers
This graph highlights how the Malaysia Marking Devices Market has steadily grown over the past five years, supported by major growth factors.
The table below presents the year‑wise growth rates along with the key drivers influencing the market
| Year | Growth Rate | Major Drivers |
| 2021 | -1.6% | Expansion of transportation and logistics networks |
| 2022 | 5.4% | Rising electricity demand across industries |
| 2023 | 10.5% | Increasing industrial automation investments |
| 2024 | 6.1% | Government infrastructure modernization initiatives |
| 2025 | 7.1% | Expansion of manufacturing activities |
| 2026 | 7.7% | Increasing adoption of advanced technologies |
| 2027 | 7.3% | Rapid growth in telecom and data center sectors |
| 2028 | 7.7% | Rapid growth in telecom and data center sectors |
| 2029 | 7.8% | Increasing smart city development projects |
| 2030 | 7.5% | Increasing industrial automation investments |
| 2031 | 8.2% | Expansion of transportation and logistics networks |
| 2032 | 8.5% | Increasing industrial infrastructure investments |
Note - Market size estimations and growth projections presented in this report are based on 6Wresearch’s advanced forecasting approach, validated with industry datasets as of June 2026.
Malaysia Marking Devices Market Synopsis
Recently, the Malaysia Marking Devices Market has experienced significant growth, driven by heightened industrial activity and an increasing emphasis on product labeling standards. However, looking forward, the market is poised for robust expansion as technology evolves and industries adopt more sophisticated marking solutions to enhance operational efficiency and compliance.
The convergence of regulatory pressures for traceability in products and the rising consumer demand for transparency are pushing businesses to invest in marking devices. This trajectory is supported by favorable government policies that encourage technological adoption and innovation in manufacturing, positioning the market for sustained growth in the coming years.
Malaysia Marking Devices Market Key Takeaways
- Industrialization across sectors is driving the demand for marking devices.
- Awareness of product traceability and security is significantly influencing purchasing decisions.
- Government support through funding initiatives is enhancing market potential.
- Technological advancements in marking solutions are reshaping the competitive landscape.
- The healthcare and automotive industries are key contributors to market expansion.
Evaluation of Restraints in Malaysia Marking Devices Market
Despite its growth prospects, the Malaysia Marking Devices Market faces several restraints. The high initial costs associated with advanced marking technologies can deter smaller enterprises from making necessary investments. Additionally, a lack of skilled personnel capable of operating sophisticated marking equipment may hinder adoption rates. The challenge of integrating new technologies into existing production lines also poses a significant barrier to growth.
Malaysia Marking Devices Market Trends
Current trends indicate a shift towards more automated and digitized marking processes. Innovations such as digital printing and laser marking are gaining traction, offering improved efficiency and quality. Furthermore, the rising popularity of sustainable and eco-friendly marking solutions reflects a growing commitment to environmental stewardship among manufacturers.
Malaysia Marking Devices Market Opportunities
Emerging sectors, such as food and beverage, present substantial opportunities for marking devices that meet strict regulatory standards for product labeling. Additionally, as e-commerce continues to expand, the need for effective labeling and traceability solutions will grow. Companies that can leverage these trends by providing innovative and cost-effective marking solutions stand to gain a competitive advantage in the market.
Government Initiatives in the Malaysia Marking Devices Market
The Malaysian government has launched several initiatives to bolster the manufacturing sector, including grants and funding for technology adoption. These programs aim to promote the use of advanced marking devices to enhance product compliance and traceability. By facilitating access to technical resources and financial support, the government is fostering an environment conducive to innovation and growth in the marking devices market.
Future Insights of the Malaysia Marking Devices Market
Looking ahead to 2026-2032, the Malaysia Marking Devices Market is expected to undergo significant transformation. As industries continue to embrace digital transformation, the demand for integrated marking solutions that enhance traceability and operational efficiency will surge. Companies that invest in R&D to develop cutting-edge technologies will likely capitalize on emerging opportunities, driving substantial growth within the market.
Malaysia Marking Devices Market Latest Developments (May 2025 - June 2026)
In recent months, the market has seen a notable increase in partnerships between technology providers and manufacturers, aimed at enhancing product offerings. There is a growing interest in automated marking solutions that integrate with existing production processes. Furthermore, industry players are focusing on sustainability, with several new eco-friendly marking materials being introduced to meet both consumer demand and regulatory standards.
Malaysia Marking Devices Market - Key Attractiveness of the Report
- 10 Years of Market Numbers
- Historical Data Starting from 2022 to 2025
- Base Year: 2025
- Forecast Data until 2032
- Key Performance Indicators Impacting the Market
- Major Upcoming Developments and Projects
Key Highlights of the Report:
- Malaysia Marking Devices Market Outlook
- Market Size of Malaysia Marking Devices Market, 2025
- Forecast of Malaysia Marking Devices Market, 2032F
- Historical Data and Forecast of Malaysia Marking Devices Revenues & Volume for the Period 2022-2032F
- Malaysia Marking Devices Market Trend Evolution
- Malaysia Marking Devices Market Drivers and Challenges
- Malaysia Marking Devices Price Trends
- Malaysia Marking Devices Porter's Five Forces
- Malaysia Marking Devices Industry Life Cycle
- Historical Data and Forecast of Malaysia Marking Devices Market Revenues & Volume By Type for the Period 2022-2032F
- Historical Data and Forecast of Malaysia Marking Devices Market Revenues & Volume By Laser Marking Devices for the Period 2022-2032F
- Historical Data and Forecast of Malaysia Marking Devices Market Revenues & Volume By Inkjet Marking Devices for the Period 2022-2032F
- Historical Data and Forecast of Malaysia Marking Devices Market Revenues & Volume By Material Type for the Period 2022-2032F
- Historical Data and Forecast of Malaysia Marking Devices Market Revenues & Volume By Metals for the Period 2022-2032F
- Historical Data and Forecast of Malaysia Marking Devices Market Revenues & Volume By Plastic for the Period 2022-2032F
- Historical Data and Forecast of Malaysia Marking Devices Market Revenues & Volume By Foils and Paints for the Period 2022-2032F
- Historical Data and Forecast of Malaysia Marking Devices Market Revenues & Volume By Organic Materials for the Period 2022-2032F
- Historical Data and Forecast of Malaysia Marking Devices Market Revenues & Volume By Applications for the Period 2022-2032F
- Historical Data and Forecast of Malaysia Marking Devices Market Revenues & Volume By Automotive for the Period 2022-2032F
- Historical Data and Forecast of Malaysia Marking Devices Market Revenues & Volume By Cutting tools for the Period 2022-2032F
- Historical Data and Forecast of Malaysia Marking Devices Market Revenues & Volume By Medical Instruments for the Period 2022-2032F
- Historical Data and Forecast of Malaysia Marking Devices Market Revenues & Volume By Jewelry for the Period 2022-2032F
- Historical Data and Forecast of Malaysia Marking Devices Market Revenues & Volume By Pumps for the Period 2022-2032F
- Historical Data and Forecast of Malaysia Marking Devices Market Revenues & Volume By Electrical material for the Period 2022-2032F
- Historical Data and Forecast of Malaysia Marking Devices Market Revenues & Volume By Metrology for the Period 2022-2032F
- Historical Data and Forecast of Malaysia Marking Devices Market Revenues & Volume By Others for the Period 2022-2032F
- Malaysia Marking Devices Import Export Trade Statistics
- Market Opportunity Assessment By Type
- Market Opportunity Assessment By Material Type
- Market Opportunity Assessment By Applications
- Malaysia Marking Devices Top Companies Market Share
- Malaysia Marking Devices Competitive Benchmarking By Technical and Operational Parameters
- Malaysia Marking Devices Company Profiles
- Malaysia Marking Devices Key Strategic Recommendations
Malaysia Marking Devices Market - Frequently Asked Questions
The Malaysia Marking Devices Market is projected to reach USD 886 Million by 2032, reflecting the growing need for product traceability across various industries.
Government initiatives aimed at improving manufacturing capabilities and technological adoption are fostering an environment that encourages investment in advanced marking solutions.
Key sectors driving demand include automotive, healthcare, and electronics, as they require strict compliance with labeling and traceability standards.
Increasing automation and digitalization in manufacturing processes are key trends shaping the future landscape of the marking devices market in Malaysia.
High costs and the need for skilled personnel to operate sophisticated marking technologies are significant barriers that manufacturers must overcome to fully utilize these devices.
The Malaysia Marking Devices Market mirrors global trends, particularly the shift towards automation and sustainability, ensuring that local manufacturers remain competitive on an international scale.
6Wresearch actively monitors the Malaysia Marking Devices Market and publishes its comprehensive annual report, highlighting emerging trends, growth drivers, revenue analysis, and forecast outlook. Our insights help businesses to make data-backed strategic decisions with ongoing market dynamics. Our analysts track relevent industries related to the Malaysia Marking Devices Market, allowing our clients with actionable intelligence and reliable forecasts tailored to emerging regional needs.
Yes, we provide customisation as per your requirements. To learn more, feel free to contact us on sales@6wresearch.com
Malaysia Marking Devices |
1 Executive Summary |
2 Introduction |
2.1 Key Highlights of the Report |
2.2 Report Description |
2.3 Market Scope & Segmentation |
2.4 Research Methodology |
2.5 Assumptions |
3 Malaysia Marking Devices Market Overview |
3.1 Malaysia Country Macro Economic Indicators |
3.2 Malaysia Marking Devices Market Revenues & Volume, 2022 & 2032F |
3.3 Malaysia Marking Devices Market - Industry Life Cycle |
3.4 Malaysia Marking Devices Market - Porter's Five Forces |
3.5 Malaysia Marking Devices Market Revenues & Volume Share, By Type, 2022 & 2032F |
3.6 Malaysia Marking Devices Market Revenues & Volume Share, By Material Type, 2022 & 2032F |
3.7 Malaysia Marking Devices Market Revenues & Volume Share, By Applications, 2022 & 2032F |
4 Malaysia Marking Devices Market Dynamics |
4.1 Impact Analysis |
4.2 Market Drivers |
4.3 Market Restraints |
5 Malaysia Marking Devices Market Trends |
6 Malaysia Marking Devices Market, By Types |
6.1 Malaysia Marking Devices Market, By Type |
6.1.1 Overview and Analysis |
6.1.2 Malaysia Marking Devices Market Revenues & Volume, By Type, 2022-2032F |
6.1.3 Malaysia Marking Devices Market Revenues & Volume, By Laser Marking Devices, 2022-2032F |
6.1.4 Malaysia Marking Devices Market Revenues & Volume, By Inkjet Marking Devices, 2022-2032F |
6.2 Malaysia Marking Devices Market, By Material Type |
6.2.1 Overview and Analysis |
6.2.2 Malaysia Marking Devices Market Revenues & Volume, By Metals, 2022-2032F |
6.2.3 Malaysia Marking Devices Market Revenues & Volume, By Plastic, 2022-2032F |
6.2.4 Malaysia Marking Devices Market Revenues & Volume, By Foils and Paints, 2022-2032F |
6.2.5 Malaysia Marking Devices Market Revenues & Volume, By Organic Materials, 2022-2032F |
6.3 Malaysia Marking Devices Market, By Applications |
6.3.1 Overview and Analysis |
6.3.2 Malaysia Marking Devices Market Revenues & Volume, By Automotive, 2022-2032F |
6.3.3 Malaysia Marking Devices Market Revenues & Volume, By Cutting tools, 2022-2032F |
6.3.4 Malaysia Marking Devices Market Revenues & Volume, By Medical Instruments, 2022-2032F |
6.3.5 Malaysia Marking Devices Market Revenues & Volume, By Jewelry, 2022-2032F |
6.3.6 Malaysia Marking Devices Market Revenues & Volume, By Pumps, 2022-2032F |
6.3.7 Malaysia Marking Devices Market Revenues & Volume, By Electrical material, 2022-2032F |
6.3.8 Malaysia Marking Devices Market Revenues & Volume, By Others, 2022-2032F |
6.3.9 Malaysia Marking Devices Market Revenues & Volume, By Others, 2022-2032F |
7 Malaysia Marking Devices Market Import-Export Trade Statistics |
7.1 Malaysia Marking Devices Market Export to Major Countries |
7.2 Malaysia Marking Devices Market Imports from Major Countries |
8 Malaysia Marking Devices Market Key Performance Indicators |
9 Malaysia Marking Devices Market - Opportunity Assessment |
9.1 Malaysia Marking Devices Market Opportunity Assessment, By Type, 2022 & 2032F |
9.2 Malaysia Marking Devices Market Opportunity Assessment, By Material Type, 2022 & 2032F |
9.3 Malaysia Marking Devices Market Opportunity Assessment, By Applications, 2022 & 2032F |
10 Malaysia Marking Devices Market - Competitive Landscape |
10.1 Malaysia Marking Devices Market Revenue Share, By Companies, 2025 |
10.2 Malaysia Marking Devices Market Competitive Benchmarking, By Operating and Technical Parameters |
11 Company Profiles |
12 Recommendations |
13 Disclaimer |
Global Go To Market Strategy - 2030
Export potential enables firms to identify high-growth global markets with greater confidence by combining advanced trade intelligence with a structured quantitative methodology. The framework analyzes emerging demand trends and country-level import patterns while integrating macroeconomic and trade datasets such as GDP and population forecasts, bilateral import–export flows, tariff structures, elasticity differentials between developed and developing economies, geographic distance, and import demand projections. Using weighted trade values from 2020–2024 as the base period to project country-to-country export potential for 2030, these inputs are operationalized through calculated drivers such as gravity model parameters, tariff impact factors, and projected GDP per-capita growth. Through an analysis of hidden potentials, demand hotspots, and market conditions that are most favorable to success, this method enables firms to focus on target countries, maximize returns, and global expansion with data, backed by accuracy.
By factoring in the projected importer demand gap that is currently unmet and could be potential opportunity, it identifies the potential for the Exporter (Country) among 190 countries, against the general trade analysis, which identifies the biggest importer or exporter.
To discover high-growth global markets and optimize your business strategy:
Click Here
Pricing
- Single User License$ 1,995
- Department License$ 2,400
- Site License$ 3,120
- Global License$ 3,795

Leadership Perspectives from Industry Events
Search
Thought Leadership and Analyst Meet


Our Clients
6WResearch In News
- India Air Conditioner Market Set for Strong Rebound in 2026 After Weather-Led Correction and GST-Driven Recovery: 6Wresearch
- ADAS in India: How Automatic Emergency Braking, Blind Spot Detection & Driver Monitoring are Transforming Road Safety
- Doha a strategic location for EV manufacturing hub: IPA Qatar
- Demand for luxury TVs surging in the GCC, says Samsung
- Empowering Growth: The Thriving Journey of Bangladesh’s Cable Industry
- Demand for luxury TVs surging in the GCC, says Samsung
Latest Reports
- Poland Fire Protection Systems Market (2026-2032)
- Cape Verde Portable Hand-Thrown Extinguisher Market (2026-2032)
- Canada Portable Hand-Thrown Extinguisher Market (2026-2032)
- Cameroon Portable Hand-Thrown Extinguisher Market (2026-2032)
- Burundi Portable Hand-Thrown Extinguisher Market (2026-2032)
- Burkina Faso Portable Hand-Thrown Extinguisher Market (2026-2032)
- Bulgaria Portable Hand-Thrown Extinguisher Market (2026-2032)
- Brunei Portable Hand-Thrown Extinguisher Market (2026-2032)
- Botswana Portable Hand-Thrown Extinguisher Market (2026-2032)
- Bosnia and Herzegovina Portable Hand-Thrown Extinguisher Market (2026-2032)
Industry Events and Analyst Meet

HIMTEX 2026

India Refining Summit 2026

India EV Show 2026

EV tech India Expo 2026

Auto Tech Asia 2026
Whitepaper
- Middle East & Africa Commercial Security Market Click here to view more.
- Middle East & Africa Fire Safety Systems & Equipment Market Click here to view more.
- GCC Drone Market Click here to view more.
- Middle East Lighting Fixture Market Click here to view more.
- GCC Physical & Perimeter Security Market Click here to view more.