Malaysia Power Supply Market (2026-2032) | Share, Size, Forecast, Revenue, Trends, Value, Companies, Analysis, Industry, Outlook & Growth
Market Forecast By Output Power (Power Supply With Low Output (500 W and Below), Power Supply With Medium Output (500–1,000 W), Power Supply With High Output (More Than 1,000 W)), By Type (AC-DC Power Supply, DC-DC Power Supply), By Vertical (Medical & Healthcare, Military & Aerospace, Telecommunications, Consumer Electronics, Transportation, Lighting, Food & Beverages, Industrial) And Competitive Landscape
| Product Code: ETC014206 | Publication Date: Jun 2023 | Updated Date: Jun 2026 | Product Type: Report | |
| Publisher: 6Wresearch | Author: Ravi Bhandari | No. of Pages: 70 | No. of Figures: 35 | No. of Tables: 5 |
Malaysia Power Supply Market Summary
The malaysia power supply market was estimated at USD 448 Million in 2025 and is projected to reach USD 590 Million by 2032, growing at a CAGR of 5.8% from 2026 to 2032.
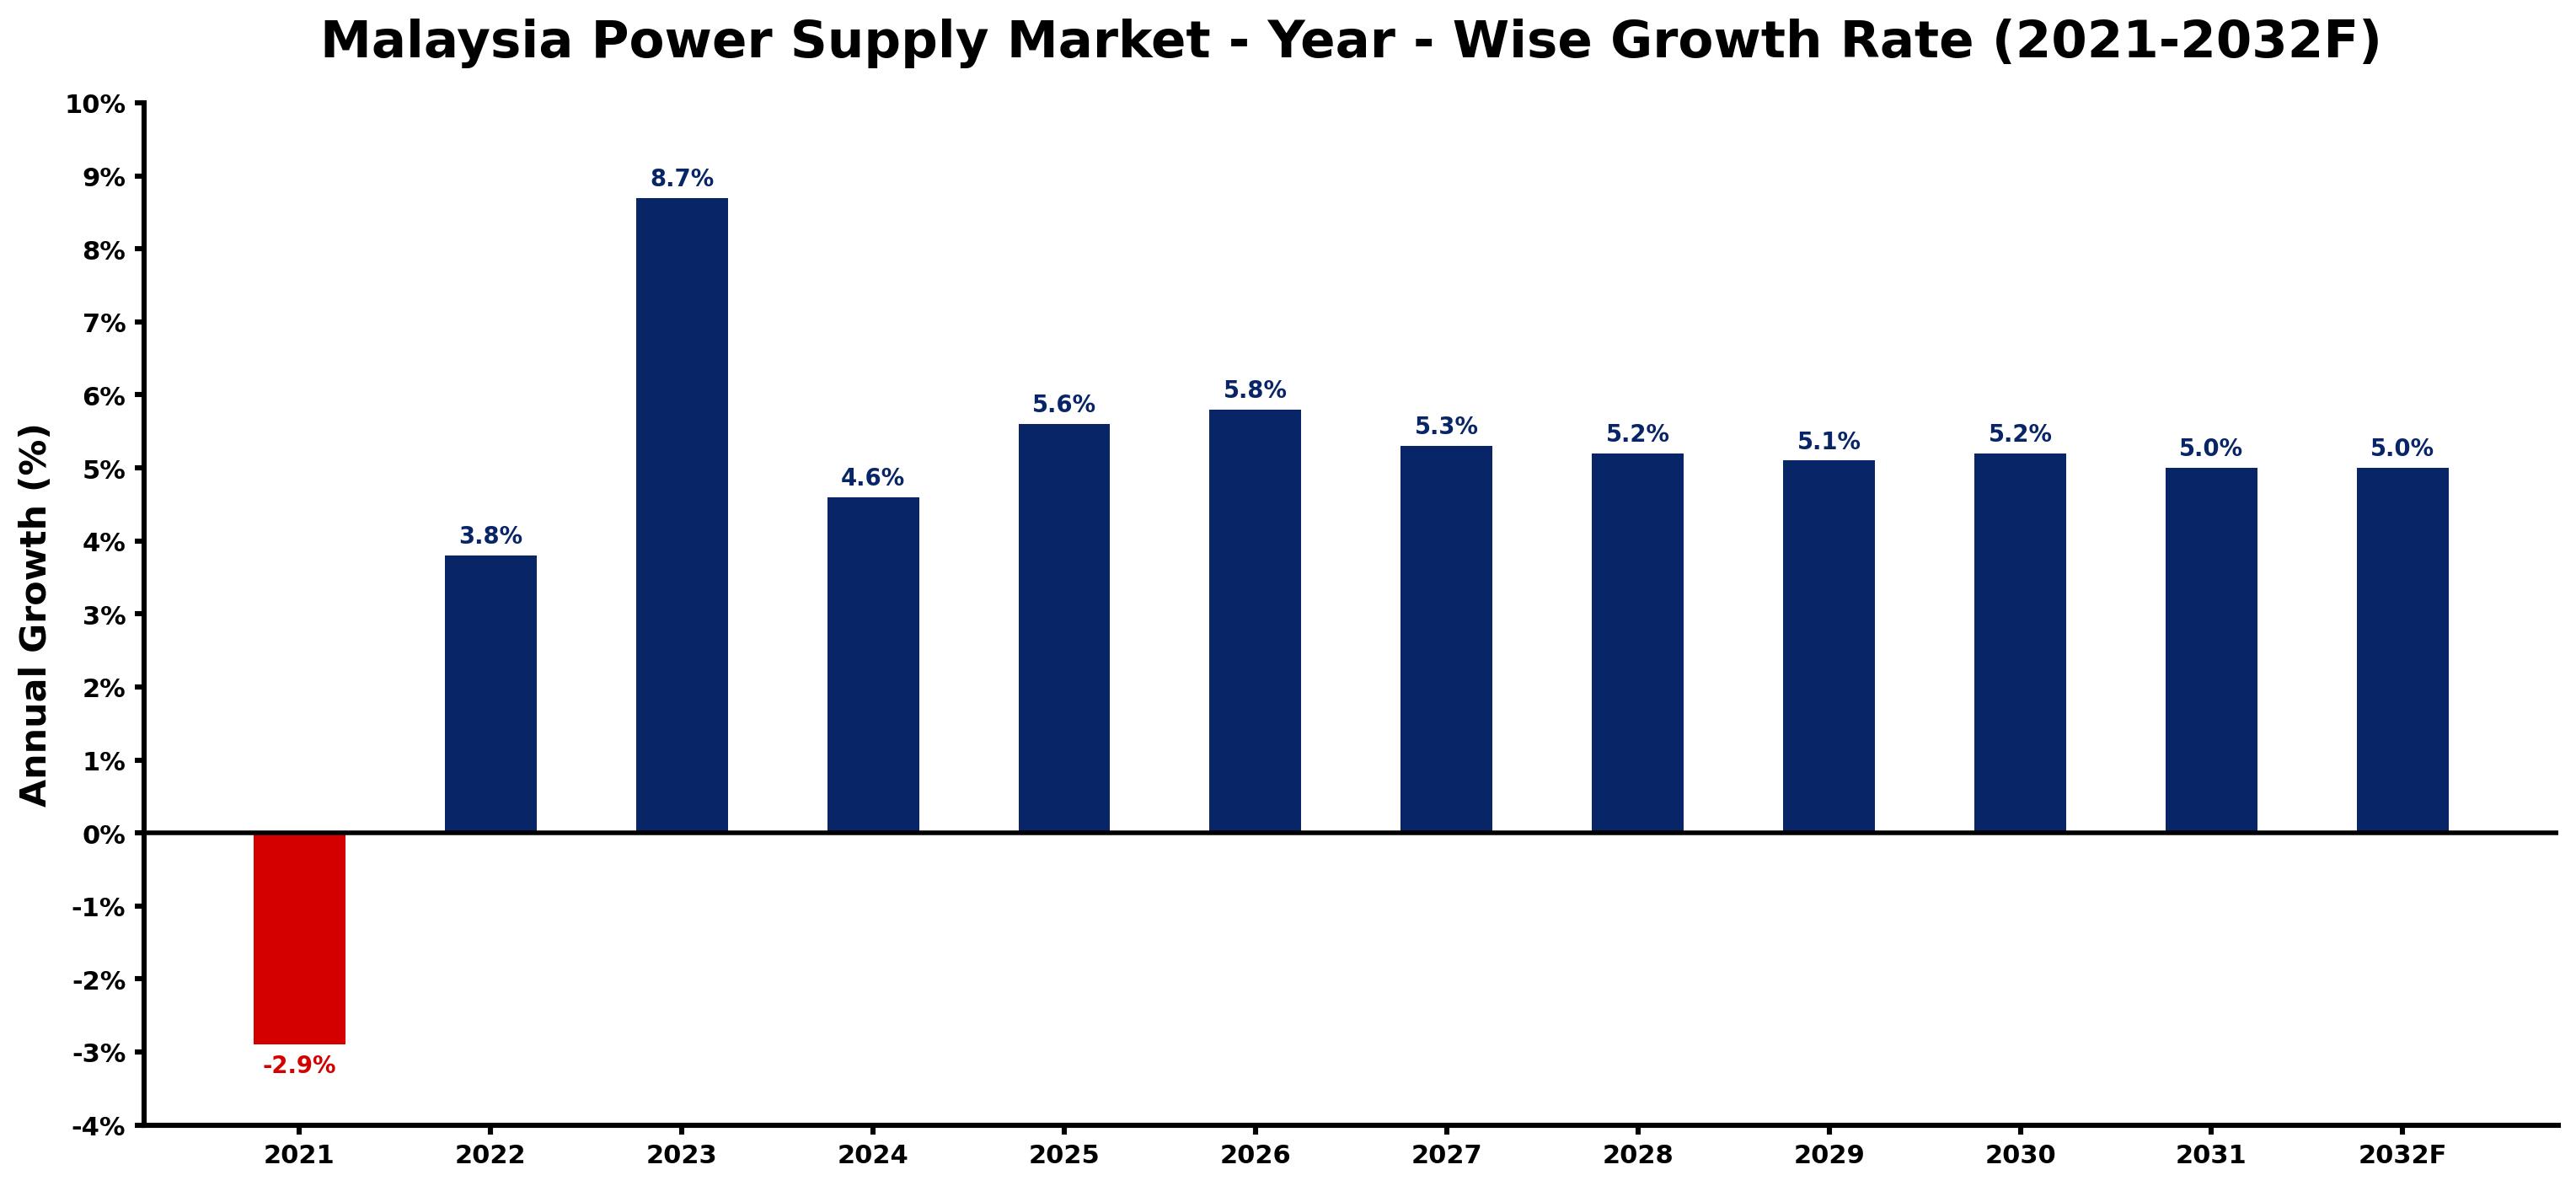
Malaysia Power Supply Market Growth Rate Analysis (2021-2032)
The Malaysia power supply market is witnessing a notable revival, rebounding from a contraction of 2.9% in 2021 to impressive growth of 3.8% in 2022, followed by a robust surge of 8.7% in 2023. This upward trajectory is fueled by increasing consumer demand, driven by heightened urbanization and continuous infrastructure development. As the government continues to invest in renewable energy sources and technological advancements, the market is expected to maintain its momentum, with growth rates projected at 4.6% in 2024 and stabilizing around 5% through 2032. The transition towards sustainable energy solutions and digitalization will further bolster the sector, solidifying its importance in Malaysia's economic landscape.
Malaysia Power Supply Market Year-wise Growth Rate and Key Drivers
This graph highlights how the Malaysia Power Supply Market has steadily grown over the past five years, supported by major growth factors.
The table below presents the year wise growth rates along with the key drivers influencing the market
| Year | Growth Rate | Major Drivers |
| 2021 | -2.9% | Increased reliance on renewable energy sources diminished demand for traditional power supply solutions. |
| 2022 | 3.8% | Local manufacturing's resurgence fueled electricity consumption in industrial zones significantly. |
| 2023 | 8.7% | Technological innovations in renewable energy attracted new players into the power market. |
| 2024 | 4.6% | Increased urbanization prompted infrastructure upgrades to ensure reliable power supply. |
| 2025 | 5.6% | Corporate sustainability goals pushed utilities to explore green energy sources more aggressively. |
| 2026 | 5.8% | Competitive tariffs among suppliers enhanced consumer choice and market dynamism significantly. |
| 2027 | 5.3% | Emerging smart grid technologies improved efficiency and responsiveness across urban areas. |
| 2028 | 5.2% | Renewable energy targets became more ambitious, driving investment into solar and wind projects. |
| 2029 | 5.1% | Partnerships with international firms introduced advanced energy storage solutions within Malaysia. |
| 2030 | 5.2% | Innovations in energy management systems optimized power distribution for commercial enterprises. |
| 2031 | 5.0% | Public awareness campaigns spurred residential interest in solar installations across demographics. |
| 2032 | 5.0% | Climate change discussions reshaped policies, reinforcing long-term commitment to sustainable energy. |
Note - Market size estimations and growth projections presented in this report are based on 6Wresearch's advanced forecasting approach, validated with industry datasets as of June 2026.
Malaysia Power Supply Market Synopsis
The Malaysia Power Supply Market is projected to reach 5.8% and witness significant growth during the forecast period (2026-2032). This anticipated expansion can be largely attributed to a combination of government initiatives aimed at enhancing energy infrastructure, increased investments in renewable energy projects, and the rising demand for stable electricity supply across various sectors. As industries continue to evolve and expand, the need for an uninterrupted power supply has become paramount, driving investment and development in this critical area.
Malaysia Power Supply Market Growth Drivers
Key drivers underpinning the growth of the Malaysia power supply market include:
- Government policies favoring the development of renewable resources have spurred investments, paving the way for cleaner energy solutions in the power sector.
- The increasing need for reliable electricity among industrial and commercial enterprises necessitates advancements in infrastructure to support energy demands.
- Expanding urbanization and population growth intensify the pressure on existing power supply systems, driving the necessity for enhancements and expansions.
- Public utility companies are adopting smart grid technologies to improve efficiency and reliability in energy distribution, reflecting a trend toward modernization in the power supply framework.
- The digitization of energy management systems is becoming prevalent, enabling better monitoring and control over energy consumption and reducing wastage.
Malaysia Power Supply Market Challenges and Restraints
Despite its growth prospects, the Malaysia power supply market faces several challenges that could hinder its potential:
- Post-COVID-19 economic recovery remains slow, which may impede investments in new projects dedicated to expanding the power supply infrastructure.
- The transition from fossil fuels to renewable energy necessitates substantial initial investments, which can be a barrier for many stakeholders.
- A lack of skilled labor in renewable energy technologies may slow down the adoption and implementation of new energy solutions.
- Growing competition in the market may lead to pricing pressures, affecting profit margins and investment capabilities of companies involved in power supply.
- Regulatory hurdles and bureaucratic inefficiencies can delay project approvals, further complicating the expansion of energy infrastructure.
Malaysia Power Supply Market Government Investment and Initiatives
The Malaysian government has laid out various initiatives and investment plans to bolster its power supply sector. These governmental efforts are crucial to ensuring sustainable energy growth and reliability:
- The government is actively pursuing policies that promote the integration of renewable energy sources into the national grid, reflecting its commitment to sustainability.
- Public spending has been directed toward upgrading and maintaining aging infrastructures, ensuring that the power supply can meet future demands effectively.
- Investment incentives have been established for private entities involved in renewable energy projects, thus encouraging public-private partnerships.
- Development plans outlined in the national energy blueprint seek to diversify Malaysia's energy mix, providing citizens with cleaner and more reliable power.
- The government is focusing on enhancing regulatory frameworks to streamline processes associated with project development in the power supply sector.
Malaysia Power Supply Market Latest Developments (May 2025 - June 2026)
In recent months, the Malaysia power supply market has observed noteworthy trends shaping its course. The focus has increasingly shifted towards renewable energy sources, reflecting a global trend that aligns with climate commitments. Policymakers have introduced additional incentives to attract foreign investments, particularly in solar and wind energy projects. Public utilities are testing smart grid technologies that enhance efficiency and reliability while mitigating outages. Moreover, the digitalization of power management systems is gaining traction, emphasizing the importance of data analytics in optimizing energy consumption patterns.
Malaysia Power Supply Market - Key Attractiveness of the Report
- 10 Years of Market Numbers
- Historical Data Starting from 2022 to 2025
- Base Year: 2025
- Forecast Data until 2032
- Key Performance Indicators Impacting the Market
- Major Upcoming Developments and Projects
Key Highlights of the Report:
- Malaysia Power Supply Market Outlook
- Market Size of Malaysia Power Supply Market, 2025
- Forecast of Malaysia Power Supply Market, 2032F
- Historical Data and Forecast of Malaysia Power Supply Revenues & Volume for the Period 2022-2032F
- Malaysia Power Supply Market Trend Evolution
- Malaysia Power Supply Market Drivers and Challenges
- Malaysia Power Supply Price Trends
- Malaysia Power Supply Porter's Five Forces
- Malaysia Power Supply Industry Life Cycle
- Historical Data and Forecast of Malaysia Power Supply Market Revenues & Volume By Output Power for the Period 2022-2032F
- Historical Data and Forecast of Malaysia Power Supply Market Revenues & Volume By Power Supply With Low Output (500 W and Below) for the Period 2022-2032F
- Historical Data and Forecast of Malaysia Power Supply Market Revenues & Volume By Power Supply With Medium Output (500?1,000 W) for the Period 2022-2032F
- Historical Data and Forecast of Malaysia Power Supply Market Revenues & Volume By Power Supply With High Output (More Than 1,000 W) for the Period 2022-2032F
- Historical Data and Forecast of Malaysia Power Supply Market Revenues & Volume By Type for the Period 2022-2032F
- Historical Data and Forecast of Malaysia Power Supply Market Revenues & Volume By AC-DC Power Supply for the Period 2022-2032F
- Historical Data and Forecast of Malaysia Power Supply Market Revenues & Volume By DC-DC Power Supply for the Period 2022-2032F
- Historical Data and Forecast of Malaysia Power Supply Market Revenues & Volume By Vertical for the Period 2022-2032F
- Historical Data and Forecast of Malaysia Power Supply Market Revenues & Volume By Medical & Healthcare for the Period 2022-2032F
- Historical Data and Forecast of Malaysia Power Supply Market Revenues & Volume By Military & Aerospace for the Period 2022-2032F
- Historical Data and Forecast of Malaysia Power Supply Market Revenues & Volume By Telecommunications for the Period 2022-2032F
- Historical Data and Forecast of Malaysia Power Supply Market Revenues & Volume By Consumer Electronics for the Period 2022-2032F
- Historical Data and Forecast of Malaysia Power Supply Market Revenues & Volume By Transportation for the Period 2022-2032F
- Historical Data and Forecast of Malaysia Power Supply Market Revenues & Volume By Lighting for the Period 2022-2032F
- Historical Data and Forecast of Malaysia Power Supply Market Revenues & Volume By Food & Beverages for the Period 2022-2032F
- Historical Data and Forecast of Malaysia Power Supply Market Revenues & Volume By Industrial for the Period 2022-2032F
- Malaysia Power Supply Import Export Trade Statistics
- Market Opportunity Assessment By Output Power
- Market Opportunity Assessment By Type
- Market Opportunity Assessment By Vertical
- Malaysia Power Supply Top Companies Market Share
- Malaysia Power Supply Competitive Benchmarking By Technical and Operational Parameters
- Malaysia Power Supply Company Profiles
- Malaysia Power Supply Key Strategic Recommendations
Frequently Asked Questions About the Market Study (FAQs):
The growth is driven by government initiatives, increased investments in renewable energy, and rising demand for reliable electricity across various sectors.
Challenges include slow economic recovery post-COVID-19, the need for substantial initial investments in renewable energy, and regulatory hurdles that may delay project approvals.
Recent developments include increased focus on renewable energy integration, the introduction of investment incentives, and advancements in smart grid technologies being tested by public utilities.
6Wresearch actively monitors the Malaysia Power Supply Market and publishes its comprehensive annual report, highlighting emerging trends, growth drivers, revenue analysis, and forecast outlook. Our insights help businesses to make data-backed strategic decisions with ongoing market dynamics. Our analysts track relevent industries related to the Malaysia Power Supply Market, allowing our clients with actionable intelligence and reliable forecasts tailored to emerging regional needs.
Yes, we provide customisation as per your requirements. To learn more, feel free to contact us on sales@6wresearch.com
1 Executive Summary |
2 Introduction |
2.1 Key Highlights of the Report |
2.2 Report Description |
2.3 Market Scope & Segmentation |
2.4 Research Methodology |
2.5 Assumptions |
3 Malaysia Power Supply Market Overview |
3.1 Malaysia Country Macro Economic Indicators |
3.2 Malaysia Power Supply Market Revenues & Volume, 2022 & 2032F |
3.3 Malaysia Power Supply Market - Industry Life Cycle |
3.4 Malaysia Power Supply Market - Porter's Five Forces |
3.5 Malaysia Power Supply Market Revenues & Volume Share, By Output Power, 2022 & 2032F |
3.6 Malaysia Power Supply Market Revenues & Volume Share, By Type, 2022 & 2032F |
3.7 Malaysia Power Supply Market Revenues & Volume Share, By Vertical, 2022 & 2032F |
4 Malaysia Power Supply Market Dynamics |
4.1 Impact Analysis |
4.2 Market Drivers |
4.3 Market Restraints |
5 Malaysia Power Supply Market Trends |
6 Malaysia Power Supply Market, By Types |
6.1 Malaysia Power Supply Market, By Output Power |
6.1.1 Overview and Analysis |
6.1.2 Malaysia Power Supply Market Revenues & Volume, By Output Power, 2022-2032F |
6.1.3 Malaysia Power Supply Market Revenues & Volume, By Power Supply With Low Output (500 W and Below), 2022-2032F |
6.1.4 Malaysia Power Supply Market Revenues & Volume, By Power Supply With Medium Output (500?1,000 W), 2022-2032F |
6.1.5 Malaysia Power Supply Market Revenues & Volume, By Power Supply With High Output (More Than 1,000 W), 2022-2032F |
6.2 Malaysia Power Supply Market, By Type |
6.2.1 Overview and Analysis |
6.2.2 Malaysia Power Supply Market Revenues & Volume, By AC-DC Power Supply, 2022-2032F |
6.2.3 Malaysia Power Supply Market Revenues & Volume, By DC-DC Power Supply, 2022-2032F |
6.3 Malaysia Power Supply Market, By Vertical |
6.3.1 Overview and Analysis |
6.3.2 Malaysia Power Supply Market Revenues & Volume, By Medical & Healthcare, 2022-2032F |
6.3.3 Malaysia Power Supply Market Revenues & Volume, By Military & Aerospace, 2022-2032F |
6.3.4 Malaysia Power Supply Market Revenues & Volume, By Telecommunications, 2022-2032F |
6.3.5 Malaysia Power Supply Market Revenues & Volume, By Consumer Electronics, 2022-2032F |
6.3.6 Malaysia Power Supply Market Revenues & Volume, By Transportation, 2022-2032F |
6.3.7 Malaysia Power Supply Market Revenues & Volume, By Lighting, 2022-2032F |
6.3.8 Malaysia Power Supply Market Revenues & Volume, By Industrial, 2022-2032F |
6.3.9 Malaysia Power Supply Market Revenues & Volume, By Industrial, 2022-2032F |
7 Malaysia Power Supply Market Import-Export Trade Statistics |
7.1 Malaysia Power Supply Market Export to Major Countries |
7.2 Malaysia Power Supply Market Imports from Major Countries |
8 Malaysia Power Supply Market Key Performance Indicators |
9 Malaysia Power Supply Market - Opportunity Assessment |
9.1 Malaysia Power Supply Market Opportunity Assessment, By Output Power, 2022 & 2032F |
9.2 Malaysia Power Supply Market Opportunity Assessment, By Type, 2022 & 2032F |
9.3 Malaysia Power Supply Market Opportunity Assessment, By Vertical, 2022 & 2032F |
10 Malaysia Power Supply Market - Competitive Landscape |
10.1 Malaysia Power Supply Market Revenue Share, By Companies, 2025 |
10.2 Malaysia Power Supply Market Competitive Benchmarking, By Operating and Technical Parameters |
11 Company Profiles |
12 Recommendations |
13 Disclaimer |
Global Go To Market Strategy - 2030
Export potential enables firms to identify high-growth global markets with greater confidence by combining advanced trade intelligence with a structured quantitative methodology. The framework analyzes emerging demand trends and country-level import patterns while integrating macroeconomic and trade datasets such as GDP and population forecasts, bilateral import–export flows, tariff structures, elasticity differentials between developed and developing economies, geographic distance, and import demand projections. Using weighted trade values from 2020–2024 as the base period to project country-to-country export potential for 2030, these inputs are operationalized through calculated drivers such as gravity model parameters, tariff impact factors, and projected GDP per-capita growth. Through an analysis of hidden potentials, demand hotspots, and market conditions that are most favorable to success, this method enables firms to focus on target countries, maximize returns, and global expansion with data, backed by accuracy.
By factoring in the projected importer demand gap that is currently unmet and could be potential opportunity, it identifies the potential for the Exporter (Country) among 190 countries, against the general trade analysis, which identifies the biggest importer or exporter.
To discover high-growth global markets and optimize your business strategy:
Click Here
Pricing
- Single User License$ 1,995
- Department License$ 2,400
- Site License$ 3,120
- Global License$ 3,795

Leadership Perspectives from Industry Events
Search
Thought Leadership and Analyst Meet


Our Clients
6WResearch In News
- India Air Conditioner Market Set for Strong Rebound in 2026 After Weather-Led Correction and GST-Driven Recovery: 6Wresearch
- ADAS in India: How Automatic Emergency Braking, Blind Spot Detection & Driver Monitoring are Transforming Road Safety
- Doha a strategic location for EV manufacturing hub: IPA Qatar
- Demand for luxury TVs surging in the GCC, says Samsung
- Empowering Growth: The Thriving Journey of Bangladesh’s Cable Industry
- Demand for luxury TVs surging in the GCC, says Samsung
Latest Reports
- Poland Fire Protection Systems Market (2026-2032)
- Cape Verde Portable Hand-Thrown Extinguisher Market (2026-2032)
- Canada Portable Hand-Thrown Extinguisher Market (2026-2032)
- Cameroon Portable Hand-Thrown Extinguisher Market (2026-2032)
- Burundi Portable Hand-Thrown Extinguisher Market (2026-2032)
- Burkina Faso Portable Hand-Thrown Extinguisher Market (2026-2032)
- Bulgaria Portable Hand-Thrown Extinguisher Market (2026-2032)
- Brunei Portable Hand-Thrown Extinguisher Market (2026-2032)
- Botswana Portable Hand-Thrown Extinguisher Market (2026-2032)
- Bosnia and Herzegovina Portable Hand-Thrown Extinguisher Market (2026-2032)
Industry Events and Analyst Meet

HIMTEX 2026

India Refining Summit 2026

India EV Show 2026

EV tech India Expo 2026

Auto Tech Asia 2026
Whitepaper
- Middle East & Africa Commercial Security Market Click here to view more.
- Middle East & Africa Fire Safety Systems & Equipment Market Click here to view more.
- GCC Drone Market Click here to view more.
- Middle East Lighting Fixture Market Click here to view more.
- GCC Physical & Perimeter Security Market Click here to view more.