Malta Alginate Dressing Market (2026-2032) | Competitive Landscape, Forecast, Companies, Value, Trends, Industry, Growth, Size & Revenue, Outlook, Share, Analysis, Segmentation
Market Forecast By Type (Antimicrobial, Non-antimicrobial), By Application (Acute Wounds, Chronic Wounds), By End-use (Hospitals, Specialty Clinics, Home Healthcare, Others) And Competitive Landscape
| Product Code: ETC8185402 | Publication Date: Sep 2024 | Updated Date: Apr 2026 | Product Type: Market Research Report | |
| Publisher: 6Wresearch | Author: Sumit Sagar | No. of Pages: 75 | No. of Figures: 35 | No. of Tables: 20 |
Malta Alginate Dressing Market Size (2020-2030)
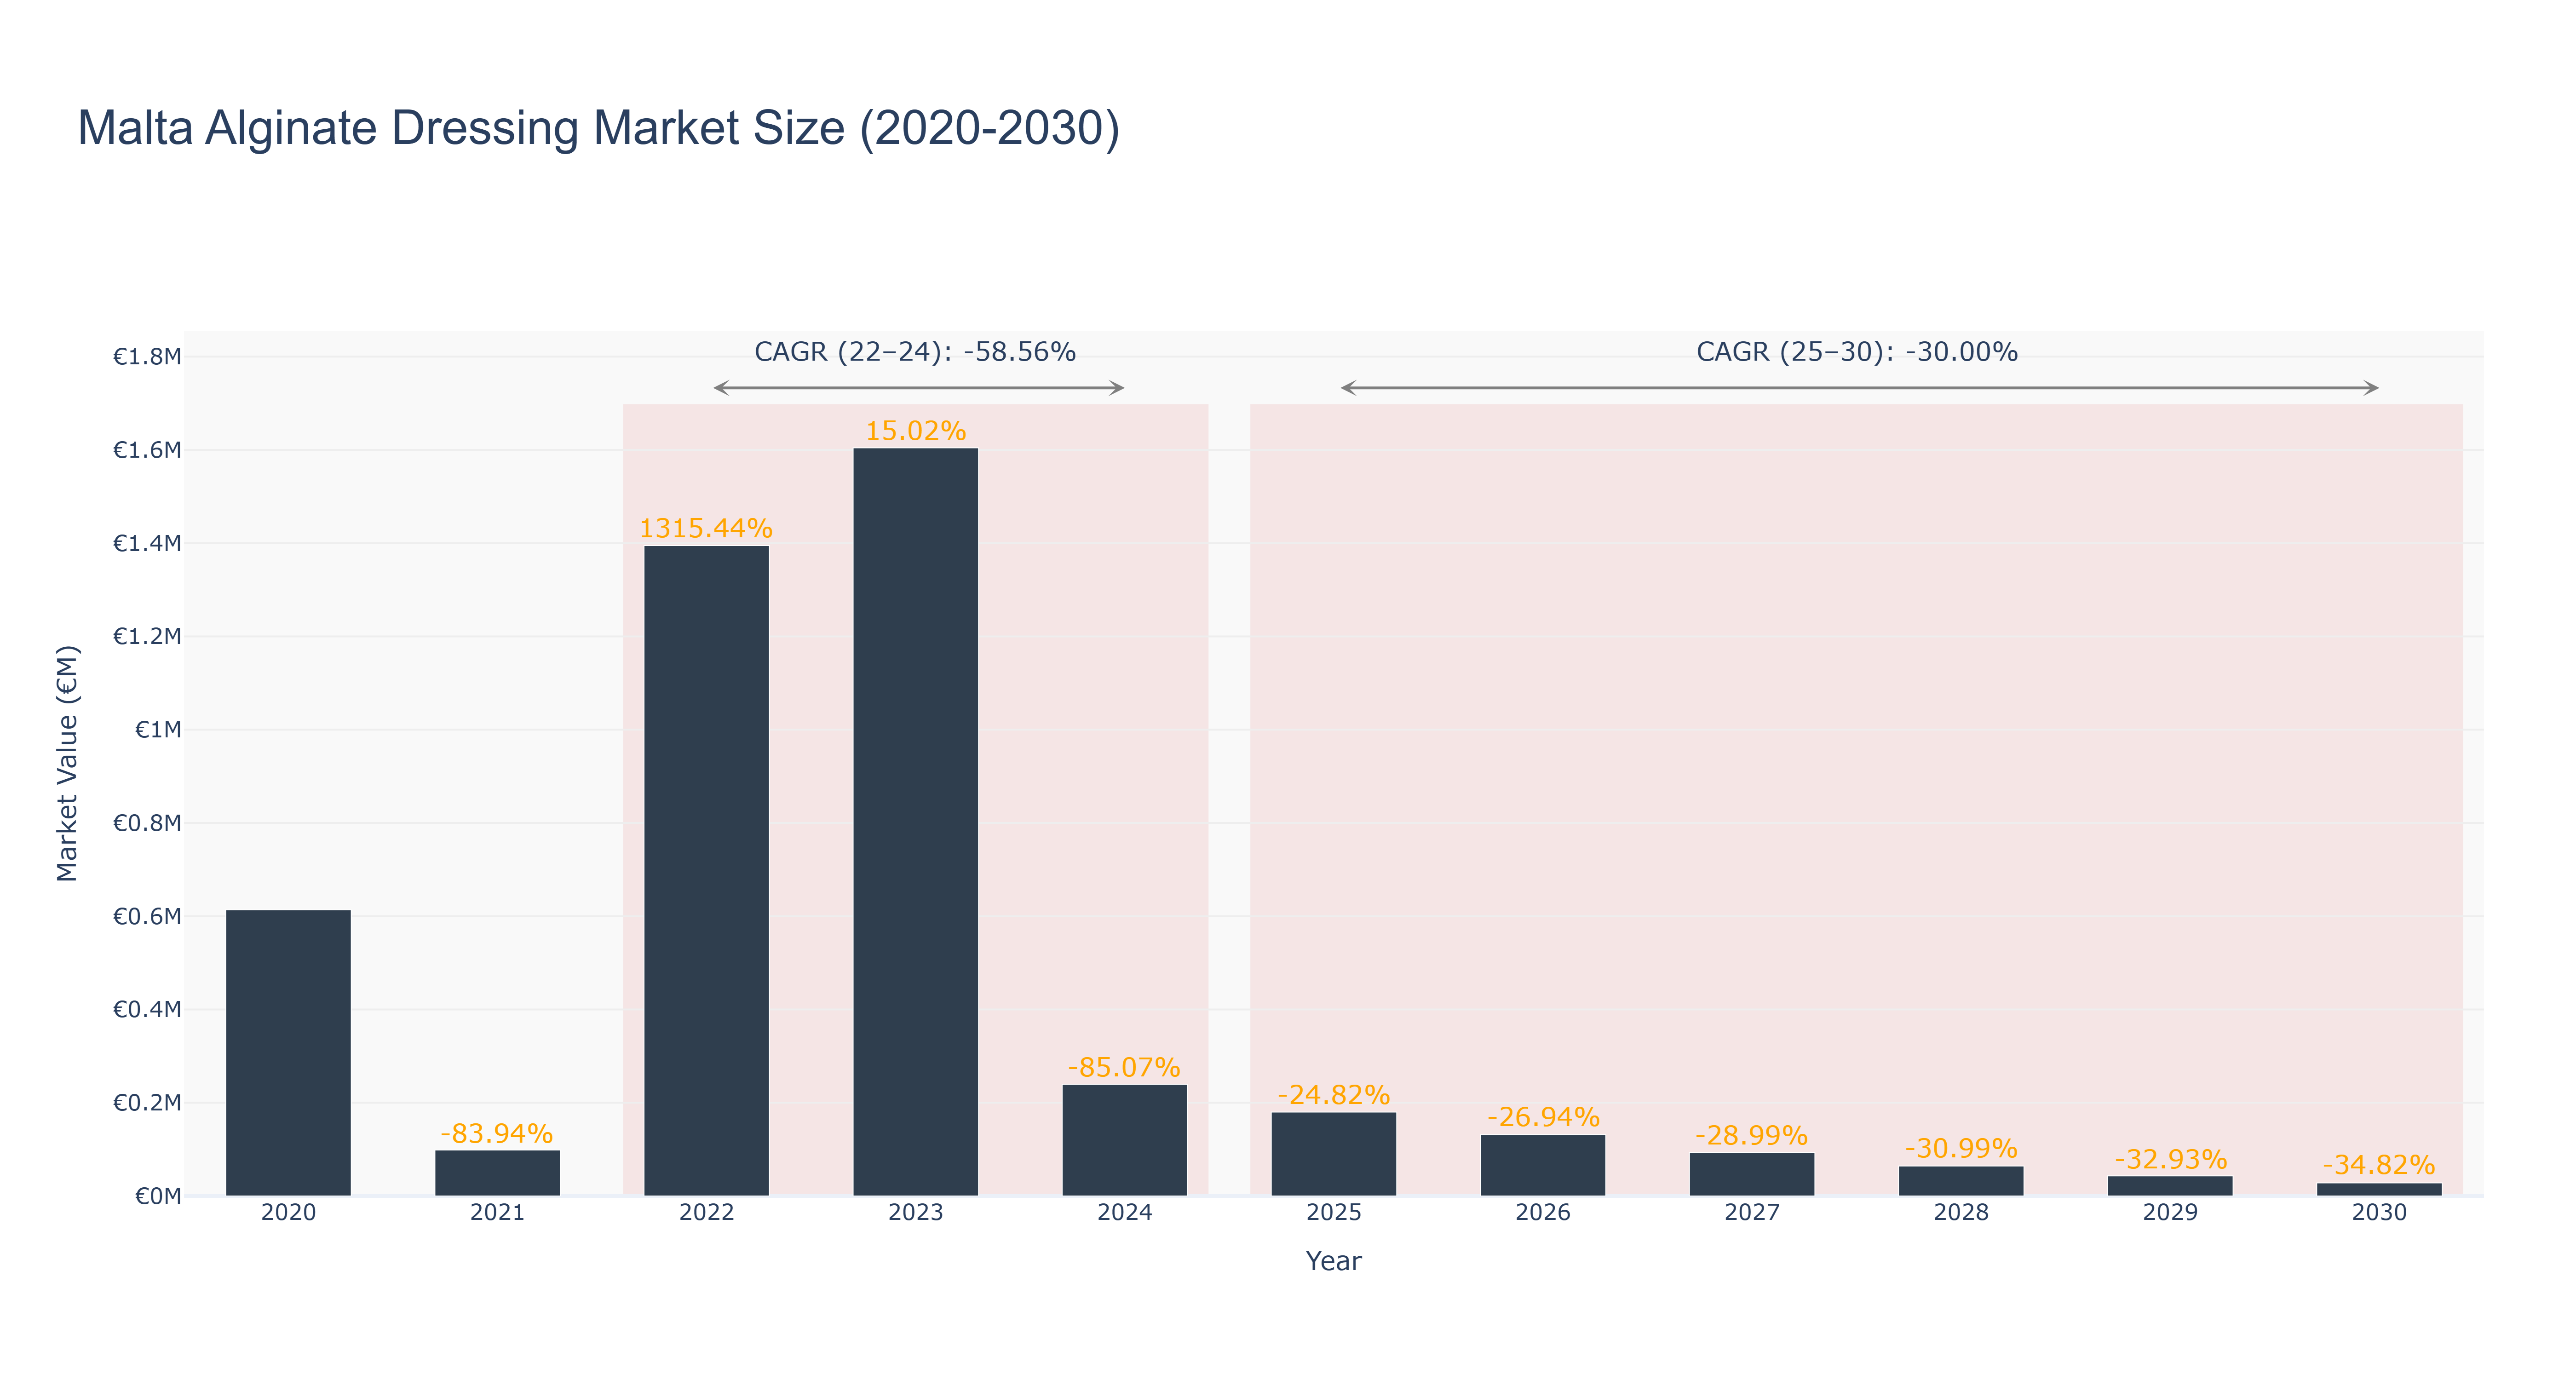
Malta Alginate Dressing Market has seen fluctuating market sizes over the years. The peak market size was €1.60 million in 2023, followed by a significant drop to €0.24 million in 2024. The forecasted market size is expected to continue decreasing from €0.18 million in 2025 to €0.03 million in 2030. The CAGR for the periods 2022-24 and 2025-30 are -58.56% and -30.0%, respectively. The market experienced a spike in 2022 due to a sudden surge in demand, possibly driven by new product launches or increased consumer awareness. The subsequent decline could be attributed to market saturation or changing consumer preferences. Looking ahead, the industry drivers for this market may include advancements in wound care technology and increasing healthcare expenditure. Future developments could involve collaborations with healthcare providers to enhance product distribution and accessibility to a wider consumer base.
Malta Alginate Dressing Market: Production & Trade Performance (2019-2025)
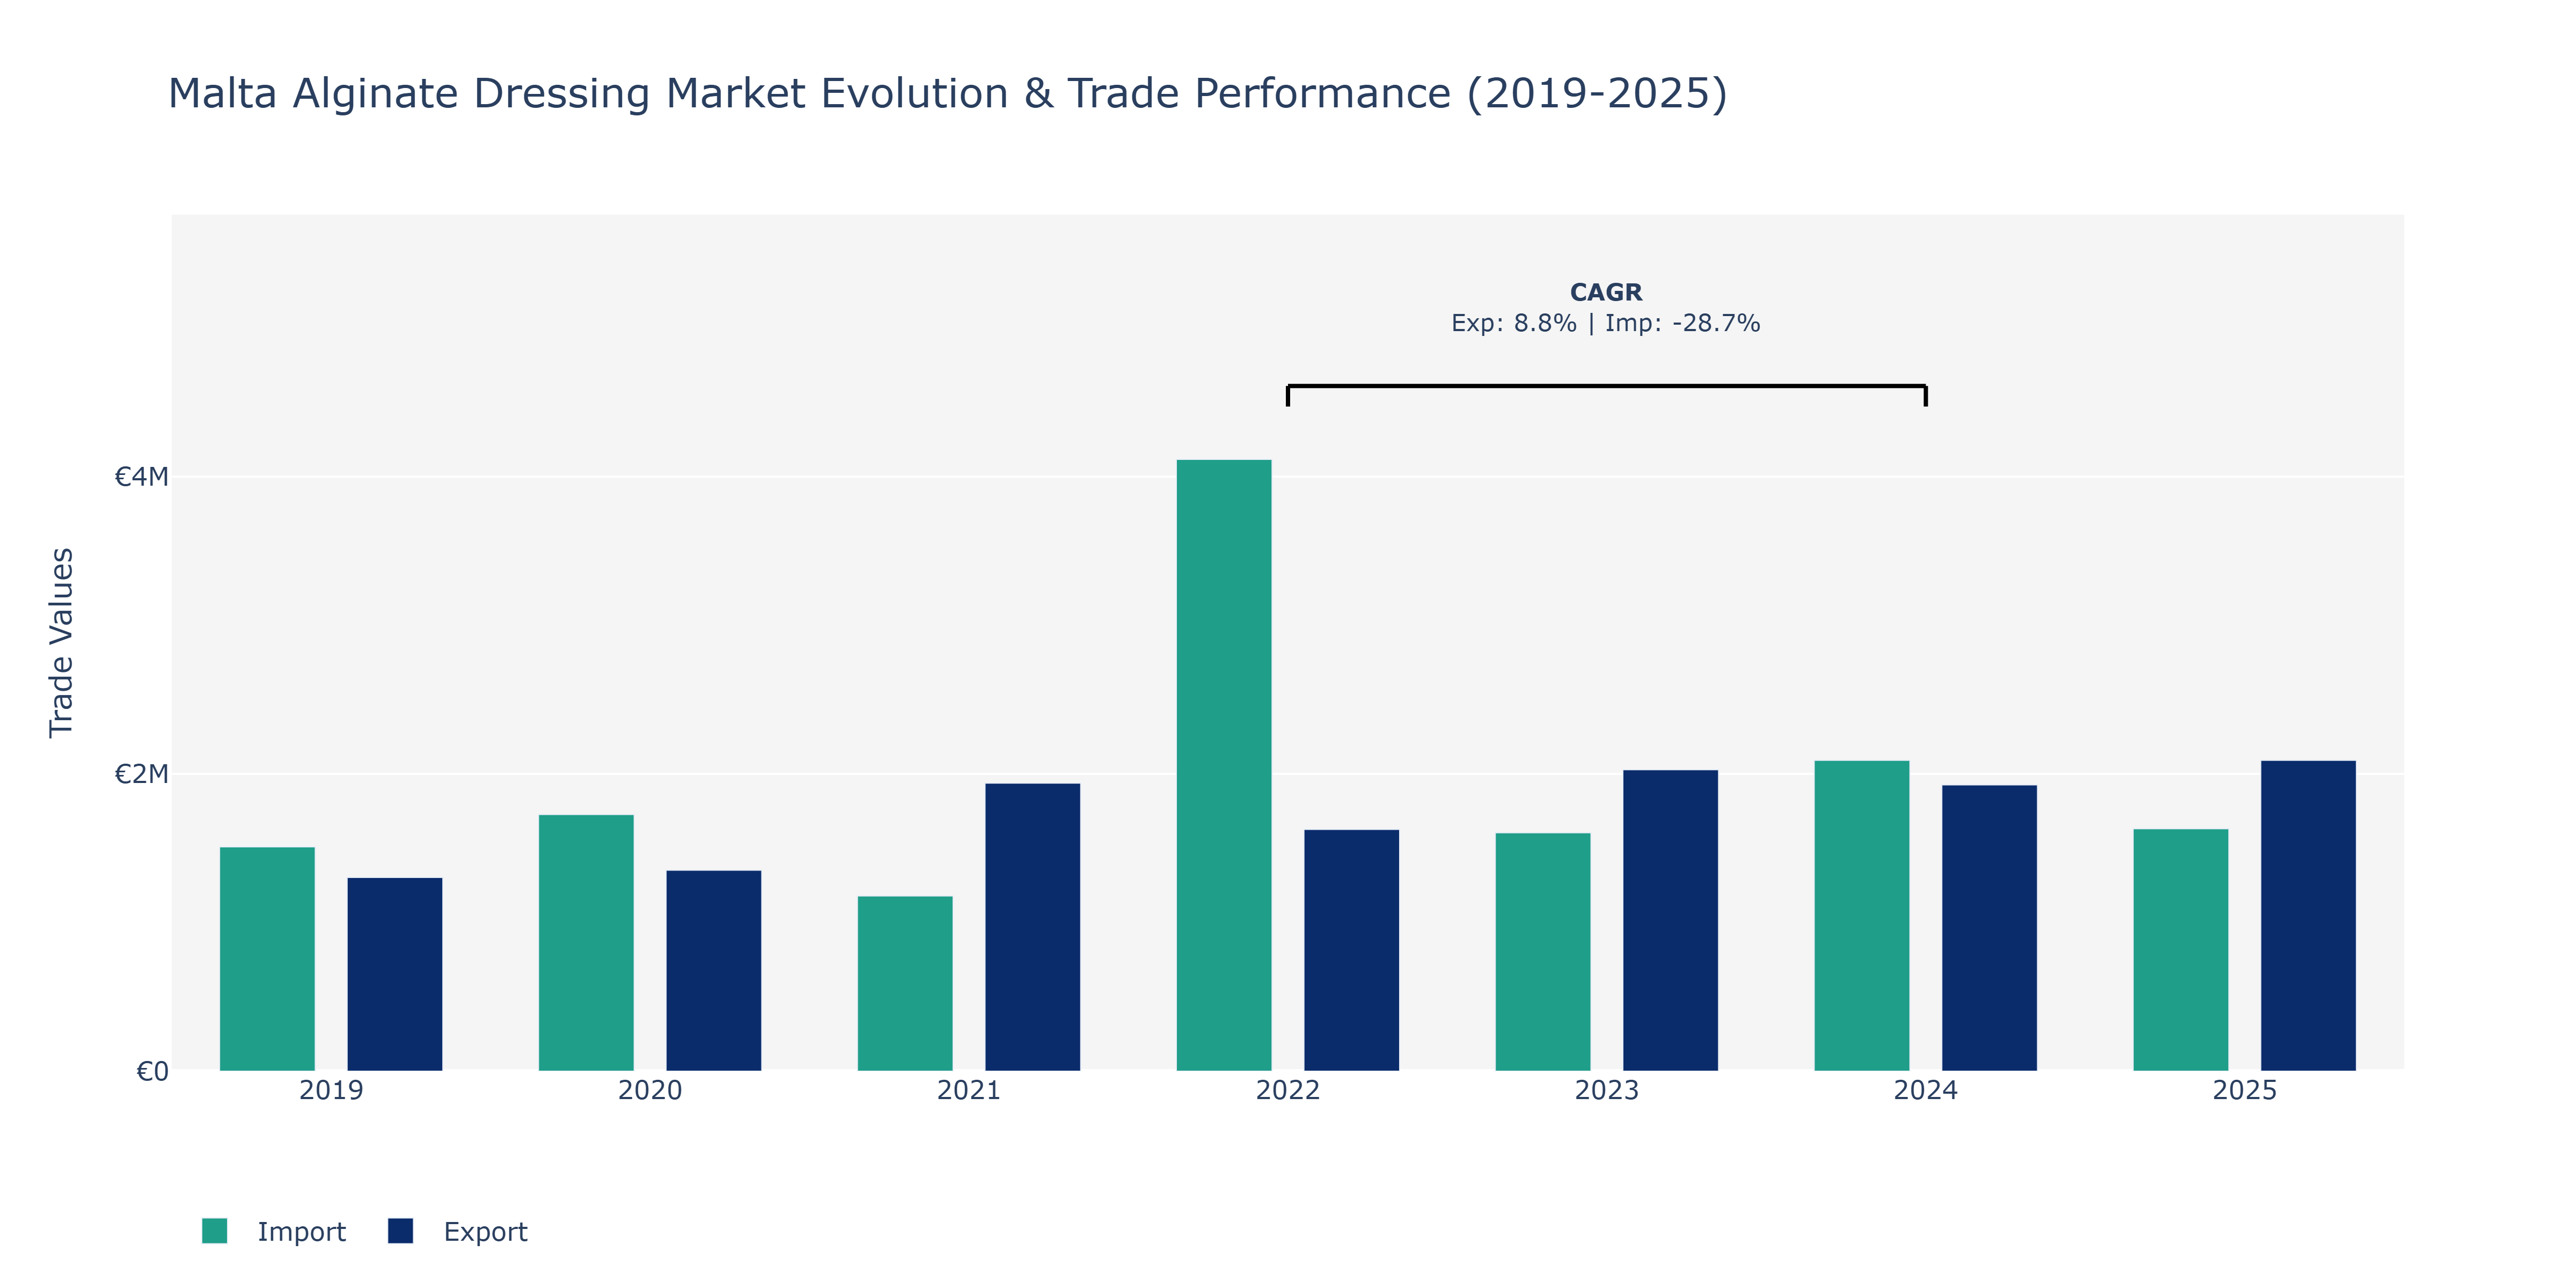
In the Malta Alginate Dressing Market, exports displayed a fluctuating trend over the observed years. Starting at €1.3 million in 2019, exports grew to €1.94 million in 2021, marking a notable increase. However, there was a slight downturn in 2022 to €1.63 million before recovering in 2023 and 2024. Import value, on the other hand, surged consistently from €1.51 million in 2019 to a peak of €4.12 million in 2022, before experiencing a decline in 2023 and 2024. The highest point for imports coincides with the steepest decrease, underscoring potential market saturation or shifts in domestic production capabilities impacting import demands. This trend suggests that local manufacturing capacities may have strengthened, leading to reduced reliance on imports during the specified period. Such fluctuations in import levels could be influenced by evolving regulatory frameworks, changes in consumer preferences, or advancements in production technologies within the Malta Alginate Dressing Market.
Key Highlights of the Report:
- Malta Alginate Dressing Market Outlook
- Market Size of Malta Alginate Dressing Market, 2025
- Forecast of Malta Alginate Dressing Market, 2032
- Historical Data and Forecast of Malta Alginate Dressing Revenues & Volume for the Period 2022 - 2032
- Malta Alginate Dressing Market Trend Evolution
- Malta Alginate Dressing Market Drivers and Challenges
- Malta Alginate Dressing Price Trends
- Malta Alginate Dressing Porter's Five Forces
- Malta Alginate Dressing Industry Life Cycle
- Historical Data and Forecast of Malta Alginate Dressing Market Revenues & Volume By Type for the Period 2022 - 2032
- Historical Data and Forecast of Malta Alginate Dressing Market Revenues & Volume By Antimicrobial for the Period 2022 - 2032
- Historical Data and Forecast of Malta Alginate Dressing Market Revenues & Volume By Non-antimicrobial for the Period 2022 - 2032
- Historical Data and Forecast of Malta Alginate Dressing Market Revenues & Volume By Application for the Period 2022 - 2032
- Historical Data and Forecast of Malta Alginate Dressing Market Revenues & Volume By Acute Wounds for the Period 2022 - 2032
- Historical Data and Forecast of Malta Alginate Dressing Market Revenues & Volume By Chronic Wounds for the Period 2022 - 2032
- Historical Data and Forecast of Malta Alginate Dressing Market Revenues & Volume By End-use for the Period 2022 - 2032
- Historical Data and Forecast of Malta Alginate Dressing Market Revenues & Volume By Hospitals for the Period 2022 - 2032
- Historical Data and Forecast of Malta Alginate Dressing Market Revenues & Volume By Specialty Clinics for the Period 2022 - 2032
- Historical Data and Forecast of Malta Alginate Dressing Market Revenues & Volume By Home Healthcare for the Period 2022 - 2032
- Historical Data and Forecast of Malta Alginate Dressing Market Revenues & Volume By Others for the Period 2022 - 2032
- Malta Alginate Dressing Import Export Trade Statistics
- Market Opportunity Assessment By Type
- Market Opportunity Assessment By Application
- Market Opportunity Assessment By End-use
- Malta Alginate Dressing Top Companies Market Share
- Malta Alginate Dressing Competitive Benchmarking By Technical and Operational Parameters
- Malta Alginate Dressing Company Profiles
- Malta Alginate Dressing Key Strategic Recommendations
Frequently Asked Questions About the Market Study (FAQs):
6Wresearch actively monitors the Malta Alginate Dressing Market and publishes its comprehensive annual report, highlighting emerging trends, growth drivers, revenue analysis, and forecast outlook. Our insights help businesses to make data-backed strategic decisions with ongoing market dynamics. Our analysts track relevent industries related to the Malta Alginate Dressing Market, allowing our clients with actionable intelligence and reliable forecasts tailored to emerging regional needs.
Yes, we provide customisation as per your requirements. To learn more, feel free to contact us on sales@6wresearch.com
1 Executive Summary |
2 Introduction |
2.1 Key Highlights of the Report |
2.2 Report Description |
2.3 Market Scope & Segmentation |
2.4 Research Methodology |
2.5 Assumptions |
3 Malta Alginate Dressing Market Overview |
3.1 Malta Country Macro Economic Indicators |
3.2 Malta Alginate Dressing Market Revenues & Volume, 2022 & 2032F |
3.3 Malta Alginate Dressing Market - Industry Life Cycle |
3.4 Malta Alginate Dressing Market - Porter's Five Forces |
3.5 Malta Alginate Dressing Market Revenues & Volume Share, By Type, 2022 & 2032F |
3.6 Malta Alginate Dressing Market Revenues & Volume Share, By Application, 2022 & 2032F |
3.7 Malta Alginate Dressing Market Revenues & Volume Share, By End-use, 2022 & 2032F |
4 Malta Alginate Dressing Market Dynamics |
4.1 Impact Analysis |
4.2 Market Drivers |
4.3 Market Restraints |
5 Malta Alginate Dressing Market Trends |
6 Malta Alginate Dressing Market, By Types |
6.1 Malta Alginate Dressing Market, By Type |
6.1.1 Overview and Analysis |
6.1.2 Malta Alginate Dressing Market Revenues & Volume, By Type, 2022 - 2032F |
6.1.3 Malta Alginate Dressing Market Revenues & Volume, By Antimicrobial, 2022 - 2032F |
6.1.4 Malta Alginate Dressing Market Revenues & Volume, By Non-antimicrobial, 2022 - 2032F |
6.2 Malta Alginate Dressing Market, By Application |
6.2.1 Overview and Analysis |
6.2.2 Malta Alginate Dressing Market Revenues & Volume, By Acute Wounds, 2022 - 2032F |
6.2.3 Malta Alginate Dressing Market Revenues & Volume, By Chronic Wounds, 2022 - 2032F |
6.3 Malta Alginate Dressing Market, By End-use |
6.3.1 Overview and Analysis |
6.3.2 Malta Alginate Dressing Market Revenues & Volume, By Hospitals, 2022 - 2032F |
6.3.3 Malta Alginate Dressing Market Revenues & Volume, By Specialty Clinics, 2022 - 2032F |
6.3.4 Malta Alginate Dressing Market Revenues & Volume, By Home Healthcare, 2022 - 2032F |
6.3.5 Malta Alginate Dressing Market Revenues & Volume, By Others, 2022 - 2032F |
7 Malta Alginate Dressing Market Import-Export Trade Statistics |
7.1 Malta Alginate Dressing Market Export to Major Countries |
7.2 Malta Alginate Dressing Market Imports from Major Countries |
8 Malta Alginate Dressing Market Key Performance Indicators |
9 Malta Alginate Dressing Market - Opportunity Assessment |
9.1 Malta Alginate Dressing Market Opportunity Assessment, By Type, 2022 & 2032F |
9.2 Malta Alginate Dressing Market Opportunity Assessment, By Application, 2022 & 2032F |
9.3 Malta Alginate Dressing Market Opportunity Assessment, By End-use, 2022 & 2032F |
10 Malta Alginate Dressing Market - Competitive Landscape |
10.1 Malta Alginate Dressing Market Revenue Share, By Companies, 2025 |
10.2 Malta Alginate Dressing Market Competitive Benchmarking, By Operating and Technical Parameters |
11 Company Profiles |
12 Recommendations |
13 Disclaimer |
Global Go To Market Strategy - 2030
Export potential enables firms to identify high-growth global markets with greater confidence by combining advanced trade intelligence with a structured quantitative methodology. The framework analyzes emerging demand trends and country-level import patterns while integrating macroeconomic and trade datasets such as GDP and population forecasts, bilateral import–export flows, tariff structures, elasticity differentials between developed and developing economies, geographic distance, and import demand projections. Using weighted trade values from 2020–2024 as the base period to project country-to-country export potential for 2030, these inputs are operationalized through calculated drivers such as gravity model parameters, tariff impact factors, and projected GDP per-capita growth. Through an analysis of hidden potentials, demand hotspots, and market conditions that are most favorable to success, this method enables firms to focus on target countries, maximize returns, and global expansion with data, backed by accuracy.
By factoring in the projected importer demand gap that is currently unmet and could be potential opportunity, it identifies the potential for the Exporter (Country) among 190 countries, against the general trade analysis, which identifies the biggest importer or exporter.
To discover high-growth global markets and optimize your business strategy:
Click Here
Pricing
- Single User License$ 1,995
- Department License$ 2,400
- Site License$ 3,120
- Global License$ 3,795

Leadership Perspectives from Industry Events
Search
Thought Leadership and Analyst Meet


Our Clients
6WResearch In News
- Doha a strategic location for EV manufacturing hub: IPA Qatar
- Demand for luxury TVs surging in the GCC, says Samsung
- Empowering Growth: The Thriving Journey of Bangladesh’s Cable Industry
- Demand for luxury TVs surging in the GCC, says Samsung
- Video call with a traditional healer? Once unthinkable, it’s now common in South Africa
- Intelligent Buildings To Smooth GCC’s Path To Net Zero
Latest Reports
- Cape Verde Portable Hand-Thrown Extinguisher Market (2026-2032)
- Canada Portable Hand-Thrown Extinguisher Market (2026-2032)
- Cameroon Portable Hand-Thrown Extinguisher Market (2026-2032)
- Burundi Portable Hand-Thrown Extinguisher Market (2026-2032)
- Burkina Faso Portable Hand-Thrown Extinguisher Market (2026-2032)
- Bulgaria Portable Hand-Thrown Extinguisher Market (2026-2032)
- Brunei Portable Hand-Thrown Extinguisher Market (2026-2032)
- Botswana Portable Hand-Thrown Extinguisher Market (2026-2032)
- Bosnia and Herzegovina Portable Hand-Thrown Extinguisher Market (2026-2032)
- Bolivia Portable Hand-Thrown Extinguisher Market (2026-2032)
Industry Events and Analyst Meet

HIMTEX 2026

India Refining Summit 2026

India EV Show 2026

EV tech India Expo 2026

Auto Tech Asia 2026
Whitepaper
- Middle East & Africa Commercial Security Market Click here to view more.
- Middle East & Africa Fire Safety Systems & Equipment Market Click here to view more.
- GCC Drone Market Click here to view more.
- Middle East Lighting Fixture Market Click here to view more.
- GCC Physical & Perimeter Security Market Click here to view more.