Malta Bio Ethanol Market (2026-2032) | Restraints, Demand, Competition, Challenges, Pricing Analysis, Size, Value, Segments, Forecast, Competitive, Companies, Trends, Segmentation, Investment Trends, Strategic Insights, Consumer Insights, Revenue, Share, Drivers, Industry, Strategy, Supply, Outlook, Growth, Analysis, Opportunities
Market Forecast By Feedstock Type (Sugarcane, Corn, Cellulosic Biomass), By Application (Fuel, Power Generation, Industrial Processes), By End User (Automotive, Energy Producers, Industrial), By Technology (Fermentation, Distillation, Enzymatic Hydrolysis), By Sustainability Factor (Renewable, Low Emissions, Sustainable) And Competitive Landscape
| Product Code: ETC11460096 | Publication Date: Apr 2025 | Updated Date: Apr 2026 | Product Type: Market Research Report | |
| Publisher: 6Wresearch | No. of Pages: 65 | No. of Figures: 34 | No. of Tables: 19 | |
Malta Bio Ethanol Market Size (2020-2030)
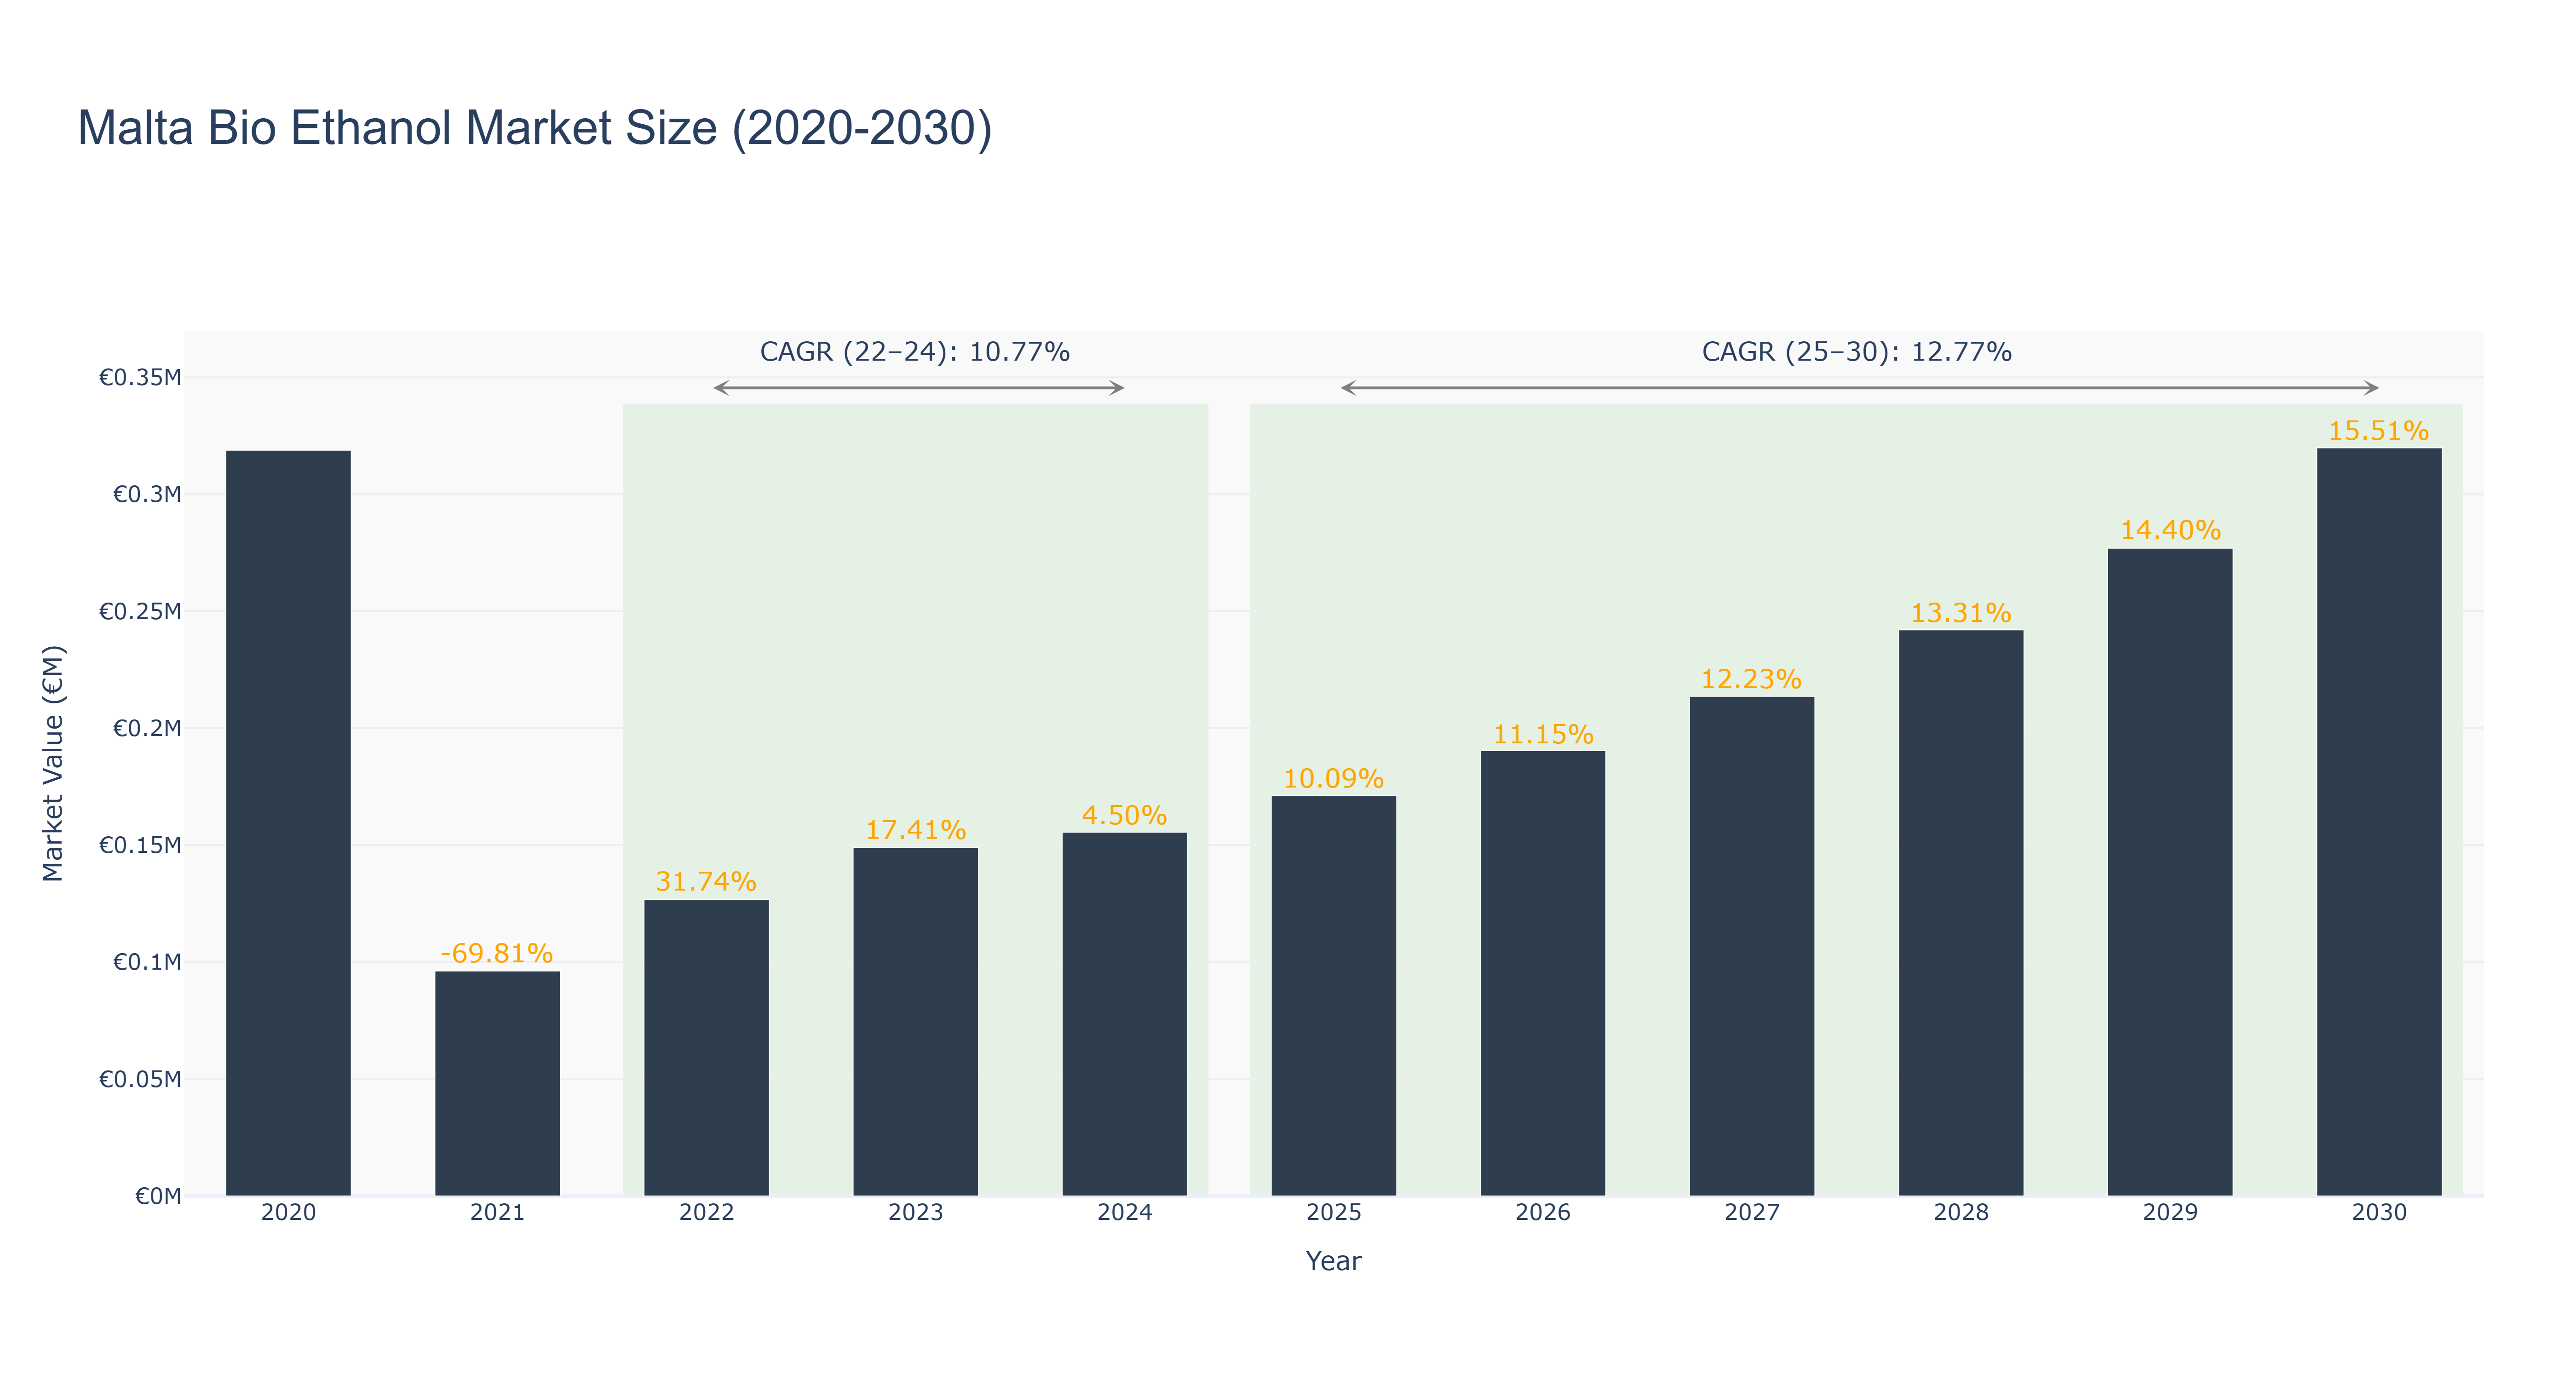
Malta Bio Ethanol Market has shown a fluctuating trend over the past decade. The market peaked at €0.32 million in 2030, with a steady growth rate averaging 15.51% annually. From 2020 to 2024, the market size decreased from €0.32 million to €0.16 million, attributed to a significant drop of 69.81% in 2021. However, from 2025 to 2030, the market is forecasted to grow steadily, with an expected size of €0.28 million in 2029. The CAGR for the periods 2022-24 and 2025-30 are 10.77% and 12.77%, respectively. Industry drivers such as increasing focus on renewable energy sources and government support for biofuels are contributing to the market's growth. In the near future, Malta is planning to invest in expanding bioethanol production facilities to meet the rising demand for sustainable energy sources.
Malta Bio Ethanol Market: Production & Trade Performance (2019-2025)
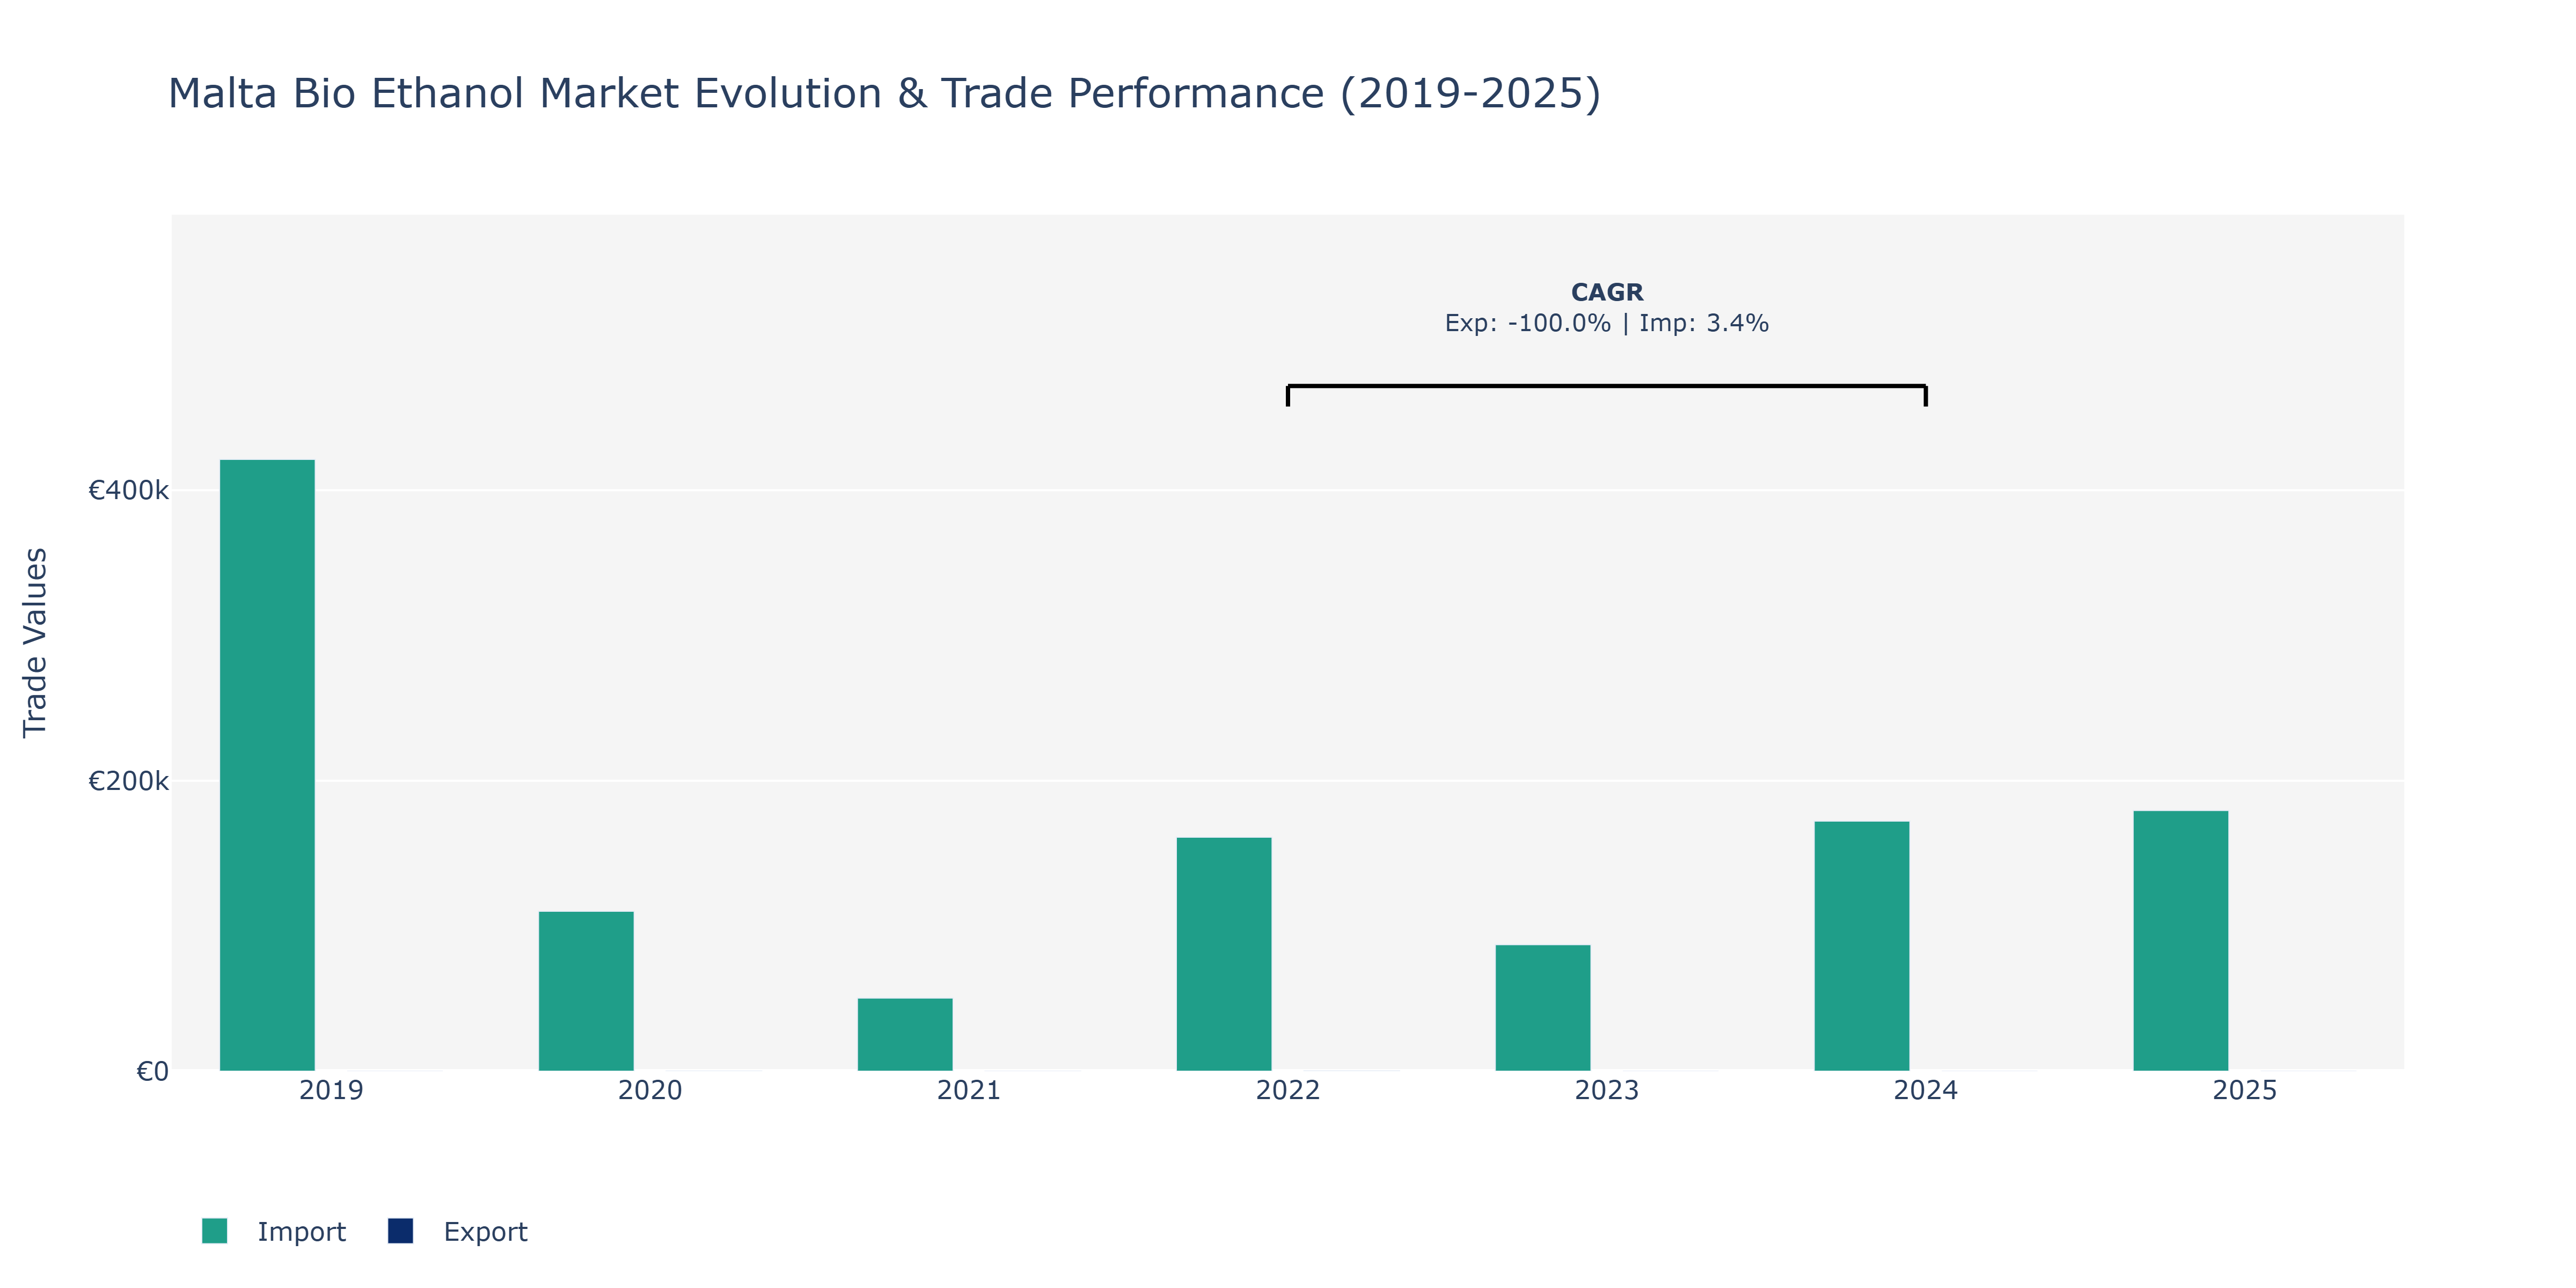
The Malta Bio Ethanol Market witnessed fluctuations in both Exports and Imports from 2019 to 2025. In 2019, Imports stood at €421.26 thousand, showing a substantial base for the market. The subsequent years saw varying trends: Exports sharply decreased from €102 thousand in 2020 to €15 thousand in 2021 before rebounding to €180 thousand in 2022. On the other hand, Imports experienced a steady increase from €110.17 thousand in 2020 to €179.5 thousand in 2025. The market faced challenges in 2023 with Imports declining to €87.1 thousand but recovered in 2024, reaching €172.16 thousand. The slight decrease in Imports in 2023 could be attributed to regulatory changes impacting raw material supply chains, while the subsequent recovery might be linked to increased industrial demand for bio ethanol. The consistent growth in Imports showcases a strengthening market demand, potentially fueled by a shift towards sustainable energy sources.
Key Highlights of the Report:
- Malta Bio Ethanol Market Outlook
- Market Size of Malta Bio Ethanol Market, 2025
- Forecast of Malta Bio Ethanol Market, 2032
- Historical Data and Forecast of Malta Bio Ethanol Revenues & Volume for the Period 2022 - 2032F
- Malta Bio Ethanol Market Trend Evolution
- Malta Bio Ethanol Market Drivers and Challenges
- Malta Bio Ethanol Price Trends
- Malta Bio Ethanol Porter's Five Forces
- Malta Bio Ethanol Industry Life Cycle
- Historical Data and Forecast of Malta Bio Ethanol Market Revenues & Volume By Feedstock Type for the Period 2022 - 2032F
- Historical Data and Forecast of Malta Bio Ethanol Market Revenues & Volume By Sugarcane for the Period 2022 - 2032F
- Historical Data and Forecast of Malta Bio Ethanol Market Revenues & Volume By Corn for the Period 2022 - 2032F
- Historical Data and Forecast of Malta Bio Ethanol Market Revenues & Volume By Cellulosic Biomass for the Period 2022 - 2032F
- Historical Data and Forecast of Malta Bio Ethanol Market Revenues & Volume By Application for the Period 2022 - 2032F
- Historical Data and Forecast of Malta Bio Ethanol Market Revenues & Volume By Fuel for the Period 2022 - 2032F
- Historical Data and Forecast of Malta Bio Ethanol Market Revenues & Volume By Power Generation for the Period 2022 - 2032F
- Historical Data and Forecast of Malta Bio Ethanol Market Revenues & Volume By Industrial Processes for the Period 2022 - 2032F
- Historical Data and Forecast of Malta Bio Ethanol Market Revenues & Volume By End User for the Period 2022 - 2032F
- Historical Data and Forecast of Malta Bio Ethanol Market Revenues & Volume By Automotive for the Period 2022 - 2032F
- Historical Data and Forecast of Malta Bio Ethanol Market Revenues & Volume By Energy Producers for the Period 2022 - 2032F
- Historical Data and Forecast of Malta Bio Ethanol Market Revenues & Volume By Industrial for the Period 2022 - 2032F
- Historical Data and Forecast of Malta Bio Ethanol Market Revenues & Volume By Technology for the Period 2022 - 2032F
- Historical Data and Forecast of Malta Bio Ethanol Market Revenues & Volume By Fermentation for the Period 2022 - 2032F
- Historical Data and Forecast of Malta Bio Ethanol Market Revenues & Volume By Distillation for the Period 2022 - 2032F
- Historical Data and Forecast of Malta Bio Ethanol Market Revenues & Volume By Enzymatic Hydrolysis for the Period 2022 - 2032F
- Historical Data and Forecast of Malta Bio Ethanol Market Revenues & Volume By Sustainability Factor for the Period 2022 - 2032F
- Historical Data and Forecast of Malta Bio Ethanol Market Revenues & Volume By Renewable for the Period 2022 - 2032F
- Historical Data and Forecast of Malta Bio Ethanol Market Revenues & Volume By Low Emissions for the Period 2022 - 2032F
- Historical Data and Forecast of Malta Bio Ethanol Market Revenues & Volume By Sustainable for the Period 2022 - 2032F
- Malta Bio Ethanol Import Export Trade Statistics
- Market Opportunity Assessment By Feedstock Type
- Market Opportunity Assessment By Application
- Market Opportunity Assessment By End User
- Market Opportunity Assessment By Technology
- Market Opportunity Assessment By Sustainability Factor
- Malta Bio Ethanol Top Companies Market Share
- Malta Bio Ethanol Competitive Benchmarking By Technical and Operational Parameters
- Malta Bio Ethanol Company Profiles
- Malta Bio Ethanol Key Strategic Recommendations
Frequently Asked Questions About the Market Study (FAQs):
6Wresearch actively monitors the Malta Bio Ethanol Market and publishes its comprehensive annual report, highlighting emerging trends, growth drivers, revenue analysis, and forecast outlook. Our insights help businesses to make data-backed strategic decisions with ongoing market dynamics. Our analysts track relevent industries related to the Malta Bio Ethanol Market, allowing our clients with actionable intelligence and reliable forecasts tailored to emerging regional needs.
Yes, we provide customisation as per your requirements. To learn more, feel free to contact us on sales@6wresearch.com
1 Executive Summary |
2 Introduction |
2.1 Key Highlights of the Report |
2.2 Report Description |
2.3 Market Scope & Segmentation |
2.4 Research Methodology |
2.5 Assumptions |
3 Malta Bio Ethanol Market Overview |
3.1 Malta Country Macro Economic Indicators |
3.2 Malta Bio Ethanol Market Revenues & Volume, 2022 & 2032F |
3.3 Malta Bio Ethanol Market - Industry Life Cycle |
3.4 Malta Bio Ethanol Market - Porter's Five Forces |
3.5 Malta Bio Ethanol Market Revenues & Volume Share, By Feedstock Type, 2022 & 2032F |
3.6 Malta Bio Ethanol Market Revenues & Volume Share, By Application, 2022 & 2032F |
3.7 Malta Bio Ethanol Market Revenues & Volume Share, By End User, 2022 & 2032F |
3.8 Malta Bio Ethanol Market Revenues & Volume Share, By Technology, 2022 & 2032F |
3.9 Malta Bio Ethanol Market Revenues & Volume Share, By Sustainability Factor, 2022 & 2032F |
4 Malta Bio Ethanol Market Dynamics |
4.1 Impact Analysis |
4.2 Market Drivers |
4.3 Market Restraints |
5 Malta Bio Ethanol Market Trends |
6 Malta Bio Ethanol Market, By Types |
6.1 Malta Bio Ethanol Market, By Feedstock Type |
6.1.1 Overview and Analysis |
6.1.2 Malta Bio Ethanol Market Revenues & Volume, By Feedstock Type, 2022 - 2032F |
6.1.3 Malta Bio Ethanol Market Revenues & Volume, By Sugarcane, 2022 - 2032F |
6.1.4 Malta Bio Ethanol Market Revenues & Volume, By Corn, 2022 - 2032F |
6.1.5 Malta Bio Ethanol Market Revenues & Volume, By Cellulosic Biomass, 2022 - 2032F |
6.2 Malta Bio Ethanol Market, By Application |
6.2.1 Overview and Analysis |
6.2.2 Malta Bio Ethanol Market Revenues & Volume, By Fuel, 2022 - 2032F |
6.2.3 Malta Bio Ethanol Market Revenues & Volume, By Power Generation, 2022 - 2032F |
6.2.4 Malta Bio Ethanol Market Revenues & Volume, By Industrial Processes, 2022 - 2032F |
6.3 Malta Bio Ethanol Market, By End User |
6.3.1 Overview and Analysis |
6.3.2 Malta Bio Ethanol Market Revenues & Volume, By Automotive, 2022 - 2032F |
6.3.3 Malta Bio Ethanol Market Revenues & Volume, By Energy Producers, 2022 - 2032F |
6.3.4 Malta Bio Ethanol Market Revenues & Volume, By Industrial, 2022 - 2032F |
6.4 Malta Bio Ethanol Market, By Technology |
6.4.1 Overview and Analysis |
6.4.2 Malta Bio Ethanol Market Revenues & Volume, By Fermentation, 2022 - 2032F |
6.4.3 Malta Bio Ethanol Market Revenues & Volume, By Distillation, 2022 - 2032F |
6.4.4 Malta Bio Ethanol Market Revenues & Volume, By Enzymatic Hydrolysis, 2022 - 2032F |
6.5 Malta Bio Ethanol Market, By Sustainability Factor |
6.5.1 Overview and Analysis |
6.5.2 Malta Bio Ethanol Market Revenues & Volume, By Renewable, 2022 - 2032F |
6.5.3 Malta Bio Ethanol Market Revenues & Volume, By Low Emissions, 2022 - 2032F |
6.5.4 Malta Bio Ethanol Market Revenues & Volume, By Sustainable, 2022 - 2032F |
7 Malta Bio Ethanol Market Import-Export Trade Statistics |
7.1 Malta Bio Ethanol Market Export to Major Countries |
7.2 Malta Bio Ethanol Market Imports from Major Countries |
8 Malta Bio Ethanol Market Key Performance Indicators |
9 Malta Bio Ethanol Market - Opportunity Assessment |
9.1 Malta Bio Ethanol Market Opportunity Assessment, By Feedstock Type, 2022 & 2032F |
9.2 Malta Bio Ethanol Market Opportunity Assessment, By Application, 2022 & 2032F |
9.3 Malta Bio Ethanol Market Opportunity Assessment, By End User, 2022 & 2032F |
9.4 Malta Bio Ethanol Market Opportunity Assessment, By Technology, 2022 & 2032F |
9.5 Malta Bio Ethanol Market Opportunity Assessment, By Sustainability Factor, 2022 & 2032F |
10 Malta Bio Ethanol Market - Competitive Landscape |
10.1 Malta Bio Ethanol Market Revenue Share, By Companies, 2025 |
10.2 Malta Bio Ethanol Market Competitive Benchmarking, By Operating and Technical Parameters |
11 Company Profiles |
12 Recommendations |
13 Disclaimer |
Global Go To Market Strategy - 2030
Export potential enables firms to identify high-growth global markets with greater confidence by combining advanced trade intelligence with a structured quantitative methodology. The framework analyzes emerging demand trends and country-level import patterns while integrating macroeconomic and trade datasets such as GDP and population forecasts, bilateral import–export flows, tariff structures, elasticity differentials between developed and developing economies, geographic distance, and import demand projections. Using weighted trade values from 2020–2024 as the base period to project country-to-country export potential for 2030, these inputs are operationalized through calculated drivers such as gravity model parameters, tariff impact factors, and projected GDP per-capita growth. Through an analysis of hidden potentials, demand hotspots, and market conditions that are most favorable to success, this method enables firms to focus on target countries, maximize returns, and global expansion with data, backed by accuracy.
By factoring in the projected importer demand gap that is currently unmet and could be potential opportunity, it identifies the potential for the Exporter (Country) among 190 countries, against the general trade analysis, which identifies the biggest importer or exporter.
To discover high-growth global markets and optimize your business strategy:
Click Here
Pricing
- Single User License$ 1,995
- Department License$ 2,400
- Site License$ 3,120
- Global License$ 3,795

Leadership Perspectives from Industry Events
Search
Thought Leadership and Analyst Meet


Our Clients
6WResearch In News
- Doha a strategic location for EV manufacturing hub: IPA Qatar
- Demand for luxury TVs surging in the GCC, says Samsung
- Empowering Growth: The Thriving Journey of Bangladesh’s Cable Industry
- Demand for luxury TVs surging in the GCC, says Samsung
- Video call with a traditional healer? Once unthinkable, it’s now common in South Africa
- Intelligent Buildings To Smooth GCC’s Path To Net Zero
Latest Reports
- Cape Verde Portable Hand-Thrown Extinguisher Market (2026-2032)
- Canada Portable Hand-Thrown Extinguisher Market (2026-2032)
- Cameroon Portable Hand-Thrown Extinguisher Market (2026-2032)
- Burundi Portable Hand-Thrown Extinguisher Market (2026-2032)
- Burkina Faso Portable Hand-Thrown Extinguisher Market (2026-2032)
- Bulgaria Portable Hand-Thrown Extinguisher Market (2026-2032)
- Brunei Portable Hand-Thrown Extinguisher Market (2026-2032)
- Botswana Portable Hand-Thrown Extinguisher Market (2026-2032)
- Bosnia and Herzegovina Portable Hand-Thrown Extinguisher Market (2026-2032)
- Bolivia Portable Hand-Thrown Extinguisher Market (2026-2032)
Industry Events and Analyst Meet

HIMTEX 2026

India Refining Summit 2026

India EV Show 2026

EV tech India Expo 2026

Auto Tech Asia 2026
Whitepaper
- Middle East & Africa Commercial Security Market Click here to view more.
- Middle East & Africa Fire Safety Systems & Equipment Market Click here to view more.
- GCC Drone Market Click here to view more.
- Middle East Lighting Fixture Market Click here to view more.
- GCC Physical & Perimeter Security Market Click here to view more.