Malta Captive Power Plant Market (2026-2032) | Analysis, Trends, Growth, Value, Segmentation, Companies, Size & Revenue, Forecast, Share, Outlook, Competitive Landscape, Industry
Market Forecast By Fuel Source (Coal, Gas, Diesel, Renewable, Other Fuel Sources), By Industry (Cement, Steel, Metal & Minerals, Petrochemicals) And Competitive Landscape
| Product Code: ETC8188057 | Publication Date: Sep 2024 | Updated Date: Apr 2026 | Product Type: Market Research Report | |
| Publisher: 6Wresearch | Author: Sumit Sagar | No. of Pages: 75 | No. of Figures: 35 | No. of Tables: 20 |
Malta Captive Power Plant Market Size (2020-2030)
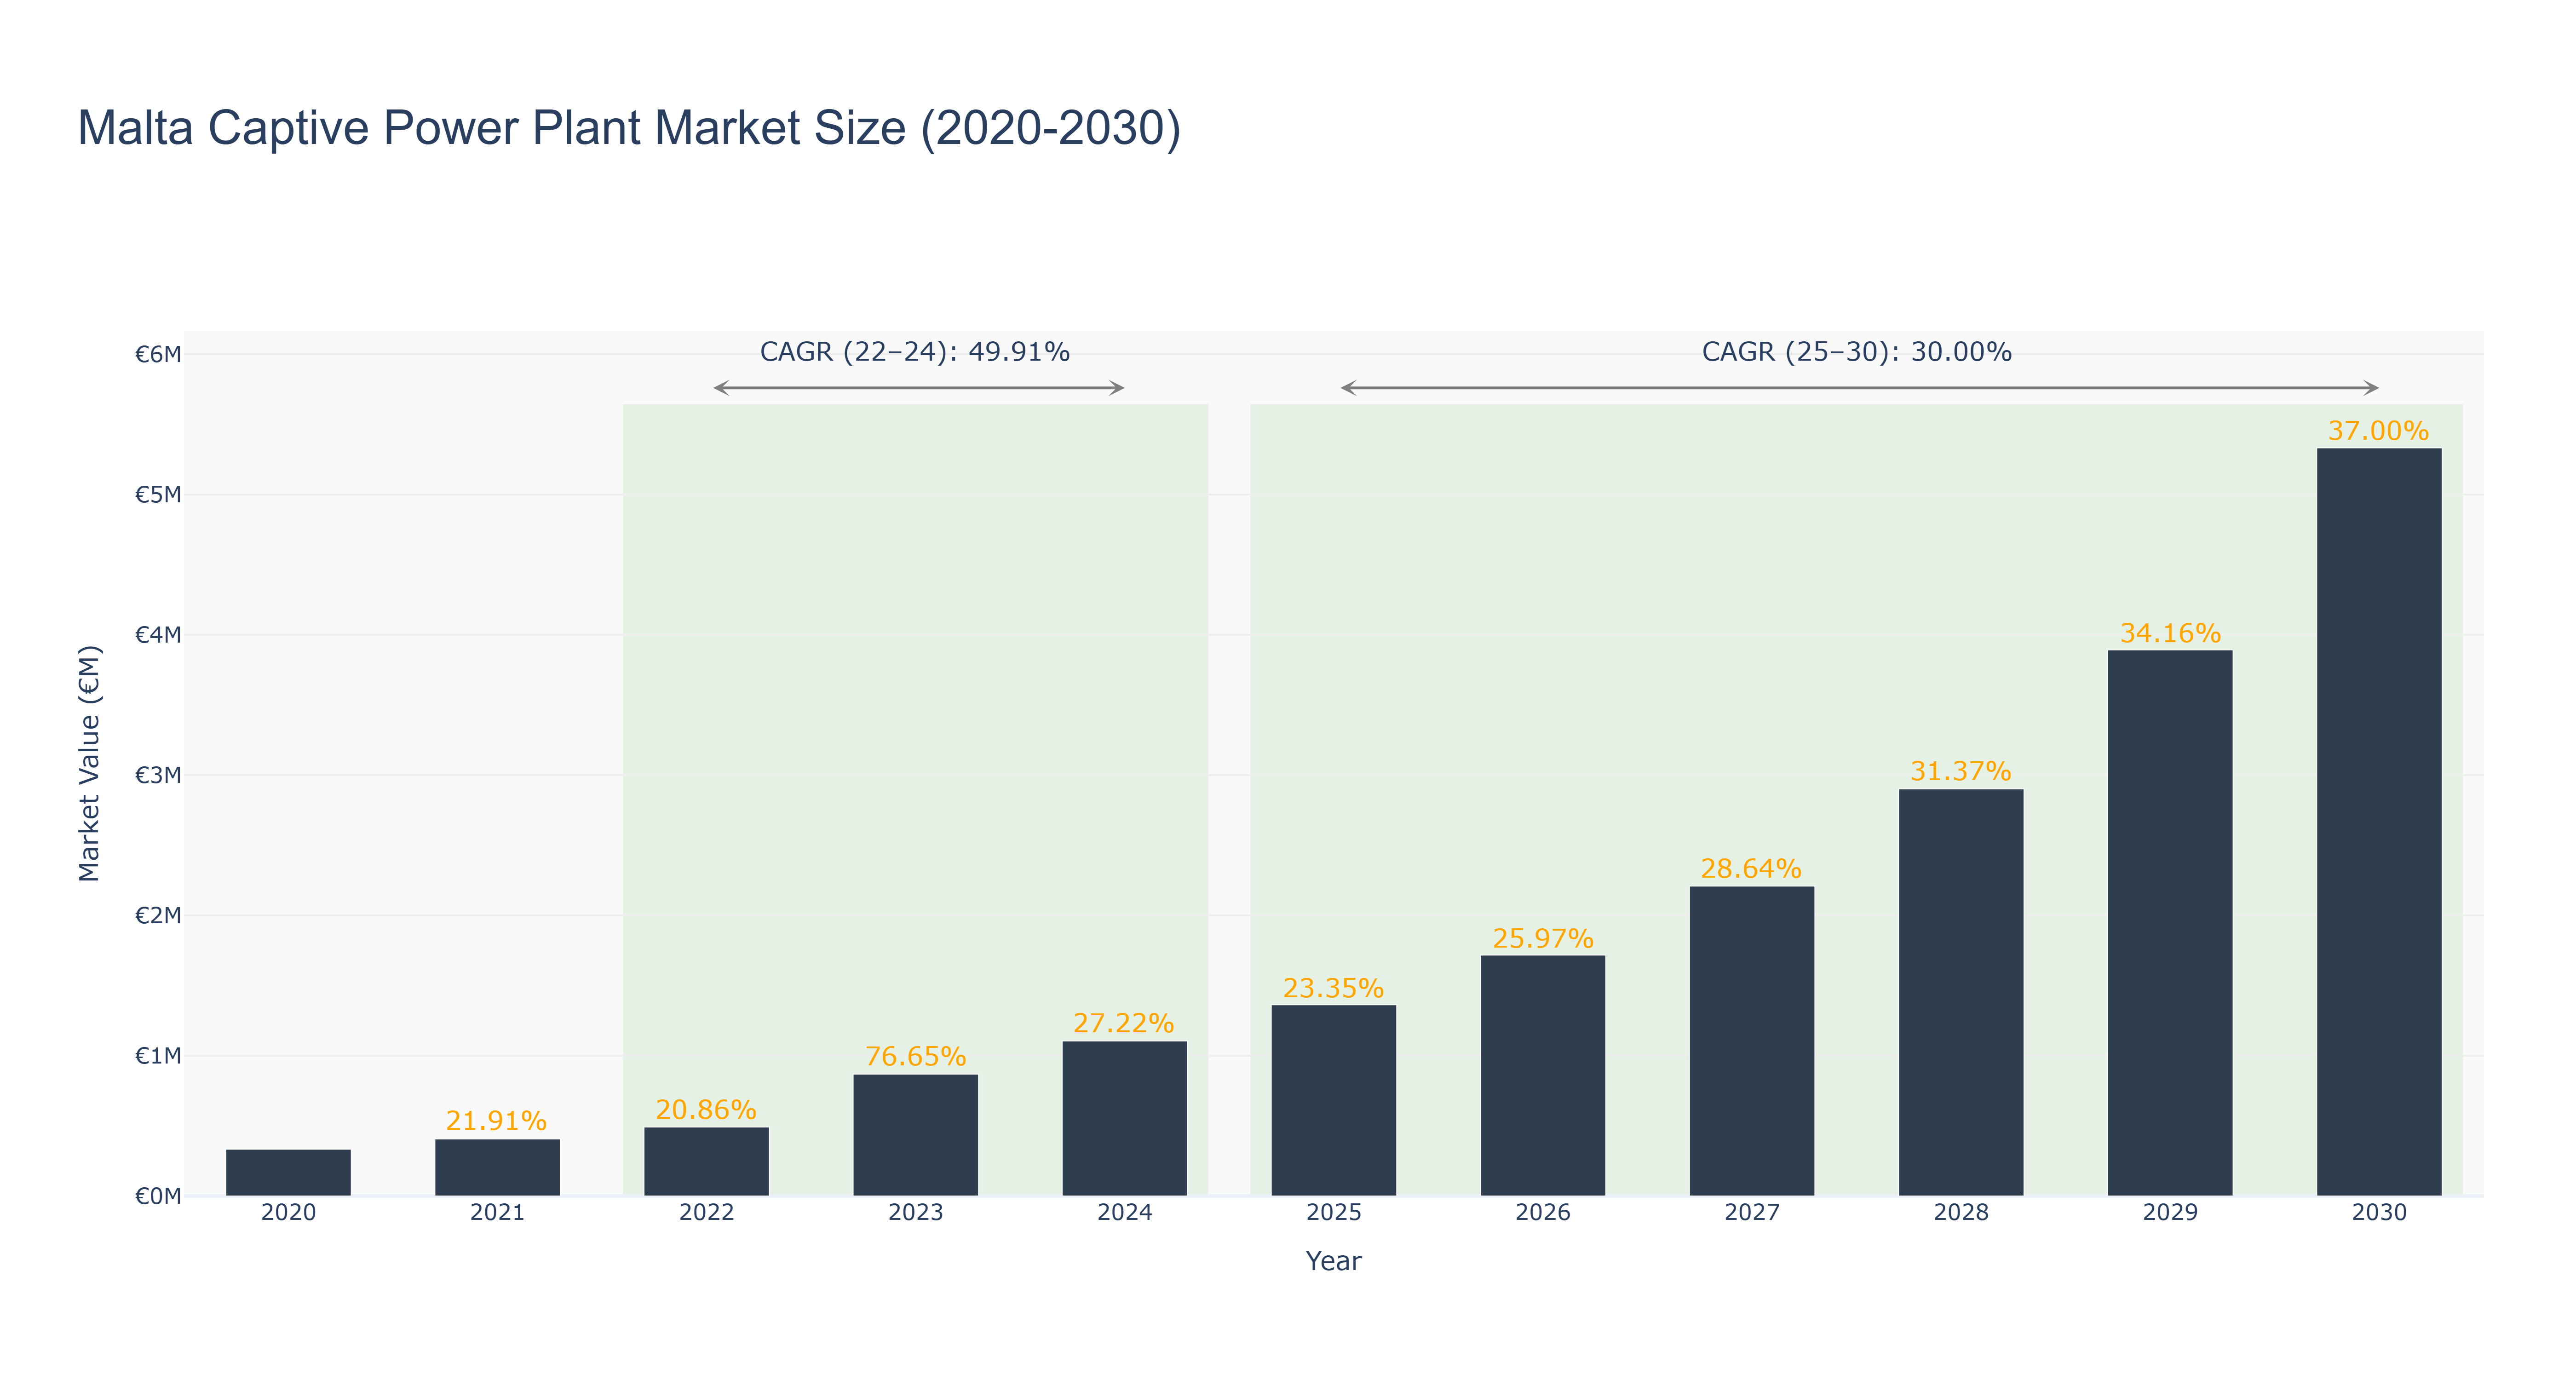
Malta Captive Power Plant Market has shown a significant growth trajectory over the years. The peak market size was €5.33 million in 2030, with a notable increase in market size from €0.33 million in 2020 to €1.10 million in 2024. The forecasted market size is expected to reach €5.33 million by 2030, with a CAGR of 30.0% from 2025 to 2030. The market experienced a sharp increase in growth from 2022 to 2024 with a CAGR of 49.91%, attributed to increased investment in renewable energy sources. The subsequent steady growth from 2025 to 2030 can be attributed to government incentives promoting sustainability and energy efficiency. Recent developments include the implementation of advanced technology in power generation and upcoming projects focusing on enhancing grid reliability and reducing carbon emissions. Industry drivers include the shift towards clean energy sources, government policies supporting renewable energy integration, and the need for reliable power supply in the region.
Malta Captive Power Plant Market: Production & Trade Performance (2019-2025)
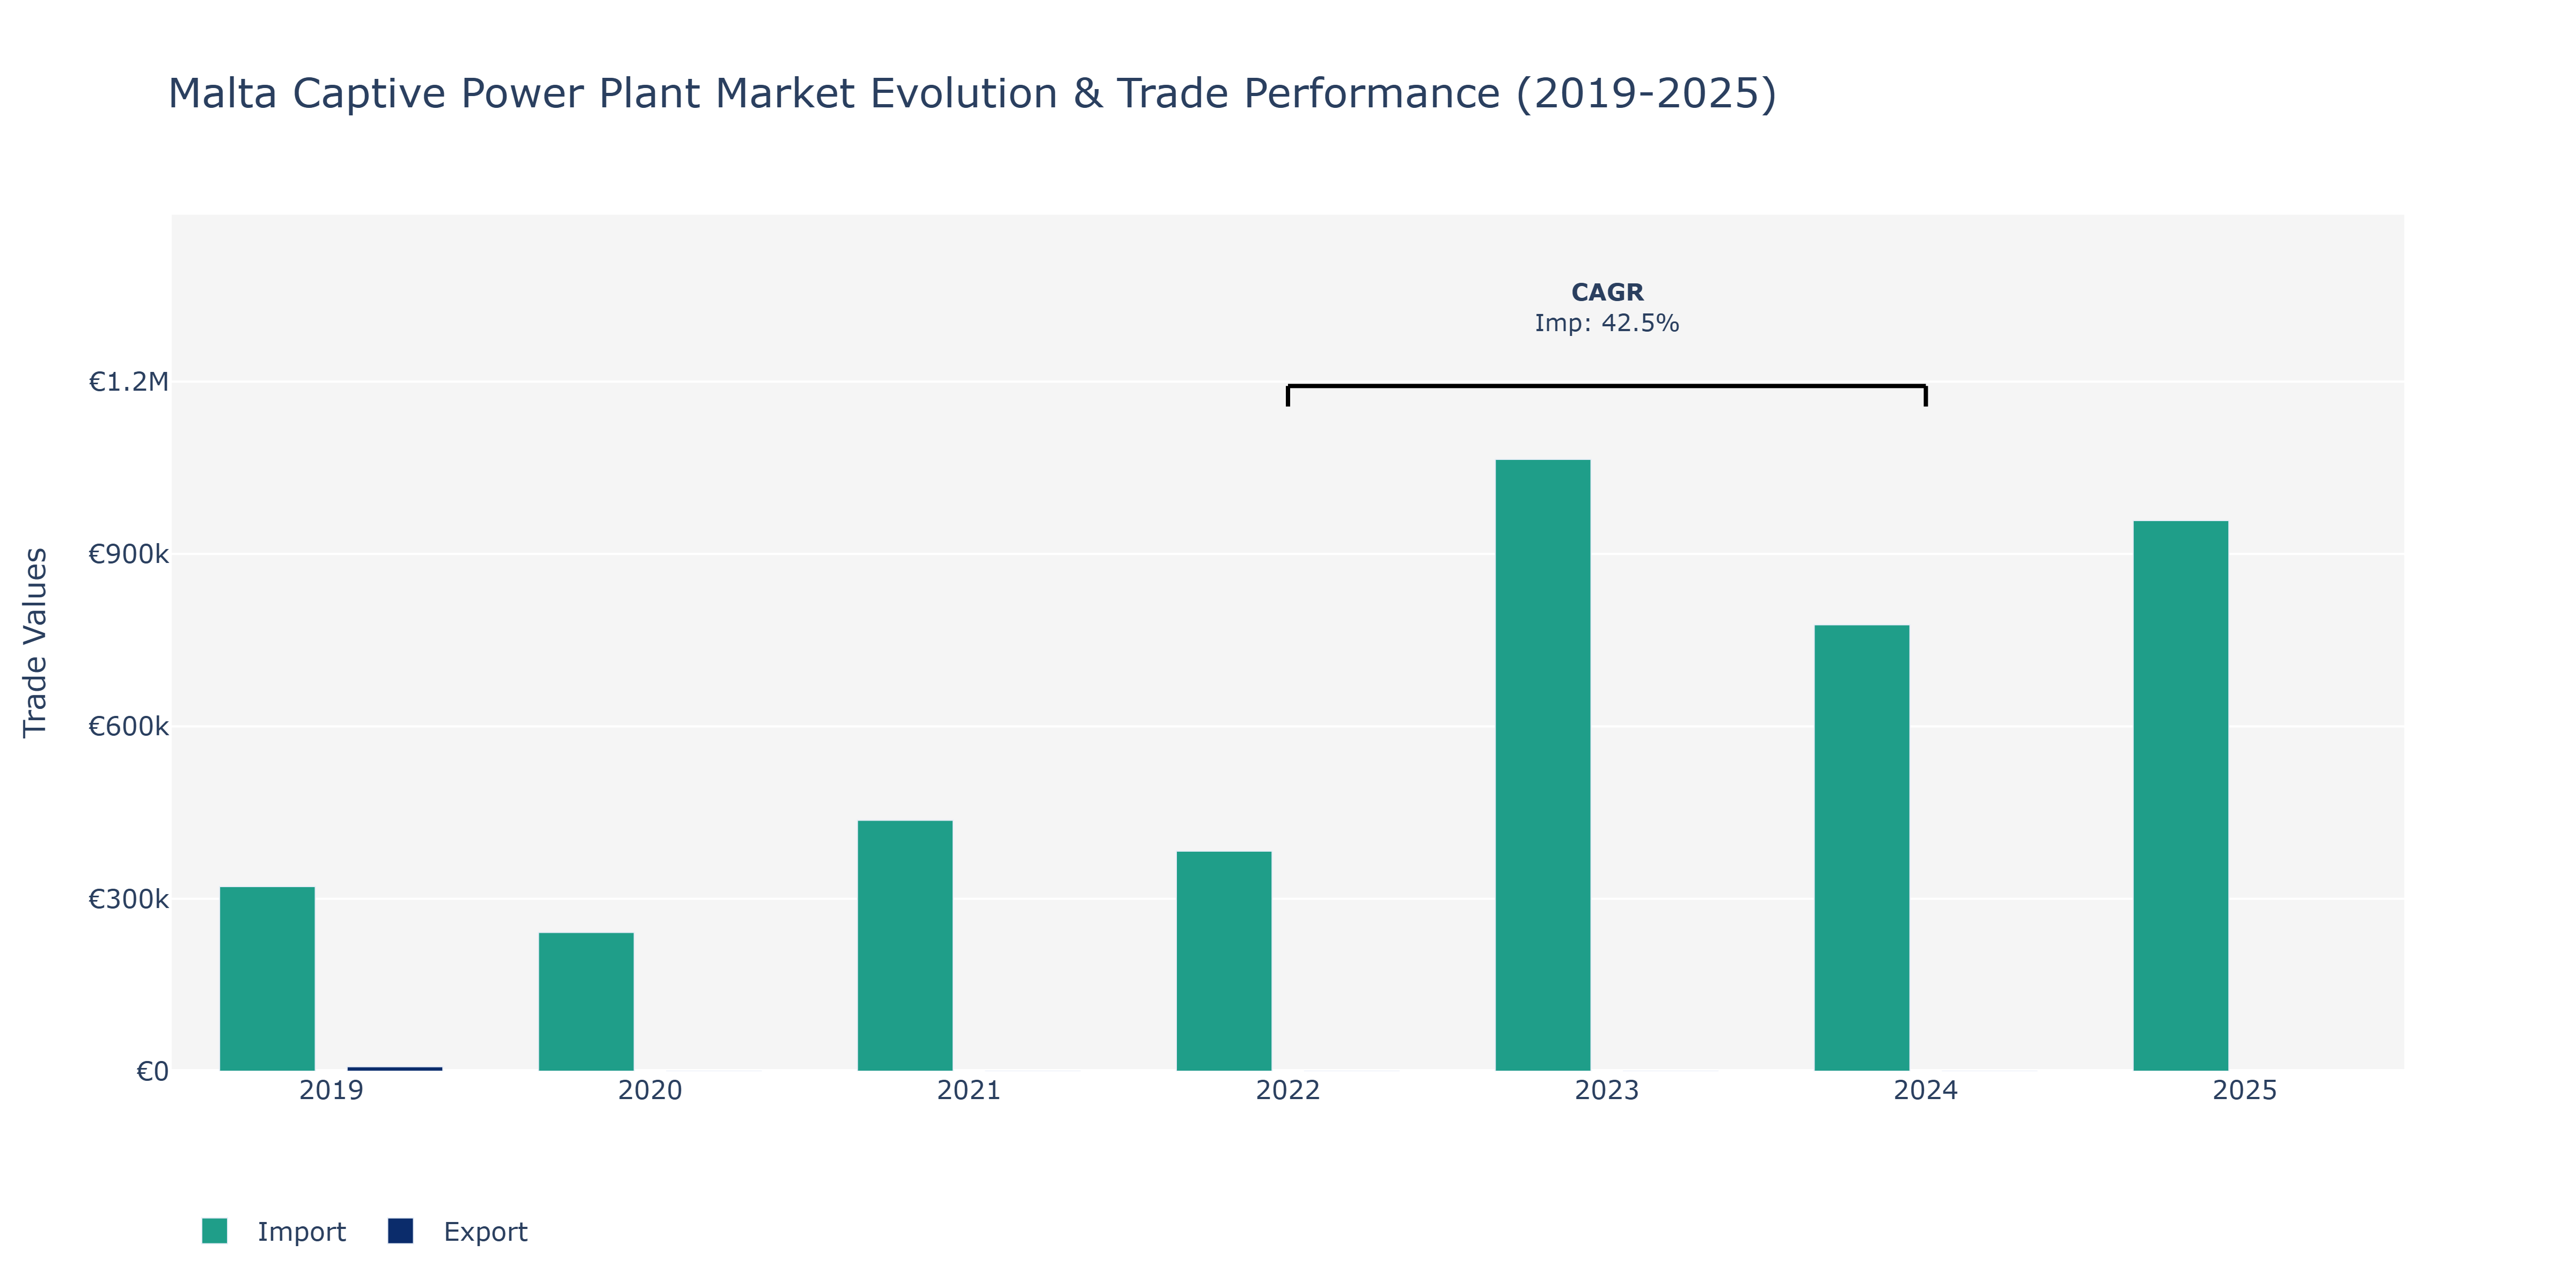
In the Malta Captive Power Plant Market, imports showed a fluctuating trend from 2020 to 2025. Starting at €241.39 thousand in 2020, imports surged to €1.06 million in 2023 before declining to €958.17 thousand in 2025. This fluctuation can be attributed to various factors such as changes in energy demand, regulatory policies, and global economic conditions. The peak in 2023 could be linked to increased infrastructure projects requiring more power equipment, leading to higher imports. The subsequent decline might stem from shifts in government priorities towards sustainability and renewable energy sources, impacting the demand for traditional power plant imports. These trends highlight the market's sensitivity to external factors and the need for market players to adapt to evolving energy landscapes to maintain competitiveness in Malta's captive power sector.
Key Highlights of the Report:
- Malta Captive Power Plant Market Outlook
- Market Size of Malta Captive Power Plant Market, 2025
- Forecast of Malta Captive Power Plant Market, 2032
- Historical Data and Forecast of Malta Captive Power Plant Revenues & Volume for the Period 2022 - 2032
- Malta Captive Power Plant Market Trend Evolution
- Malta Captive Power Plant Market Drivers and Challenges
- Malta Captive Power Plant Price Trends
- Malta Captive Power Plant Porter's Five Forces
- Malta Captive Power Plant Industry Life Cycle
- Historical Data and Forecast of Malta Captive Power Plant Market Revenues & Volume By Fuel Source for the Period 2022 - 2032
- Historical Data and Forecast of Malta Captive Power Plant Market Revenues & Volume By Coal for the Period 2022 - 2032
- Historical Data and Forecast of Malta Captive Power Plant Market Revenues & Volume By Gas for the Period 2022 - 2032
- Historical Data and Forecast of Malta Captive Power Plant Market Revenues & Volume By Diesel for the Period 2022 - 2032
- Historical Data and Forecast of Malta Captive Power Plant Market Revenues & Volume By Renewable for the Period 2022 - 2032
- Historical Data and Forecast of Malta Captive Power Plant Market Revenues & Volume By Other Fuel Sources for the Period 2022 - 2032
- Historical Data and Forecast of Malta Captive Power Plant Market Revenues & Volume By Industry for the Period 2022 - 2032
- Historical Data and Forecast of Malta Captive Power Plant Market Revenues & Volume By Cement for the Period 2022 - 2032
- Historical Data and Forecast of Malta Captive Power Plant Market Revenues & Volume By Steel for the Period 2022 - 2032
- Historical Data and Forecast of Malta Captive Power Plant Market Revenues & Volume By Metal & Minerals for the Period 2022 - 2032
- Historical Data and Forecast of Malta Captive Power Plant Market Revenues & Volume By Petrochemicals for the Period 2022 - 2032
- Malta Captive Power Plant Import Export Trade Statistics
- Market Opportunity Assessment By Fuel Source
- Market Opportunity Assessment By Industry
- Malta Captive Power Plant Top Companies Market Share
- Malta Captive Power Plant Competitive Benchmarking By Technical and Operational Parameters
- Malta Captive Power Plant Company Profiles
- Malta Captive Power Plant Key Strategic Recommendations
Frequently Asked Questions About the Market Study (FAQs):
6Wresearch actively monitors the Malta Captive Power Plant Market and publishes its comprehensive annual report, highlighting emerging trends, growth drivers, revenue analysis, and forecast outlook. Our insights help businesses to make data-backed strategic decisions with ongoing market dynamics. Our analysts track relevent industries related to the Malta Captive Power Plant Market, allowing our clients with actionable intelligence and reliable forecasts tailored to emerging regional needs.
Yes, we provide customisation as per your requirements. To learn more, feel free to contact us on sales@6wresearch.com
1 Executive Summary |
2 Introduction |
2.1 Key Highlights of the Report |
2.2 Report Description |
2.3 Market Scope & Segmentation |
2.4 Research Methodology |
2.5 Assumptions |
3 Malta Captive Power Plant Market Overview |
3.1 Malta Country Macro Economic Indicators |
3.2 Malta Captive Power Plant Market Revenues & Volume, 2022 & 2032F |
3.3 Malta Captive Power Plant Market - Industry Life Cycle |
3.4 Malta Captive Power Plant Market - Porter's Five Forces |
3.5 Malta Captive Power Plant Market Revenues & Volume Share, By Fuel Source, 2022 & 2032F |
3.6 Malta Captive Power Plant Market Revenues & Volume Share, By Industry, 2022 & 2032F |
4 Malta Captive Power Plant Market Dynamics |
4.1 Impact Analysis |
4.2 Market Drivers |
4.2.1 Increasing energy demand and the need for reliable power supply in Malta |
4.2.2 Rising focus on energy efficiency and sustainability initiatives |
4.2.3 Government support and incentives for the development of captive power plants |
4.3 Market Restraints |
4.3.1 High initial investment costs for setting up captive power plants |
4.3.2 Dependence on imported fuel for power generation leading to cost fluctuations |
4.3.3 Stringent environmental regulations and compliance requirements |
5 Malta Captive Power Plant Market Trends |
6 Malta Captive Power Plant Market, By Types |
6.1 Malta Captive Power Plant Market, By Fuel Source |
6.1.1 Overview and Analysis |
6.1.2 Malta Captive Power Plant Market Revenues & Volume, By Fuel Source, 2022 - 2032F |
6.1.3 Malta Captive Power Plant Market Revenues & Volume, By Coal, 2022 - 2032F |
6.1.4 Malta Captive Power Plant Market Revenues & Volume, By Gas, 2022 - 2032F |
6.1.5 Malta Captive Power Plant Market Revenues & Volume, By Diesel, 2022 - 2032F |
6.1.6 Malta Captive Power Plant Market Revenues & Volume, By Renewable, 2022 - 2032F |
6.1.7 Malta Captive Power Plant Market Revenues & Volume, By Other Fuel Sources, 2022 - 2032F |
6.2 Malta Captive Power Plant Market, By Industry |
6.2.1 Overview and Analysis |
6.2.2 Malta Captive Power Plant Market Revenues & Volume, By Cement, 2022 - 2032F |
6.2.3 Malta Captive Power Plant Market Revenues & Volume, By Steel, 2022 - 2032F |
6.2.4 Malta Captive Power Plant Market Revenues & Volume, By Metal & Minerals, 2022 - 2032F |
6.2.5 Malta Captive Power Plant Market Revenues & Volume, By Petrochemicals, 2022 - 2032F |
7 Malta Captive Power Plant Market Import-Export Trade Statistics |
7.1 Malta Captive Power Plant Market Export to Major Countries |
7.2 Malta Captive Power Plant Market Imports from Major Countries |
8 Malta Captive Power Plant Market Key Performance Indicators |
8.1 Renewable energy penetration rate in the Malta energy mix |
8.2 Average capacity utilization rate of captive power plants in Malta |
8.3 Number of new captive power plant installations in Malta per year |
9 Malta Captive Power Plant Market - Opportunity Assessment |
9.1 Malta Captive Power Plant Market Opportunity Assessment, By Fuel Source, 2022 & 2032F |
9.2 Malta Captive Power Plant Market Opportunity Assessment, By Industry, 2022 & 2032F |
10 Malta Captive Power Plant Market - Competitive Landscape |
10.1 Malta Captive Power Plant Market Revenue Share, By Companies, 2025 |
10.2 Malta Captive Power Plant Market Competitive Benchmarking, By Operating and Technical Parameters |
11 Company Profiles |
12 Recommendations |
13 Disclaimer |
Global Go To Market Strategy - 2030
Export potential enables firms to identify high-growth global markets with greater confidence by combining advanced trade intelligence with a structured quantitative methodology. The framework analyzes emerging demand trends and country-level import patterns while integrating macroeconomic and trade datasets such as GDP and population forecasts, bilateral import–export flows, tariff structures, elasticity differentials between developed and developing economies, geographic distance, and import demand projections. Using weighted trade values from 2020–2024 as the base period to project country-to-country export potential for 2030, these inputs are operationalized through calculated drivers such as gravity model parameters, tariff impact factors, and projected GDP per-capita growth. Through an analysis of hidden potentials, demand hotspots, and market conditions that are most favorable to success, this method enables firms to focus on target countries, maximize returns, and global expansion with data, backed by accuracy.
By factoring in the projected importer demand gap that is currently unmet and could be potential opportunity, it identifies the potential for the Exporter (Country) among 190 countries, against the general trade analysis, which identifies the biggest importer or exporter.
To discover high-growth global markets and optimize your business strategy:
Click Here
Pricing
- Single User License$ 1,995
- Department License$ 2,400
- Site License$ 3,120
- Global License$ 3,795

Leadership Perspectives from Industry Events
Search
Thought Leadership and Analyst Meet


Our Clients
6WResearch In News
- India Export Attractiveness Tracker 2026
- India Air Conditioner Market Set for Strong Rebound in 2026 After Weather-Led Correction and GST-Driven Recovery: 6Wresearch
- ADAS in India: How Automatic Emergency Braking, Blind Spot Detection & Driver Monitoring are Transforming Road Safety
- Doha a strategic location for EV manufacturing hub: IPA Qatar
- Demand for luxury TVs surging in the GCC, says Samsung
- Empowering Growth: The Thriving Journey of Bangladesh’s Cable Industry
Latest Reports
- Qatar Access and Home Network Market (2026-2032)
- Nicaragua RPG Gaming Market (2026-2032)
- New Zealand RPG Gaming Market (2026-2032)
- Netherlands RPG Gaming Market (2026-2032)
- Nauru RPG Gaming Market (2026-2032)
- Namibia RPG Gaming Market (2026-2032)
- Mozambique RPG Gaming Market (2026-2032)
- Montenegro RPG Gaming Market (2026-2032)
- Mongolia RPG Gaming Market (2026-2032)
- Monaco RPG Gaming Market (2026-2032)
Industry Events and Analyst Meet

EV India Expo 2026

HIMTEX 2026

India Refining Summit 2026

India EV Show 2026

EV tech India Expo 2026
Whitepaper
- Middle East & Africa Commercial Security Market Click here to view more.
- Middle East & Africa Fire Safety Systems & Equipment Market Click here to view more.
- GCC Drone Market Click here to view more.
- Middle East Lighting Fixture Market Click here to view more.
- GCC Physical & Perimeter Security Market Click here to view more.