Malta Ceramic And Natural Stone Tiles Market (2026-2032) | Industry, Analysis, Outlook, Companies, Competitive Landscape, Share, Growth, Forecast, Size & Revenue, Segmentation, Trends, Value
Market Forecast By Product (Glazed ceramic tiles, Porcelain tiles, Scratch free ceramic tiles, Granite tiles, Limestone tiles, Travertine tiles, Others) And Competitive Landscape
| Product Code: ETC8188467 | Publication Date: Sep 2024 | Updated Date: Apr 2026 | Product Type: Market Research Report | |
| Publisher: 6Wresearch | Author: Sumit Sagar | No. of Pages: 75 | No. of Figures: 35 | No. of Tables: 20 |
Malta Ceramic And Natural Stone Tiles Market Size (2020-2030)
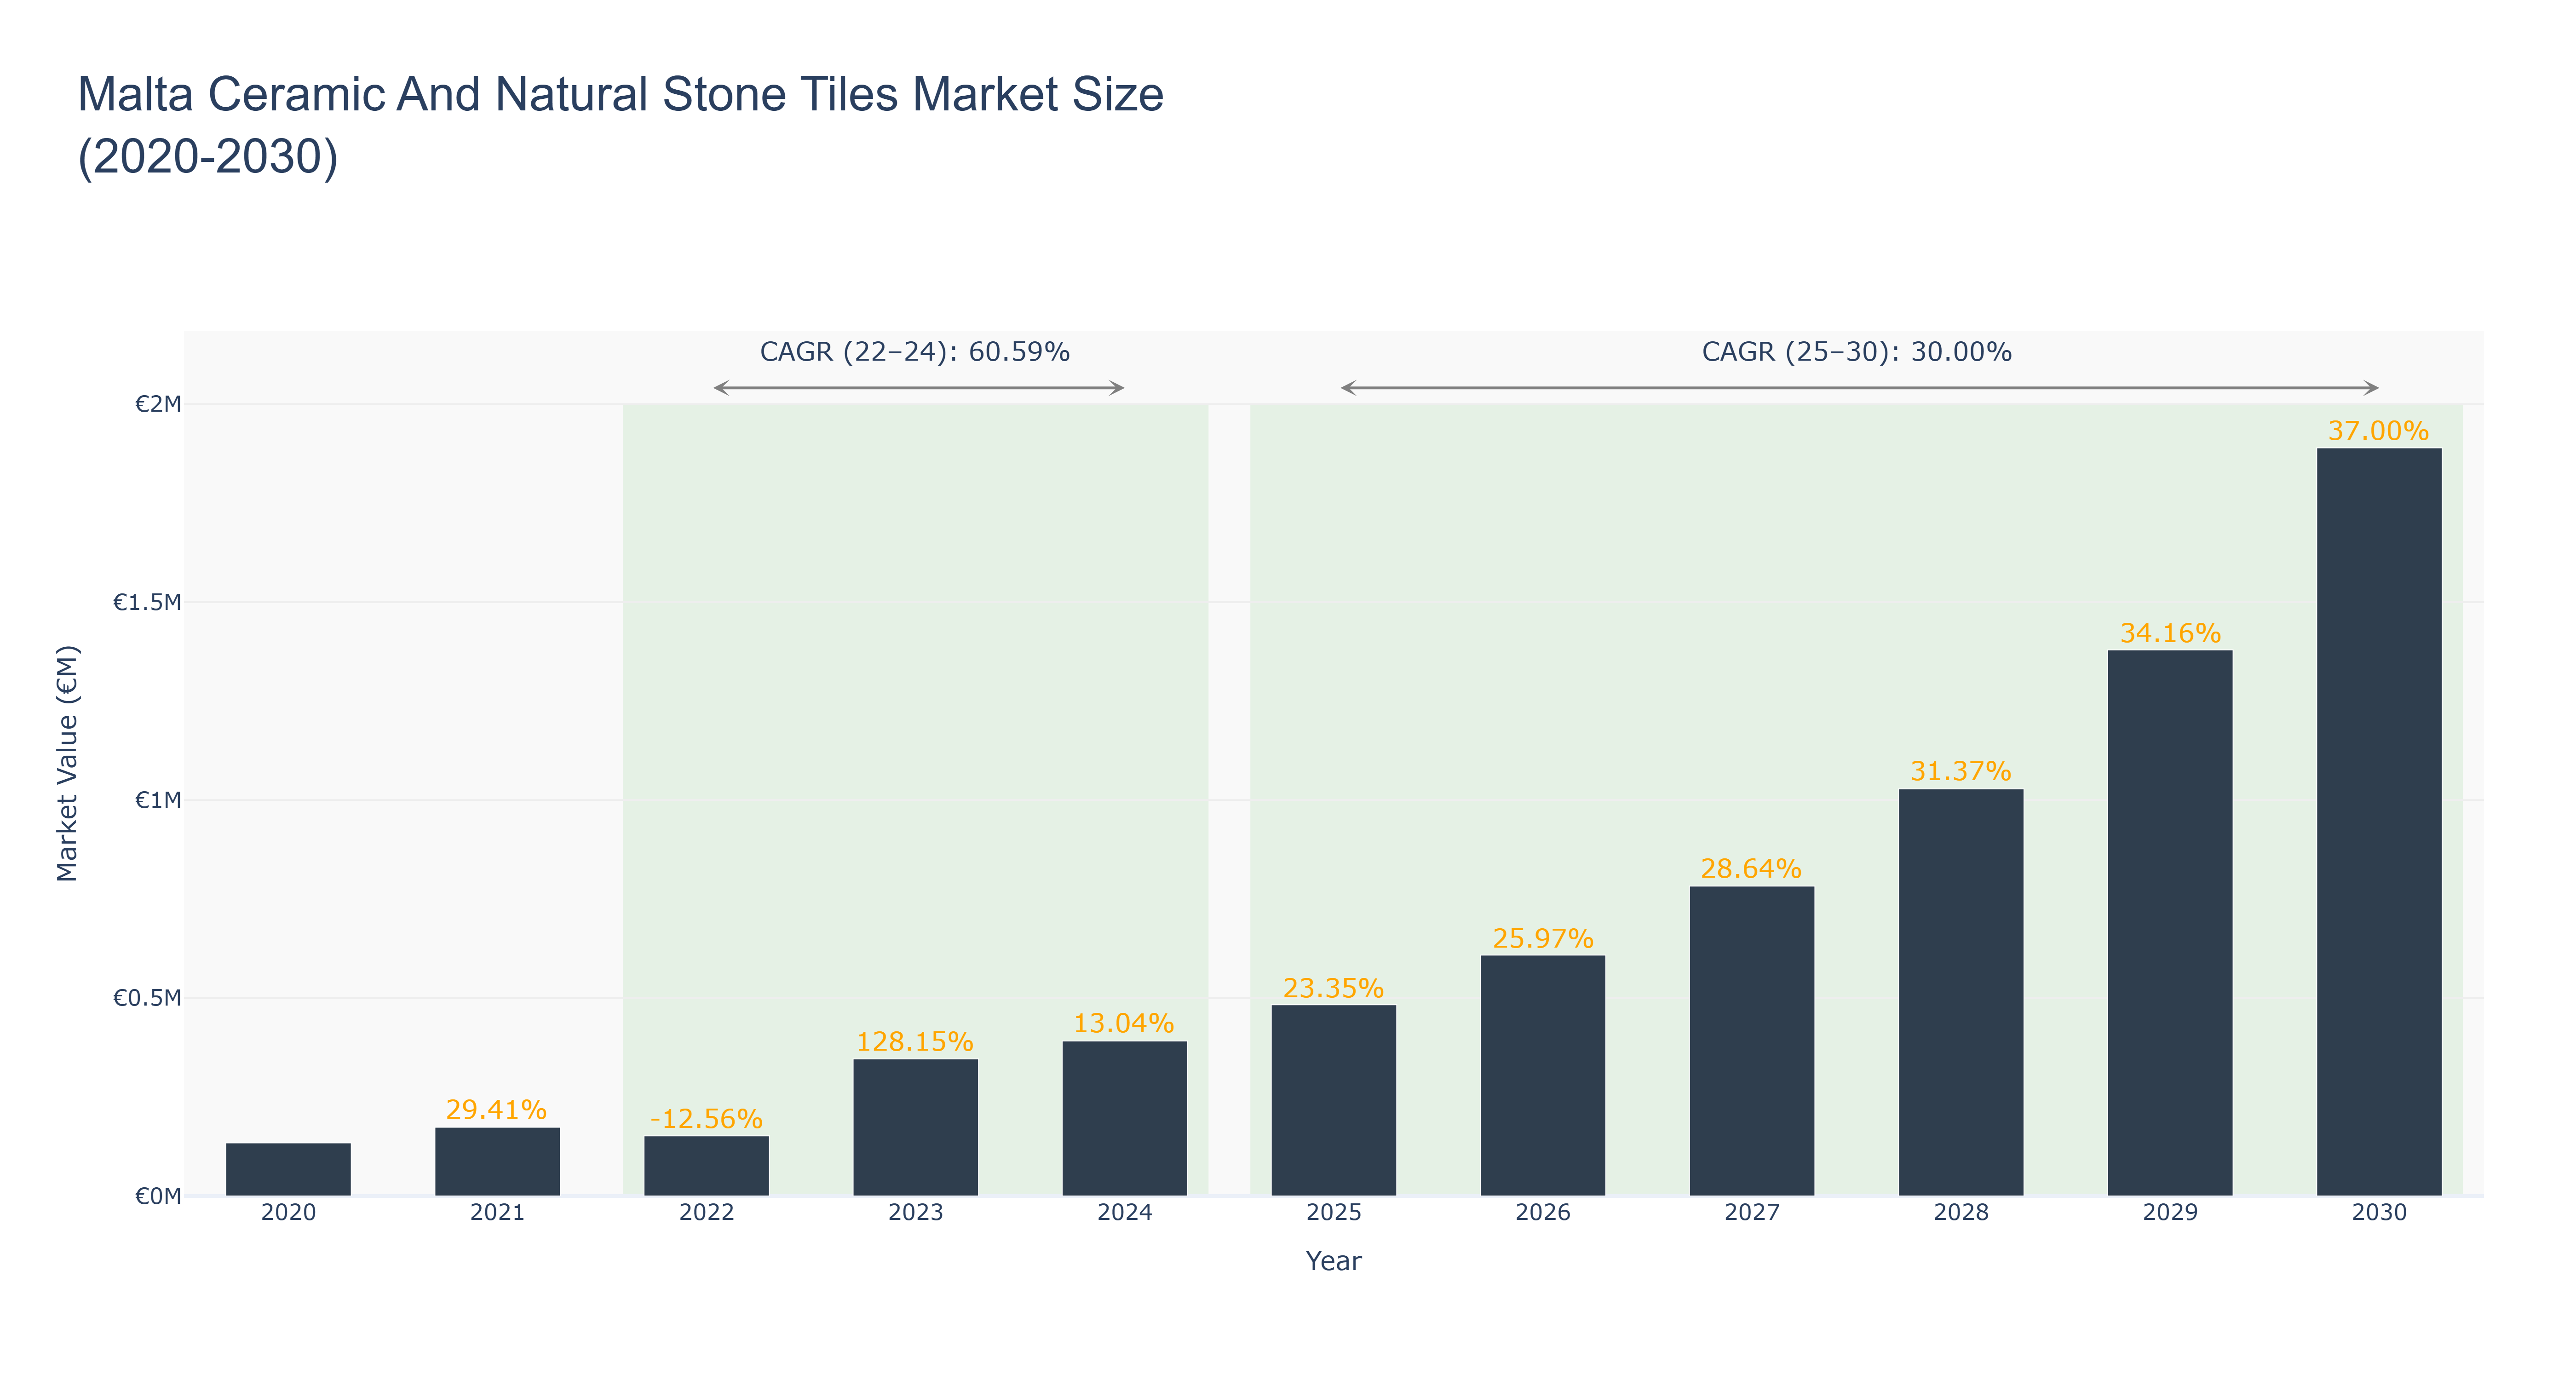
The Malta Ceramic and Natural Stone Tiles Market experienced significant fluctuations between 2020 and 2024. The market size peaked at €346.32 thousand in 2023, reflecting an impressive growth rate of 128.15%, following a decline to €151.79 thousand in 2022, driven by shifting consumer preferences and supply chain disruptions. The market is projected to stabilize and grow, with an anticipated CAGR of 30.00% from 2025 to 2030, reaching €1.89 million by 2030. Factors propelling this growth include increased investments in construction and renovation projects, a surge in tourism, and a growing preference for sustainable materials. As Malta continues to develop its infrastructure and promote eco-friendly solutions, the ceramic and natural stone tiles segment is poised for robust expansion, positioning itself as a key player in the region's building materials market.
Malta Ceramic And Natural Stone Tiles Market: Production & Trade Performance (2019-2025)
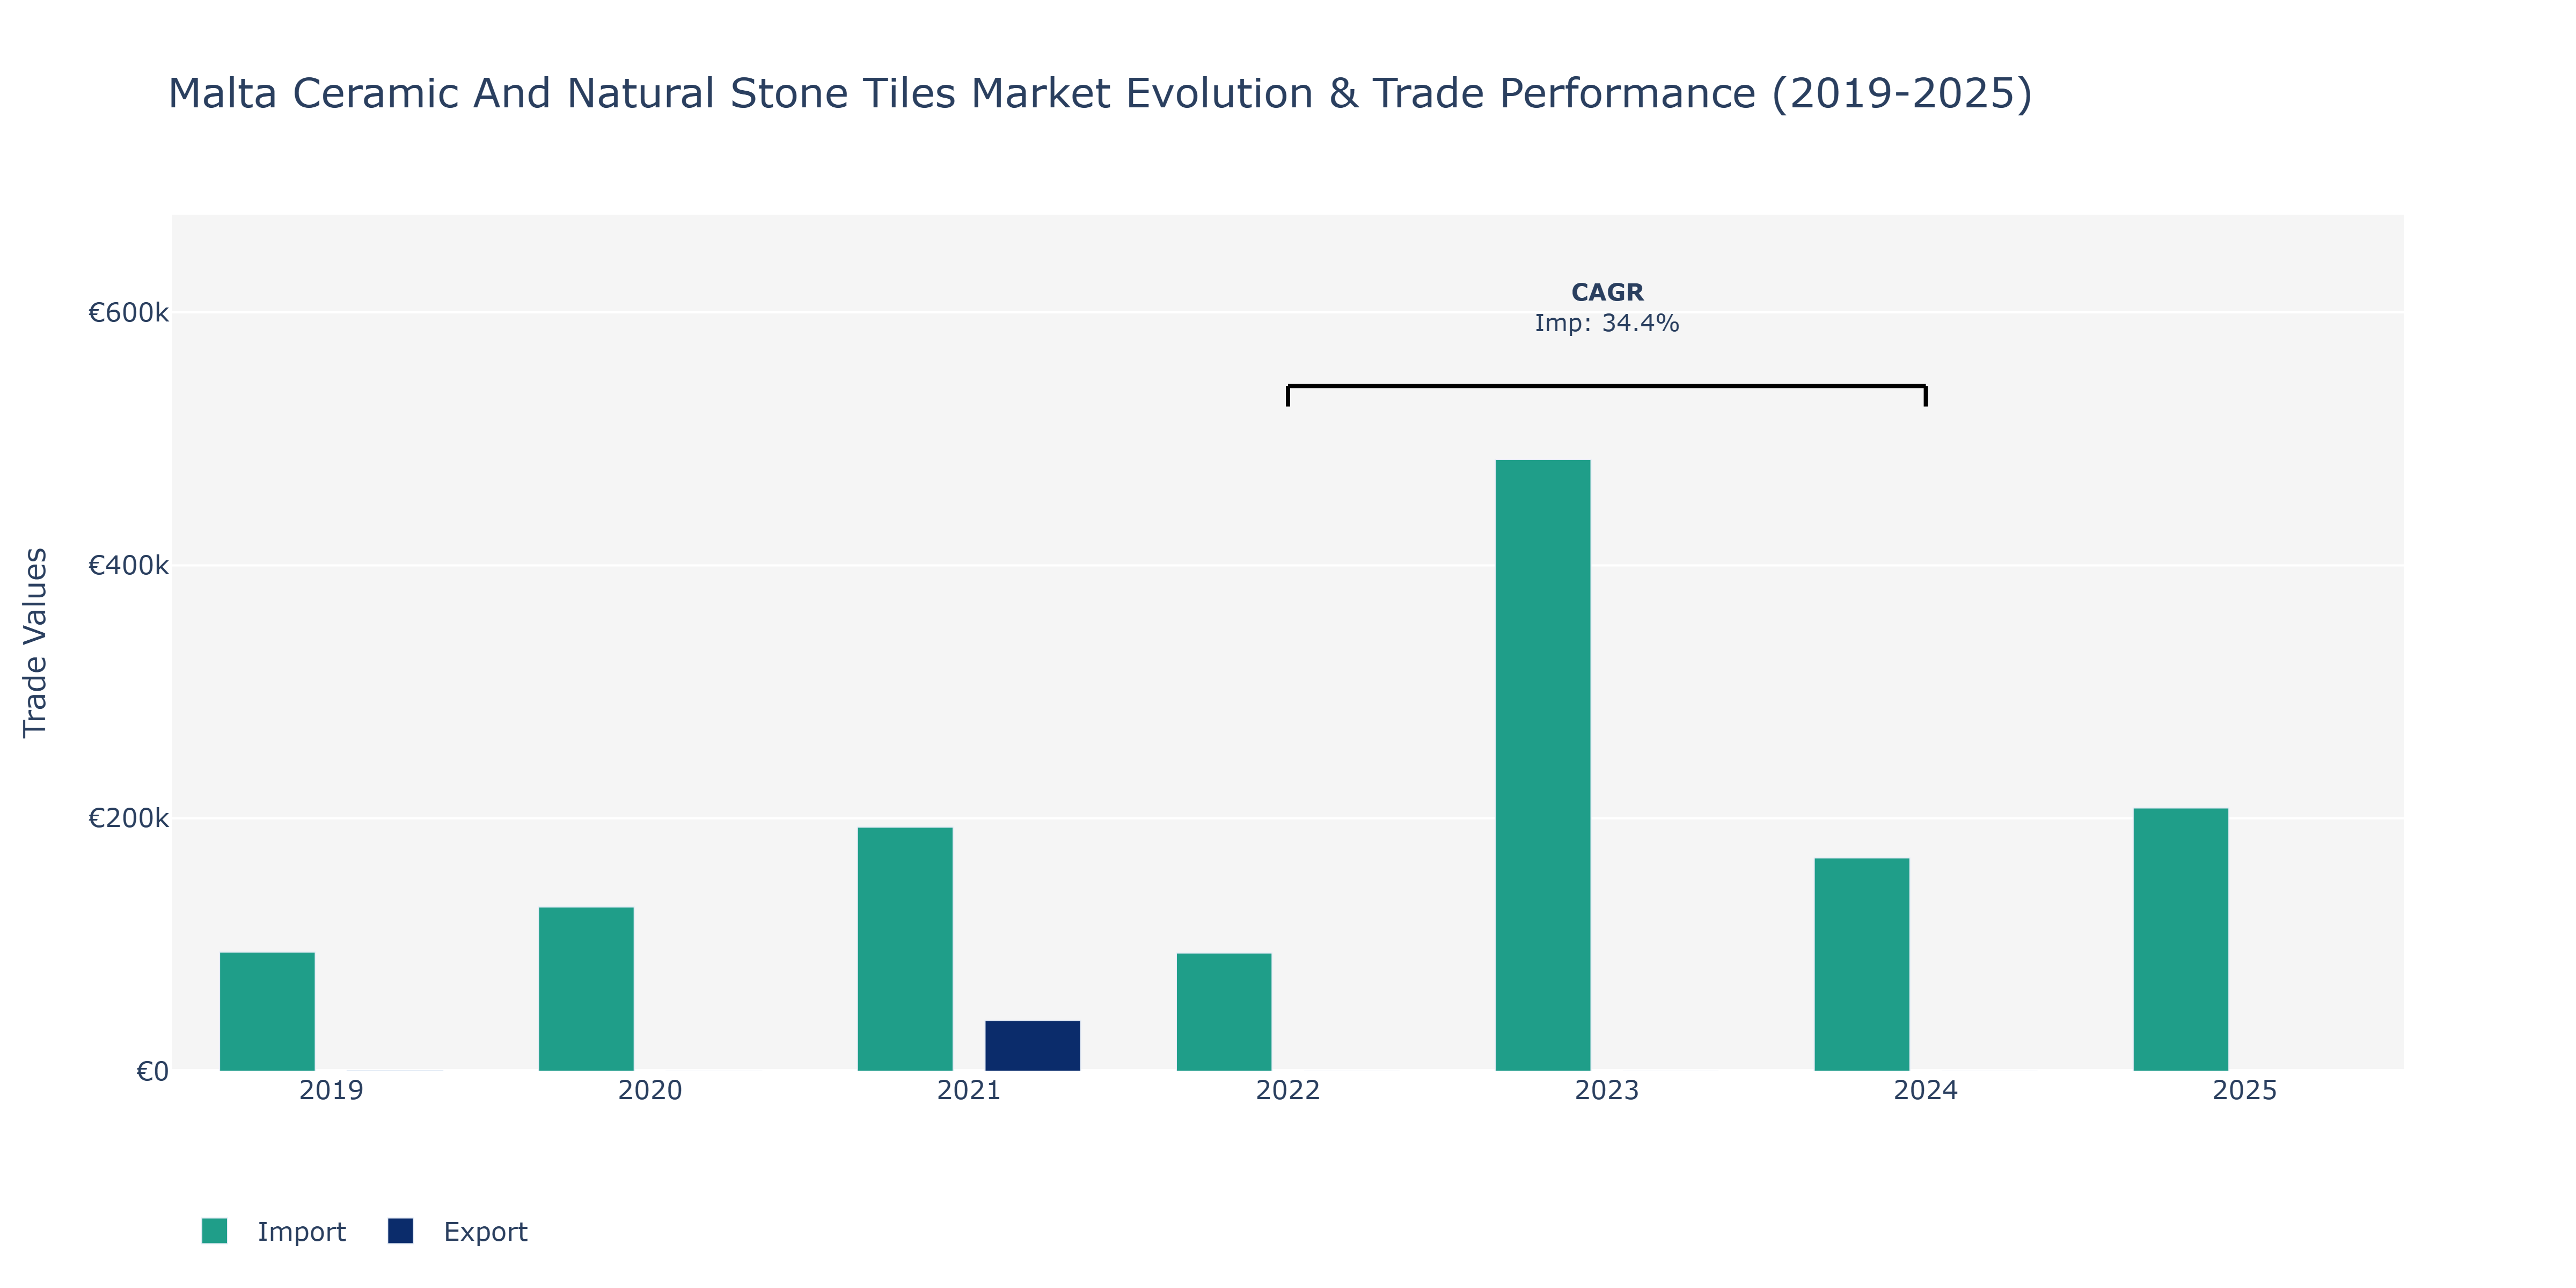
Between 2019 and 2021, the Malta Ceramic and Natural Stone Tiles Market witnessed a sharp contrast in exports and imports. In 2019, exports stood at €540 million, but dropped significantly to €22 million in 2020 before rebounding to €40.1 thousand in 2021. On the other hand, imports followed a different trajectory, starting at €94.24 thousand in 2019, soaring to €192.94 thousand in 2021, and posting a noticeable increase in 2022 to €93.44 thousand. However, a slight decline was observed in 2024 to €168.72 thousand, followed by a modest increase to €208.12 thousand in 2025. The spike in imports can be attributed to increased construction activities and infrastructure projects, likely fueled by economic growth and urban development initiatives. The fluctuations in exports could be due to shifts in market demand, changes in trade agreements, or variations in production capacity. These trends underscore the market's sensitivity to economic conditions and consumer preferences, indicating opportunities for market players to adapt strategies accordingly.
Key Highlights of the Report:
- Malta Ceramic And Natural Stone Tiles Market Outlook
- Market Size of Malta Ceramic And Natural Stone Tiles Market, 2025
- Forecast of Malta Ceramic And Natural Stone Tiles Market, 2032
- Historical Data and Forecast of Malta Ceramic And Natural Stone Tiles Revenues & Volume for the Period 2022 - 2032
- Malta Ceramic And Natural Stone Tiles Market Trend Evolution
- Malta Ceramic And Natural Stone Tiles Market Drivers and Challenges
- Malta Ceramic And Natural Stone Tiles Price Trends
- Malta Ceramic And Natural Stone Tiles Porter's Five Forces
- Malta Ceramic And Natural Stone Tiles Industry Life Cycle
- Historical Data and Forecast of Malta Ceramic And Natural Stone Tiles Market Revenues & Volume By Product for the Period 2022 - 2032
- Historical Data and Forecast of Malta Ceramic And Natural Stone Tiles Market Revenues & Volume By Glazed ceramic tiles for the Period 2022 - 2032
- Historical Data and Forecast of Malta Ceramic And Natural Stone Tiles Market Revenues & Volume By Porcelain tiles for the Period 2022 - 2032
- Historical Data and Forecast of Malta Ceramic And Natural Stone Tiles Market Revenues & Volume By Scratch free ceramic tiles for the Period 2022 - 2032
- Historical Data and Forecast of Malta Ceramic And Natural Stone Tiles Market Revenues & Volume By Granite tiles for the Period 2022 - 2032
- Historical Data and Forecast of Malta Ceramic And Natural Stone Tiles Market Revenues & Volume By Limestone tiles for the Period 2022 - 2032
- Historical Data and Forecast of Malta Ceramic And Natural Stone Tiles Market Revenues & Volume By Travertine tiles for the Period 2022 - 2032
- Historical Data and Forecast of Malta Ceramic And Natural Stone Tiles Market Revenues & Volume By Others for the Period 2022 - 2032
- Malta Ceramic And Natural Stone Tiles Import Export Trade Statistics
- Market Opportunity Assessment By Product
- Malta Ceramic And Natural Stone Tiles Top Companies Market Share
- Malta Ceramic And Natural Stone Tiles Competitive Benchmarking By Technical and Operational Parameters
- Malta Ceramic And Natural Stone Tiles Company Profiles
- Malta Ceramic And Natural Stone Tiles Key Strategic Recommendations
Frequently Asked Questions About the Market Study (FAQs):
6Wresearch actively monitors the Malta Ceramic And Natural Stone Tiles Market and publishes its comprehensive annual report, highlighting emerging trends, growth drivers, revenue analysis, and forecast outlook. Our insights help businesses to make data-backed strategic decisions with ongoing market dynamics. Our analysts track relevent industries related to the Malta Ceramic And Natural Stone Tiles Market, allowing our clients with actionable intelligence and reliable forecasts tailored to emerging regional needs.
Yes, we provide customisation as per your requirements. To learn more, feel free to contact us on sales@6wresearch.com
1 Executive Summary |
2 Introduction |
2.1 Key Highlights of the Report |
2.2 Report Description |
2.3 Market Scope & Segmentation |
2.4 Research Methodology |
2.5 Assumptions |
3 Malta Ceramic And Natural Stone Tiles Market Overview |
3.1 Malta Country Macro Economic Indicators |
3.2 Malta Ceramic And Natural Stone Tiles Market Revenues & Volume, 2022 & 2032F |
3.3 Malta Ceramic And Natural Stone Tiles Market - Industry Life Cycle |
3.4 Malta Ceramic And Natural Stone Tiles Market - Porter's Five Forces |
3.5 Malta Ceramic And Natural Stone Tiles Market Revenues & Volume Share, By Product, 2022 & 2032F |
4 Malta Ceramic And Natural Stone Tiles Market Dynamics |
4.1 Impact Analysis |
4.2 Market Drivers |
4.2.1 Growing demand for aesthetically pleasing and durable flooring solutions in residential and commercial construction projects. |
4.2.2 Increase in renovation and remodeling activities in the housing sector. |
4.2.3 Rising disposable income levels leading to higher spending on home improvement projects. |
4.3 Market Restraints |
4.3.1 Fluctuating raw material prices impacting production costs. |
4.3.2 Intense competition from alternative flooring materials like vinyl and laminate. |
4.3.3 Economic downturns affecting consumer spending on non-essential home improvement products. |
5 Malta Ceramic And Natural Stone Tiles Market Trends |
6 Malta Ceramic And Natural Stone Tiles Market, By Types |
6.1 Malta Ceramic And Natural Stone Tiles Market, By Product |
6.1.1 Overview and Analysis |
6.1.2 Malta Ceramic And Natural Stone Tiles Market Revenues & Volume, By Product, 2022 - 2032F |
6.1.3 Malta Ceramic And Natural Stone Tiles Market Revenues & Volume, By Glazed ceramic tiles, 2022 - 2032F |
6.1.4 Malta Ceramic And Natural Stone Tiles Market Revenues & Volume, By Porcelain tiles, 2022 - 2032F |
6.1.5 Malta Ceramic And Natural Stone Tiles Market Revenues & Volume, By Scratch free ceramic tiles, 2022 - 2032F |
6.1.6 Malta Ceramic And Natural Stone Tiles Market Revenues & Volume, By Granite tiles, 2022 - 2032F |
6.1.7 Malta Ceramic And Natural Stone Tiles Market Revenues & Volume, By Limestone tiles, 2022 - 2032F |
6.1.8 Malta Ceramic And Natural Stone Tiles Market Revenues & Volume, By Travertine tiles, 2022 - 2032F |
7 Malta Ceramic And Natural Stone Tiles Market Import-Export Trade Statistics |
7.1 Malta Ceramic And Natural Stone Tiles Market Export to Major Countries |
7.2 Malta Ceramic And Natural Stone Tiles Market Imports from Major Countries |
8 Malta Ceramic And Natural Stone Tiles Market Key Performance Indicators |
8.1 Average selling price per unit of ceramic and natural stone tiles. |
8.2 Percentage of market share within the premium tile segment. |
8.3 Number of new product launches and innovations in the market. |
8.4 Customer satisfaction levels based on feedback and reviews. |
8.5 Percentage of repeat customers indicating product loyalty. |
9 Malta Ceramic And Natural Stone Tiles Market - Opportunity Assessment |
9.1 Malta Ceramic And Natural Stone Tiles Market Opportunity Assessment, By Product, 2022 & 2032F |
10 Malta Ceramic And Natural Stone Tiles Market - Competitive Landscape |
10.1 Malta Ceramic And Natural Stone Tiles Market Revenue Share, By Companies, 2025 |
10.2 Malta Ceramic And Natural Stone Tiles Market Competitive Benchmarking, By Operating and Technical Parameters |
11 Company Profiles |
12 Recommendations |
13 Disclaimer |
Global Go To Market Strategy - 2030
Export potential enables firms to identify high-growth global markets with greater confidence by combining advanced trade intelligence with a structured quantitative methodology. The framework analyzes emerging demand trends and country-level import patterns while integrating macroeconomic and trade datasets such as GDP and population forecasts, bilateral import–export flows, tariff structures, elasticity differentials between developed and developing economies, geographic distance, and import demand projections. Using weighted trade values from 2020–2024 as the base period to project country-to-country export potential for 2030, these inputs are operationalized through calculated drivers such as gravity model parameters, tariff impact factors, and projected GDP per-capita growth. Through an analysis of hidden potentials, demand hotspots, and market conditions that are most favorable to success, this method enables firms to focus on target countries, maximize returns, and global expansion with data, backed by accuracy.
By factoring in the projected importer demand gap that is currently unmet and could be potential opportunity, it identifies the potential for the Exporter (Country) among 190 countries, against the general trade analysis, which identifies the biggest importer or exporter.
To discover high-growth global markets and optimize your business strategy:
Click Here
Pricing
- Single User License$ 1,995
- Department License$ 2,400
- Site License$ 3,120
- Global License$ 3,795

Leadership Perspectives from Industry Events
Search
Thought Leadership and Analyst Meet


Our Clients
6WResearch In News
- India Export Attractiveness Tracker 2026
- India Air Conditioner Market Set for Strong Rebound in 2026 After Weather-Led Correction and GST-Driven Recovery: 6Wresearch
- ADAS in India: How Automatic Emergency Braking, Blind Spot Detection & Driver Monitoring are Transforming Road Safety
- Doha a strategic location for EV manufacturing hub: IPA Qatar
- Demand for luxury TVs surging in the GCC, says Samsung
- Empowering Growth: The Thriving Journey of Bangladesh’s Cable Industry
Latest Reports
- Qatar Access and Home Network Market (2026-2032)
- Nicaragua RPG Gaming Market (2026-2032)
- New Zealand RPG Gaming Market (2026-2032)
- Netherlands RPG Gaming Market (2026-2032)
- Nauru RPG Gaming Market (2026-2032)
- Namibia RPG Gaming Market (2026-2032)
- Mozambique RPG Gaming Market (2026-2032)
- Montenegro RPG Gaming Market (2026-2032)
- Mongolia RPG Gaming Market (2026-2032)
- Monaco RPG Gaming Market (2026-2032)
Industry Events and Analyst Meet

EV India Expo 2026

HIMTEX 2026

India Refining Summit 2026

India EV Show 2026

EV tech India Expo 2026
Whitepaper
- Middle East & Africa Commercial Security Market Click here to view more.
- Middle East & Africa Fire Safety Systems & Equipment Market Click here to view more.
- GCC Drone Market Click here to view more.
- Middle East Lighting Fixture Market Click here to view more.
- GCC Physical & Perimeter Security Market Click here to view more.