Malta Ceramic Frit Market (2025-2031) | Size, Revenue, Trends, Value, Analysis, Industry, Forecast, Segmentation, Companies, Share, Outlook & Growth
Market Forecast By Type (Alkaline-boron Frit, Strontium-barium Frit, Zinc Frit, Magnesium Frit, Lithium Frit, Zinc Free Calcium Frit, Boron Free Frit), By Application (Glass And Decorative Glass, Abrasives & Refractories, Pottery Wares, Solar Panels, Sanitary Ware, Automotive) And Competitive Landscape
| Product Code: ETC5256092 | Publication Date: Nov 2023 | Updated Date: Apr 2026 | Product Type: Market Research Report | |
| Publisher: 6Wresearch | Author: Ravi Bhandari | No. of Pages: 60 | No. of Figures: 30 | No. of Tables: 5 |
Malta Ceramic Frit Market Size (2020-2030)
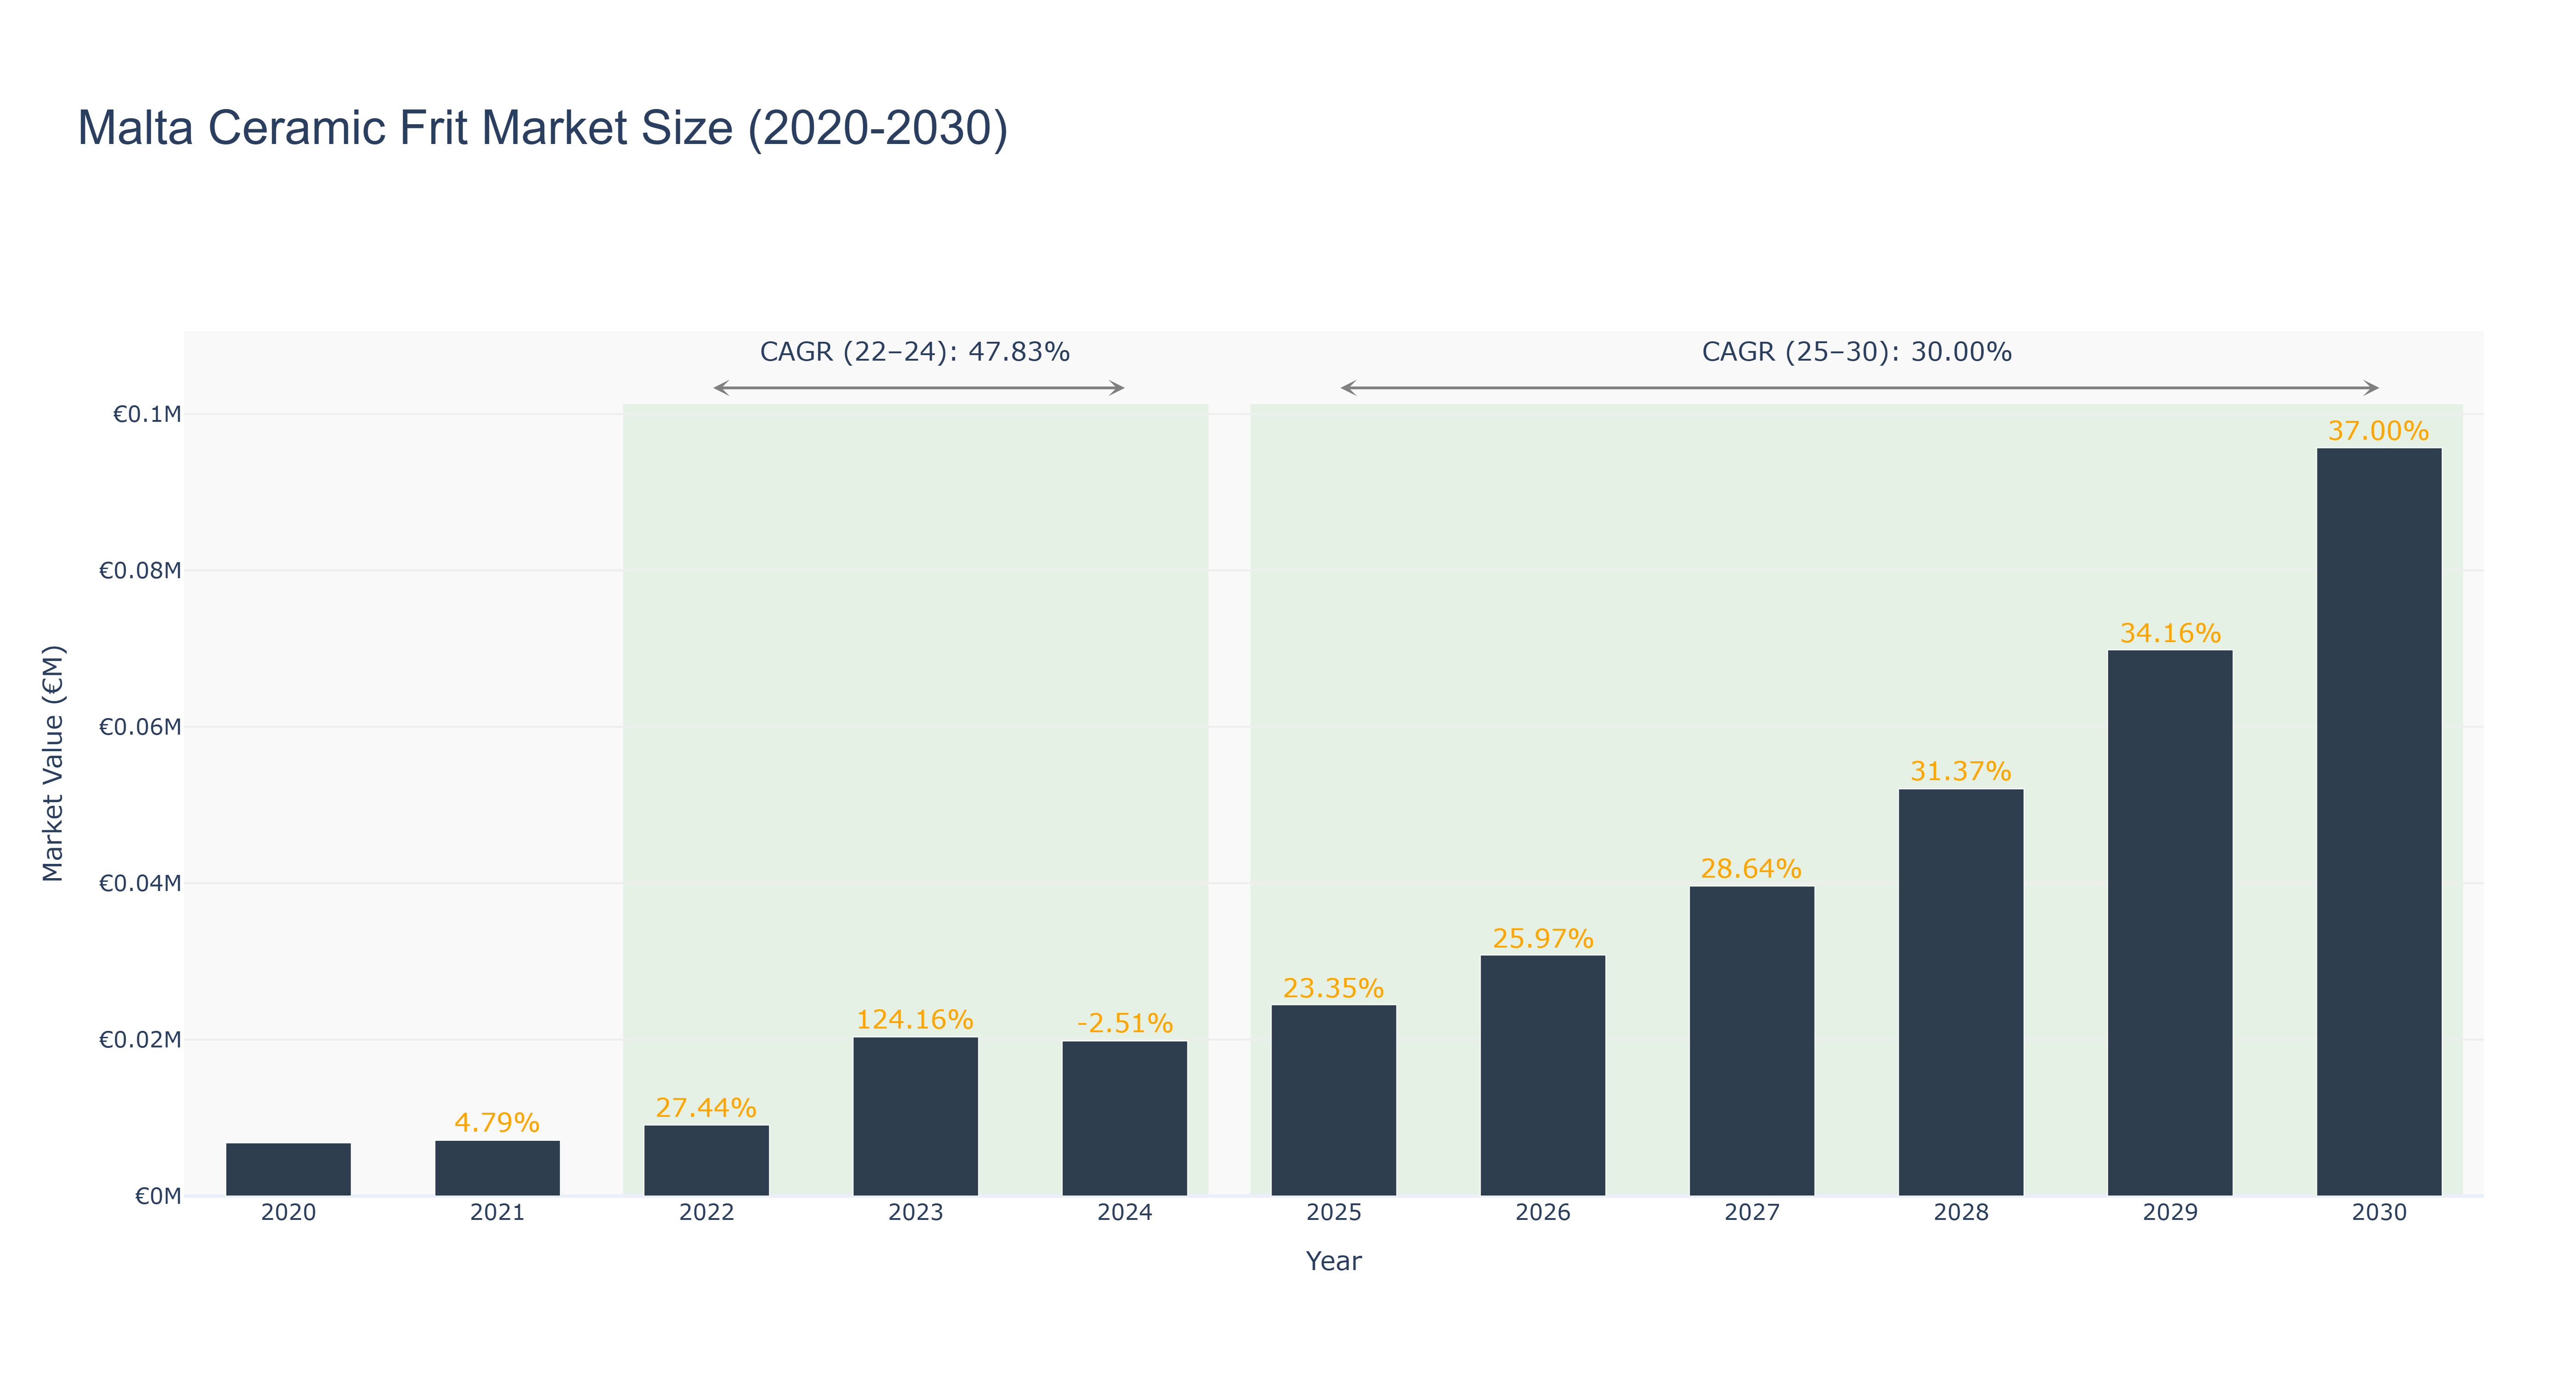
Malta Ceramic Frit Market has shown a steady growth trajectory over the years. The peak market size of €0.10 million was achieved in 2030, with a notable increase in market size from 2020 to 2030. The market experienced fluctuations, with a significant growth of 124.16% in 2023, followed by a slight decrease of -2.51% in 2024. The forecasted market size from 2025 to 2030 shows a consistent upward trend, with a CAGR of 30.0% from 2025 to 2030. The industry drivers behind this growth include increasing demand for ceramic frit products in construction and automotive sectors. Looking ahead, Malta is set to witness advancements in ceramic frit technology, with upcoming projects focusing on sustainable and innovative solutions to meet evolving market needs.
Malta Ceramic Frit Market: Production & Trade Performance (2019-2025)
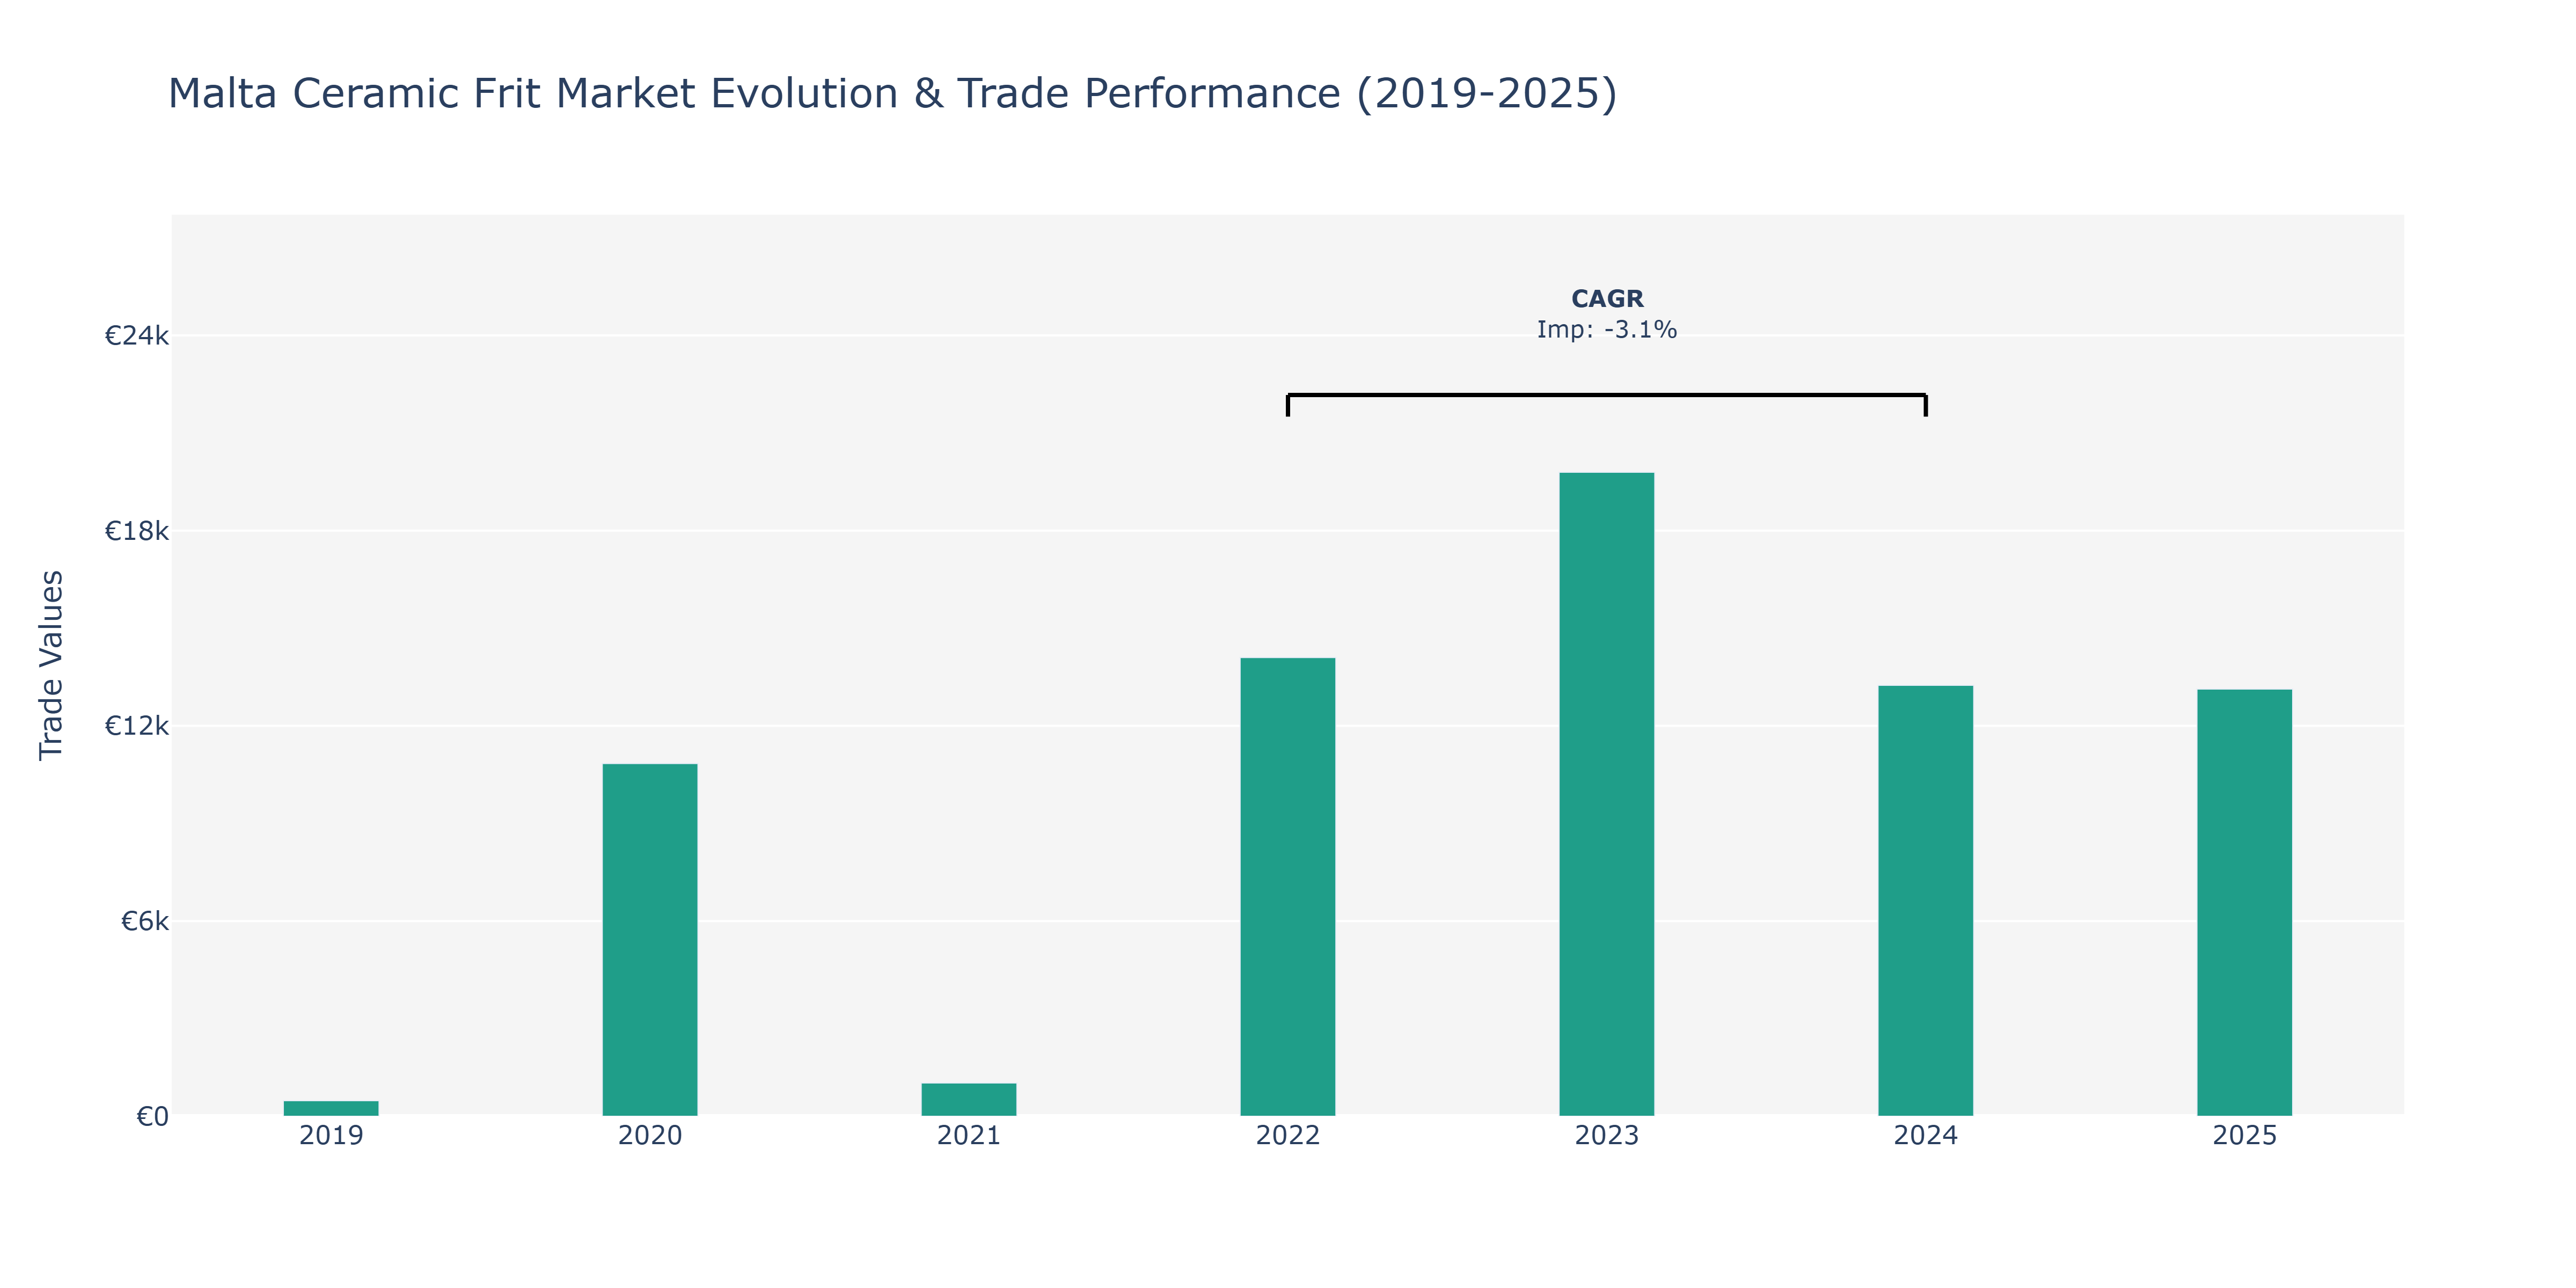
The imports of Malta Ceramic Frit experienced substantial fluctuations during the period under review. In 2019, imports stood at €480 million, marking the baseline for subsequent years. A significant surge was observed in 2020, with imports soaring to €10.84 thousand, reflecting a remarkable increase driven by potentially increased demand or supply chain dynamics. However, this peak was followed by a sharp decline in 2021 to €1.02 thousand, suggesting a possible correction or market stabilization. The trend reversed again in 2022, reaching €14.1 thousand and continued to rise in 2023 to €19.79 thousand before decreasing to €13.24 thousand in 2024. The year 2025 saw a slight decrease to €13.13 thousand. These fluctuations could be attributed to various factors such as changing consumer preferences, global economic conditions, or shifts in production capabilities. The market's resilience to these fluctuations indicates a dynamic landscape that players in the Malta Ceramic Frit industry need to navigate adeptly to capitalize on emerging opportunities.
Key Highlights of the Report:
- Malta Ceramic Frit Market Outlook
- Market Size of Malta Ceramic Frit Market, 2024
- Forecast of Malta Ceramic Frit Market, 2031
- Historical Data and Forecast of Malta Ceramic Frit Revenues & Volume for the Period 2021-2031
- Malta Ceramic Frit Market Trend Evolution
- Malta Ceramic Frit Market Drivers and Challenges
- Malta Ceramic Frit Price Trends
- Malta Ceramic Frit Porter`s Five Forces
- Malta Ceramic Frit Industry Life Cycle
- Historical Data and Forecast of Malta Ceramic Frit Market Revenues & Volume By Type for the Period 2021-2031
- Historical Data and Forecast of Malta Ceramic Frit Market Revenues & Volume By Alkaline-boron Frit for the Period 2021-2031
- Historical Data and Forecast of Malta Ceramic Frit Market Revenues & Volume By Strontium-barium Frit for the Period 2021-2031
- Historical Data and Forecast of Malta Ceramic Frit Market Revenues & Volume By Zinc Frit for the Period 2021-2031
- Historical Data and Forecast of Malta Ceramic Frit Market Revenues & Volume By Magnesium Frit for the Period 2021-2031
- Historical Data and Forecast of Malta Ceramic Frit Market Revenues & Volume By Lithium Frit for the Period 2021-2031
- Historical Data and Forecast of Malta Ceramic Frit Market Revenues & Volume By Zinc Free Calcium Frit for the Period 2021-2031
- Historical Data and Forecast of Malta Ceramic Frit Market Revenues & Volume By Boron Free Frit for the Period 2021-2031
- Historical Data and Forecast of Malta Ceramic Frit Market Revenues & Volume By Application for the Period 2021-2031
- Historical Data and Forecast of Malta Ceramic Frit Market Revenues & Volume By Glass And Decorative Glass for the Period 2021-2031
- Historical Data and Forecast of Malta Ceramic Frit Market Revenues & Volume By Abrasives & Refractories for the Period 2021-2031
- Historical Data and Forecast of Malta Ceramic Frit Market Revenues & Volume By Pottery Wares for the Period 2021-2031
- Historical Data and Forecast of Malta Ceramic Frit Market Revenues & Volume By Solar Panels for the Period 2021-2031
- Historical Data and Forecast of Malta Ceramic Frit Market Revenues & Volume By Sanitary Ware for the Period 2021-2031
- Historical Data and Forecast of Malta Ceramic Frit Market Revenues & Volume By Automotive for the Period 2021-2031
- Malta Ceramic Frit Import Export Trade Statistics
- Market Opportunity Assessment By Type
- Market Opportunity Assessment By Application
- Malta Ceramic Frit Top Companies Market Share
- Malta Ceramic Frit Competitive Benchmarking By Technical and Operational Parameters
- Malta Ceramic Frit Company Profiles
- Malta Ceramic Frit Key Strategic Recommendations
Frequently Asked Questions About the Market Study (FAQs):
6Wresearch actively monitors the Malta Ceramic Frit Market and publishes its comprehensive annual report, highlighting emerging trends, growth drivers, revenue analysis, and forecast outlook. Our insights help businesses to make data-backed strategic decisions with ongoing market dynamics. Our analysts track relevent industries related to the Malta Ceramic Frit Market, allowing our clients with actionable intelligence and reliable forecasts tailored to emerging regional needs.
Yes, we provide customisation as per your requirements. To learn more, feel free to contact us on sales@6wresearch.com
1 Executive Summary |
2 Introduction |
2.1 Key Highlights of the Report |
2.2 Report Description |
2.3 Market Scope & Segmentation |
2.4 Research Methodology |
2.5 Assumptions |
3 Malta Ceramic Frit Market Overview |
3.1 Malta Country Macro Economic Indicators |
3.2 Malta Ceramic Frit Market Revenues & Volume, 2021 & 2031F |
3.3 Malta Ceramic Frit Market - Industry Life Cycle |
3.4 Malta Ceramic Frit Market - Porter's Five Forces |
3.5 Malta Ceramic Frit Market Revenues & Volume Share, By Type, 2021 & 2031F |
3.6 Malta Ceramic Frit Market Revenues & Volume Share, By Application, 2021 & 2031F |
4 Malta Ceramic Frit Market Dynamics |
4.1 Impact Analysis |
4.2 Market Drivers |
4.2.1 Growing demand for ceramic tiles in the construction industry. |
4.2.2 Increasing use of ceramic frit in the automotive sector for glass printing applications. |
4.2.3 Technological advancements leading to improved quality and design capabilities of ceramic frit products. |
4.3 Market Restraints |
4.3.1 Fluctuating raw material prices impacting production costs. |
4.3.2 Intense competition from alternative materials such as digital printing technologies in the ceramic industry. |
5 Malta Ceramic Frit Market Trends |
6 Malta Ceramic Frit Market Segmentations |
6.1 Malta Ceramic Frit Market, By Type |
6.1.1 Overview and Analysis |
6.1.2 Malta Ceramic Frit Market Revenues & Volume, By Alkaline-boron Frit, 2021-2031F |
6.1.3 Malta Ceramic Frit Market Revenues & Volume, By Strontium-barium Frit, 2021-2031F |
6.1.4 Malta Ceramic Frit Market Revenues & Volume, By Zinc Frit, 2021-2031F |
6.1.5 Malta Ceramic Frit Market Revenues & Volume, By Magnesium Frit, 2021-2031F |
6.1.6 Malta Ceramic Frit Market Revenues & Volume, By Lithium Frit, 2021-2031F |
6.1.7 Malta Ceramic Frit Market Revenues & Volume, By Zinc Free Calcium Frit, 2021-2031F |
6.2 Malta Ceramic Frit Market, By Application |
6.2.1 Overview and Analysis |
6.2.2 Malta Ceramic Frit Market Revenues & Volume, By Glass And Decorative Glass, 2021-2031F |
6.2.3 Malta Ceramic Frit Market Revenues & Volume, By Abrasives & Refractories, 2021-2031F |
6.2.4 Malta Ceramic Frit Market Revenues & Volume, By Pottery Wares, 2021-2031F |
6.2.5 Malta Ceramic Frit Market Revenues & Volume, By Solar Panels, 2021-2031F |
6.2.6 Malta Ceramic Frit Market Revenues & Volume, By Sanitary Ware, 2021-2031F |
6.2.7 Malta Ceramic Frit Market Revenues & Volume, By Automotive, 2021-2031F |
7 Malta Ceramic Frit Market Import-Export Trade Statistics |
7.1 Malta Ceramic Frit Market Export to Major Countries |
7.2 Malta Ceramic Frit Market Imports from Major Countries |
8 Malta Ceramic Frit Market Key Performance Indicators |
8.1 Percentage of market penetration in the construction industry. |
8.2 Research and development investment in new ceramic frit technologies. |
8.3 Number of patents filed for innovative ceramic frit products. |
8.4 Percentage of repeat customers indicating product satisfaction and loyalty. |
8.5 Environmental sustainability certifications obtained for ceramic frit production processes. |
9 Malta Ceramic Frit Market - Opportunity Assessment |
9.1 Malta Ceramic Frit Market Opportunity Assessment, By Type, 2021 & 2031F |
9.2 Malta Ceramic Frit Market Opportunity Assessment, By Application, 2021 & 2031F |
10 Malta Ceramic Frit Market - Competitive Landscape |
10.1 Malta Ceramic Frit Market Revenue Share, By Companies, 2024 |
10.2 Malta Ceramic Frit Market Competitive Benchmarking, By Operating and Technical Parameters |
11 Company Profiles |
12 Recommendations | 13 Disclaimer |
Global Go To Market Strategy - 2030
Export potential enables firms to identify high-growth global markets with greater confidence by combining advanced trade intelligence with a structured quantitative methodology. The framework analyzes emerging demand trends and country-level import patterns while integrating macroeconomic and trade datasets such as GDP and population forecasts, bilateral import–export flows, tariff structures, elasticity differentials between developed and developing economies, geographic distance, and import demand projections. Using weighted trade values from 2020–2024 as the base period to project country-to-country export potential for 2030, these inputs are operationalized through calculated drivers such as gravity model parameters, tariff impact factors, and projected GDP per-capita growth. Through an analysis of hidden potentials, demand hotspots, and market conditions that are most favorable to success, this method enables firms to focus on target countries, maximize returns, and global expansion with data, backed by accuracy.
By factoring in the projected importer demand gap that is currently unmet and could be potential opportunity, it identifies the potential for the Exporter (Country) among 190 countries, against the general trade analysis, which identifies the biggest importer or exporter.
To discover high-growth global markets and optimize your business strategy:
Click Here
Pricing
- Single User License$ 1,995
- Department License$ 2,400
- Site License$ 3,120
- Global License$ 3,795

Leadership Perspectives from Industry Events
Search
Thought Leadership and Analyst Meet


Our Clients
6WResearch In News
- India Export Attractiveness Tracker 2026
- India Air Conditioner Market Set for Strong Rebound in 2026 After Weather-Led Correction and GST-Driven Recovery: 6Wresearch
- ADAS in India: How Automatic Emergency Braking, Blind Spot Detection & Driver Monitoring are Transforming Road Safety
- Doha a strategic location for EV manufacturing hub: IPA Qatar
- Demand for luxury TVs surging in the GCC, says Samsung
- Empowering Growth: The Thriving Journey of Bangladesh’s Cable Industry
Latest Reports
- Qatar Access and Home Network Market (2026-2032)
- Nicaragua RPG Gaming Market (2026-2032)
- New Zealand RPG Gaming Market (2026-2032)
- Netherlands RPG Gaming Market (2026-2032)
- Nauru RPG Gaming Market (2026-2032)
- Namibia RPG Gaming Market (2026-2032)
- Mozambique RPG Gaming Market (2026-2032)
- Montenegro RPG Gaming Market (2026-2032)
- Mongolia RPG Gaming Market (2026-2032)
- Monaco RPG Gaming Market (2026-2032)
Industry Events and Analyst Meet

EV India Expo 2026

HIMTEX 2026

India Refining Summit 2026

India EV Show 2026

EV tech India Expo 2026
Whitepaper
- Middle East & Africa Commercial Security Market Click here to view more.
- Middle East & Africa Fire Safety Systems & Equipment Market Click here to view more.
- GCC Drone Market Click here to view more.
- Middle East Lighting Fixture Market Click here to view more.
- GCC Physical & Perimeter Security Market Click here to view more.