Malta Lecithin Market (2026-2032) | Industry, Segmentation, Analysis, Revenue, Trends, Outlook, Growth, Size, Companies, Share, Forecast & Value
Market Forecast By Source (Soy, Sunflower, Rapeseed, Others), By End-use (Convenience Food, Bakery, Confectionary, Pharmaceutical, Personal Care And Cosmetics, Animal Feed, Other Industrial), By Form (Liquid, Powder, Granules) And Competitive Landscape
| Product Code: ETC5359566 | Publication Date: Nov 2023 | Updated Date: Apr 2026 | Product Type: Market Research Report | |
| Publisher: 6Wresearch | Author: Ravi Bhandari | No. of Pages: 60 | No. of Figures: 30 | No. of Tables: 5 |
Malta Lecithin Market Size (2020-2030)
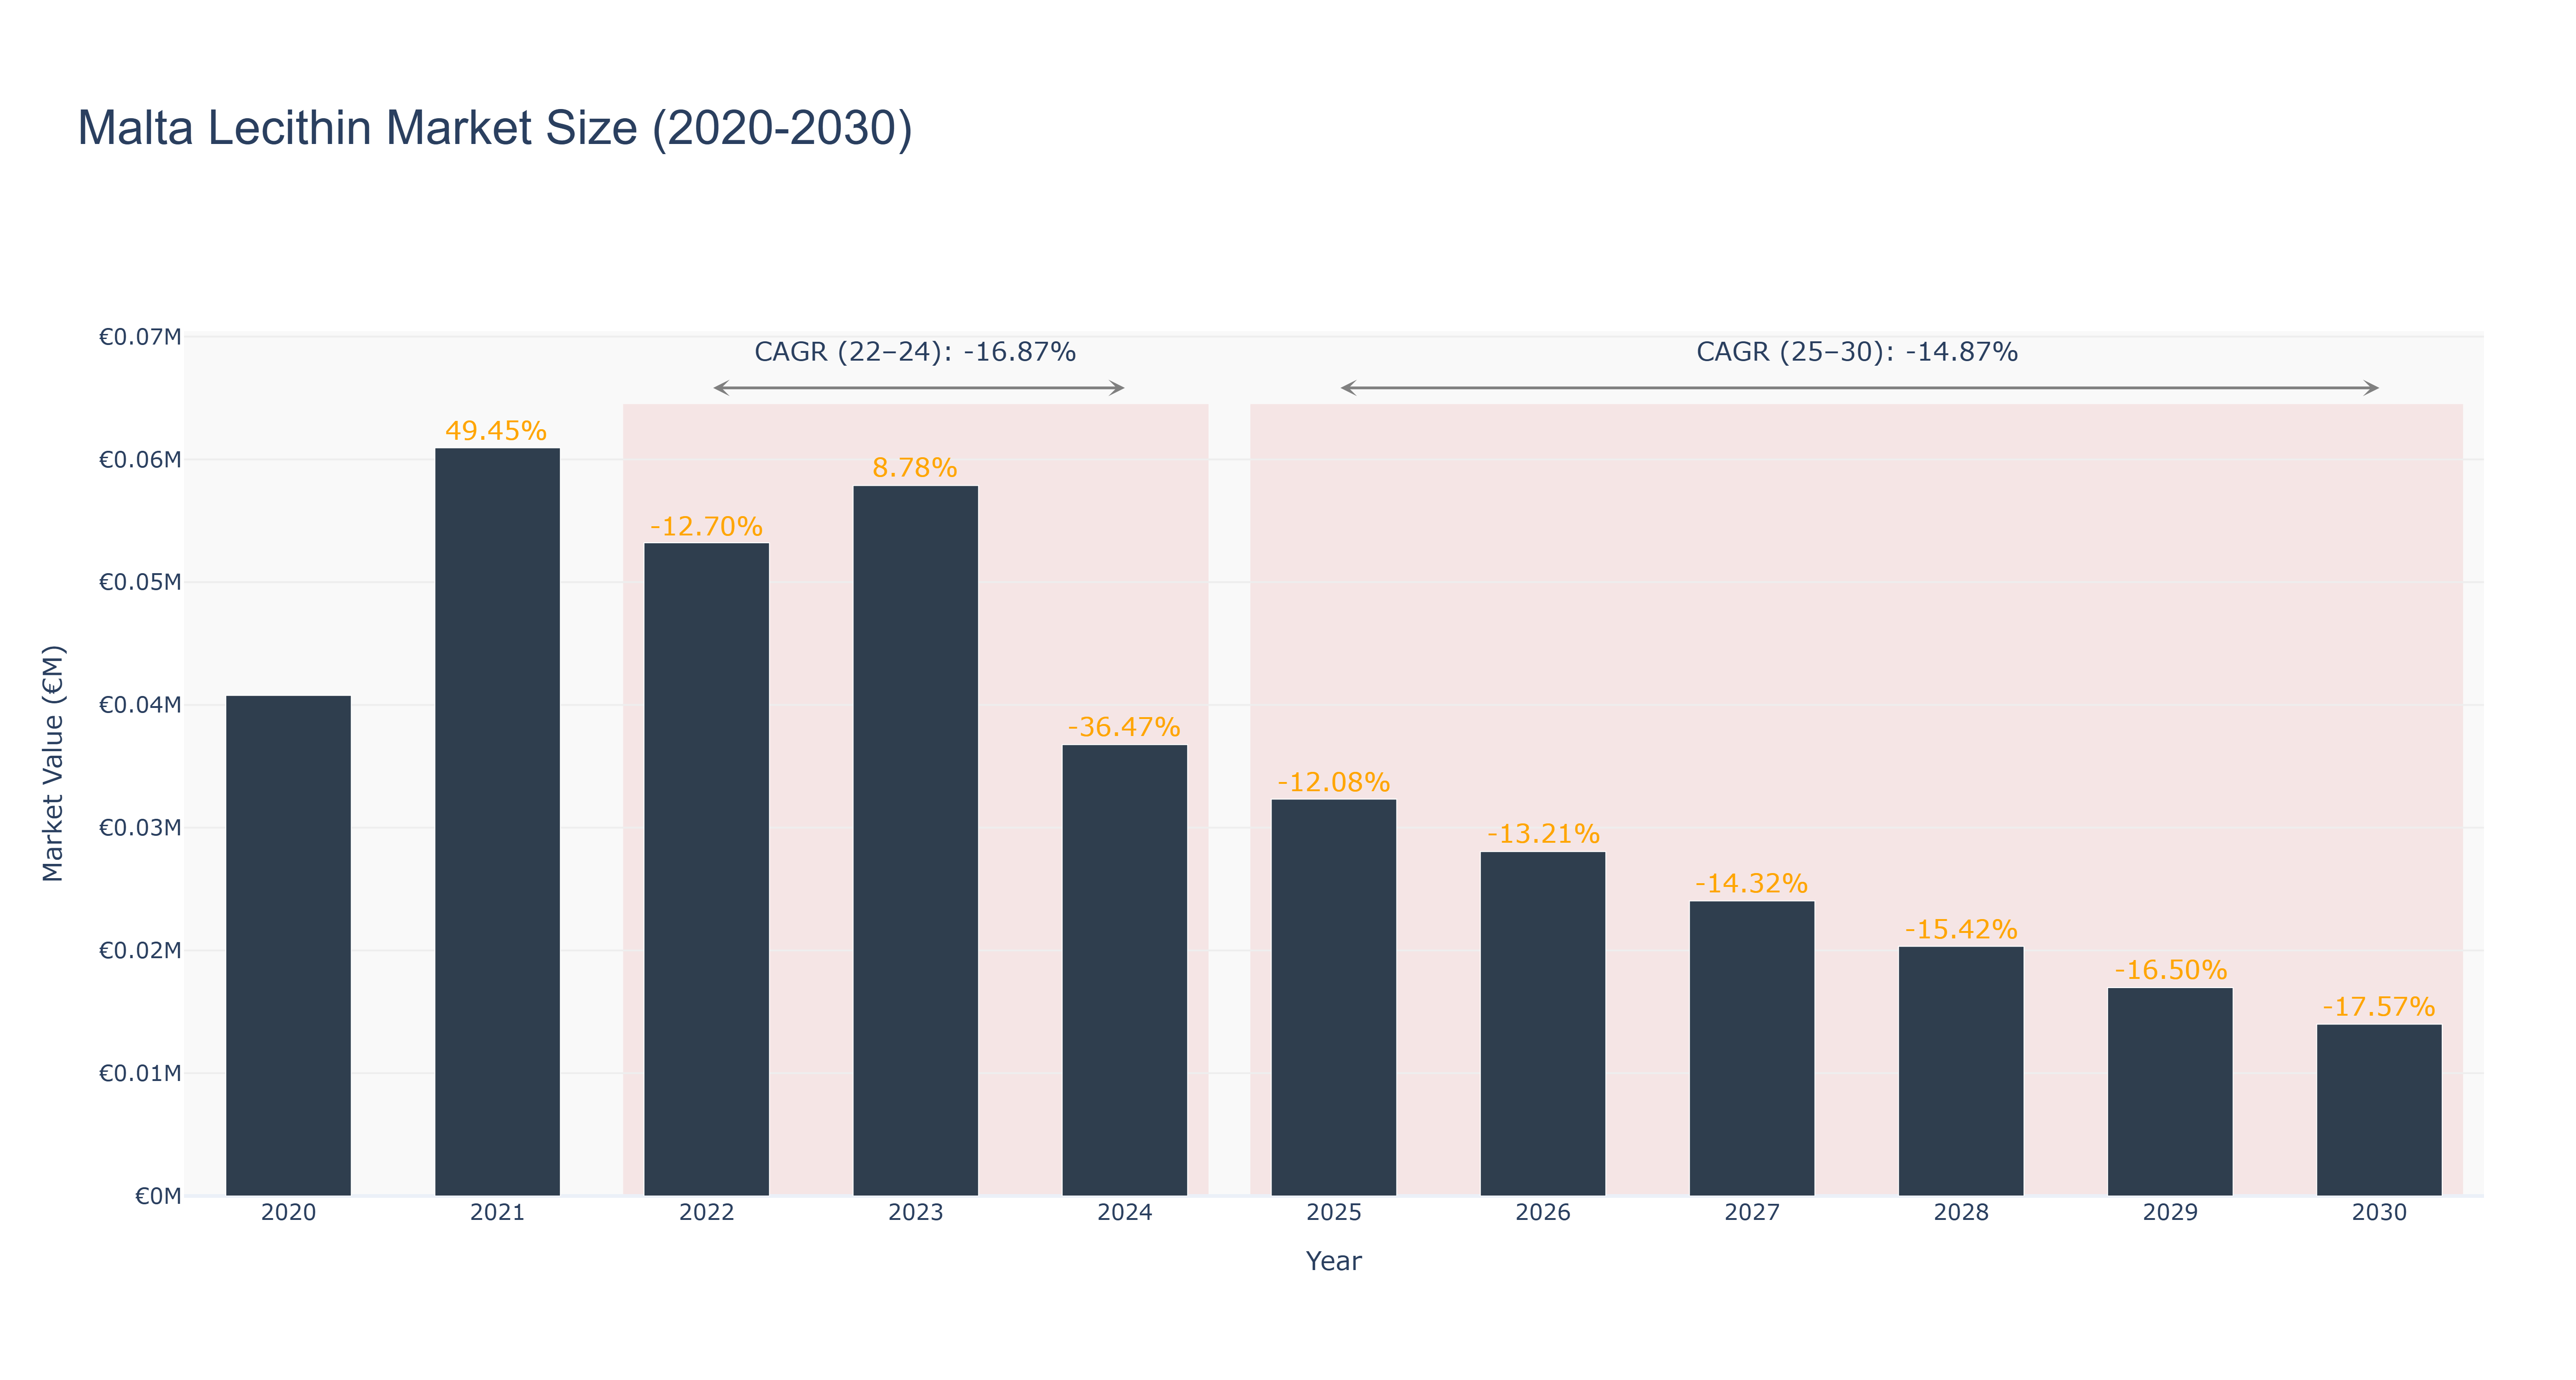
Malta Lecithin Market has shown a declining trend in market size over the years. The peak market size of €0.06 million was recorded in 2021, with a subsequent decrease to €0.03 million in 2025. Forecasted data indicates a further decrease to €0.01 million by 2030, with a CAGR of -14.87% from 2025 to 2030. The market experienced a significant downturn from 2024 onwards, attributed to factors like changing consumer preferences and increased competition. Looking ahead, the Malta Lecithin Market is expected to focus on product innovation and expanding into new market segments to counteract the declining trend. Recent developments in sustainable sourcing practices and technological advancements in extraction methods are anticipated to drive growth in the near future.
Malta Lecithin Market: Production & Trade Performance (2019-2025)
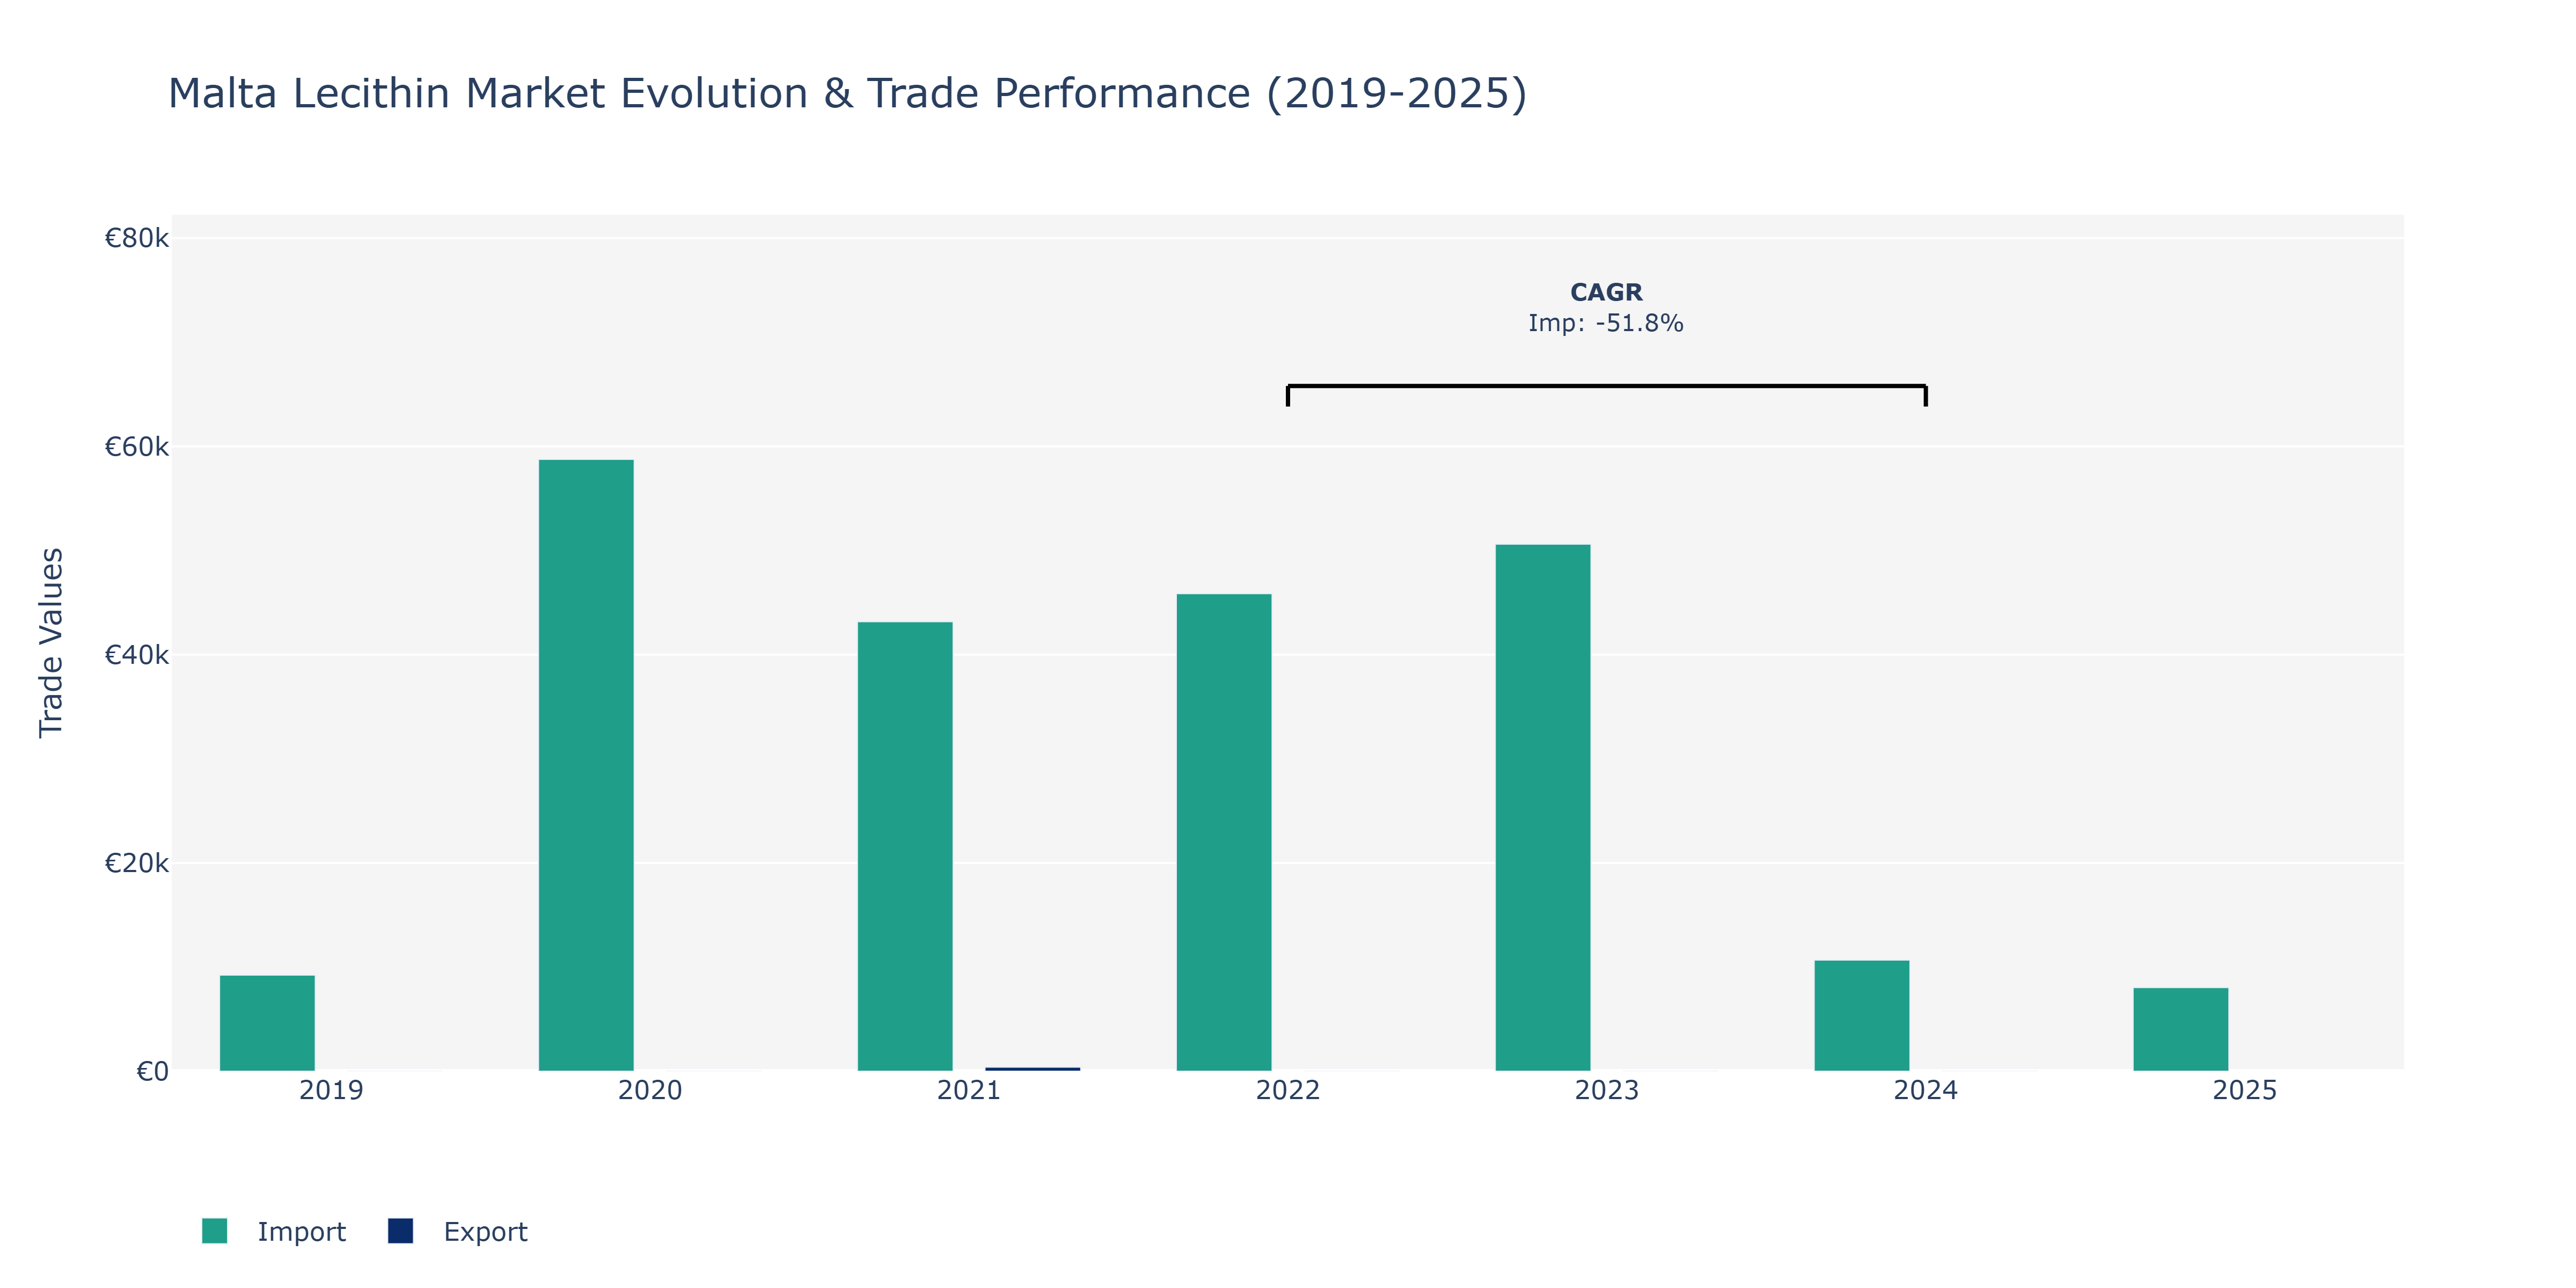
Between 2019 and 2025, the Malta Lecithin Market saw notable fluctuations in imports, ranging from €9.22 thousand in 2019 to a peak of €58.75 thousand in 2020, followed by a decrease to €10.67 thousand in 2024 and a further decline to €8.02 thousand in 2025. The market's dependency on imports suggests a reliance on external sources for lecithin products, potentially influenced by global market dynamics, changes in demand-supply scenarios, or fluctuations in trade regulations. The peak in 2020 could be attributed to various factors like increased demand, supply chain disruptions, or inventory stocking due to market uncertainties. The subsequent decline might reflect stabilization in demand or shifts in sourcing strategies by local manufacturers. To validate these assumptions, further analysis of market demand drivers and trade policies affecting lecithin imports in Malta would provide a deeper understanding of the market dynamics.
Key Highlights of the Report:
- Malta Lecithin Market Outlook
- Market Size of Malta Lecithin Market, 2025
- Forecast of Malta Lecithin Market, 2032
- Historical Data and Forecast of Malta Lecithin Revenues & Volume for the Period 2022 - 2032F
- Malta Lecithin Market Trend Evolution
- Malta Lecithin Market Drivers and Challenges
- Malta Lecithin Price Trends
- Malta Lecithin Porter`s Five Forces
- Malta Lecithin Industry Life Cycle
- Historical Data and Forecast of Malta Lecithin Market Revenues & Volume By Source for the Period 2022 - 2032F
- Historical Data and Forecast of Malta Lecithin Market Revenues & Volume By Soy for the Period 2022 - 2032F
- Historical Data and Forecast of Malta Lecithin Market Revenues & Volume By Sunflower for the Period 2022 - 2032F
- Historical Data and Forecast of Malta Lecithin Market Revenues & Volume By Rapeseed for the Period 2022 - 2032F
- Historical Data and Forecast of Malta Lecithin Market Revenues & Volume By Others for the Period 2022 - 2032F
- Historical Data and Forecast of Malta Lecithin Market Revenues & Volume By End-use for the Period 2022 - 2032F
- Historical Data and Forecast of Malta Lecithin Market Revenues & Volume By Convenience Food for the Period 2022 - 2032F
- Historical Data and Forecast of Malta Lecithin Market Revenues & Volume By Bakery for the Period 2022 - 2032F
- Historical Data and Forecast of Malta Lecithin Market Revenues & Volume By Confectionary for the Period 2022 - 2032F
- Historical Data and Forecast of Malta Lecithin Market Revenues & Volume By Pharmaceutical for the Period 2022 - 2032F
- Historical Data and Forecast of Malta Lecithin Market Revenues & Volume By Personal Care And Cosmetics for the Period 2022 - 2032F
- Historical Data and Forecast of Malta Lecithin Market Revenues & Volume By Animal Feed for the Period 2022 - 2032F
- Historical Data and Forecast of Malta Lecithin Market Revenues & Volume By Other Industrial for the Period 2022 - 2032F
- Historical Data and Forecast of Malta Lecithin Market Revenues & Volume By Form for the Period 2022 - 2032F
- Historical Data and Forecast of Malta Lecithin Market Revenues & Volume By Liquid for the Period 2022 - 2032F
- Historical Data and Forecast of Malta Lecithin Market Revenues & Volume By Powder for the Period 2022 - 2032F
- Historical Data and Forecast of Malta Lecithin Market Revenues & Volume By Granules for the Period 2022 - 2032F
- Malta Lecithin Import Export Trade Statistics
- Market Opportunity Assessment By Source
- Market Opportunity Assessment By End-use
- Market Opportunity Assessment By Form
- Malta Lecithin Top Companies Market Share
- Malta Lecithin Competitive Benchmarking By Technical and Operational Parameters
- Malta Lecithin Company Profiles
- Malta Lecithin Key Strategic Recommendations
Frequently Asked Questions About the Market Study (FAQs):
6Wresearch actively monitors the Malta Lecithin Market and publishes its comprehensive annual report, highlighting emerging trends, growth drivers, revenue analysis, and forecast outlook. Our insights help businesses to make data-backed strategic decisions with ongoing market dynamics. Our analysts track relevent industries related to the Malta Lecithin Market, allowing our clients with actionable intelligence and reliable forecasts tailored to emerging regional needs.
Yes, we provide customisation as per your requirements. To learn more, feel free to contact us on sales@6wresearch.com
1 Executive Summary |
2 Introduction |
2.1 Key Highlights of the Report |
2.2 Report Description |
2.3 Market Scope & Segmentation |
2.4 Research Methodology |
2.5 Assumptions |
3 Malta Lecithin Market Overview |
3.1 Malta Country Macro Economic Indicators |
3.2 Malta Lecithin Market Revenues & Volume, 2022 & 2032F |
3.3 Malta Lecithin Market - Industry Life Cycle |
3.4 Malta Lecithin Market - Porter's Five Forces |
3.5 Malta Lecithin Market Revenues & Volume Share, By Source, 2022 & 2032F |
3.6 Malta Lecithin Market Revenues & Volume Share, By End-use, 2022 & 2032F |
3.7 Malta Lecithin Market Revenues & Volume Share, By Form, 2022 & 2032F |
4 Malta Lecithin Market Dynamics |
4.1 Impact Analysis |
4.2 Market Drivers |
4.2.1 Increasing demand for natural and clean label ingredients in food and beverage industry |
4.2.2 Growing awareness about the health benefits of lecithin in improving brain function and cardiovascular health |
4.2.3 Rising adoption of lecithin in cosmetic and pharmaceutical industries for its emulsifying properties |
4.3 Market Restraints |
4.3.1 Fluctuating prices of raw materials such as soybeans, a primary source of lecithin |
4.3.2 Stringent regulations related to GMO labeling and sourcing of lecithin |
4.3.3 Competition from alternative emulsifiers and surfactants in various applications |
5 Malta Lecithin Market Trends |
6 Malta Lecithin Market Segmentations |
6.1 Malta Lecithin Market, By Source |
6.1.1 Overview and Analysis |
6.1.2 Malta Lecithin Market Revenues & Volume, By Soy, 2022 - 2032F |
6.1.3 Malta Lecithin Market Revenues & Volume, By Sunflower, 2022 - 2032F |
6.1.4 Malta Lecithin Market Revenues & Volume, By Rapeseed, 2022 - 2032F |
6.1.5 Malta Lecithin Market Revenues & Volume, By Others, 2022 - 2032F |
6.2 Malta Lecithin Market, By End-use |
6.2.1 Overview and Analysis |
6.2.2 Malta Lecithin Market Revenues & Volume, By Convenience Food, 2022 - 2032F |
6.2.3 Malta Lecithin Market Revenues & Volume, By Bakery, 2022 - 2032F |
6.2.4 Malta Lecithin Market Revenues & Volume, By Confectionary, 2022 - 2032F |
6.2.5 Malta Lecithin Market Revenues & Volume, By Pharmaceutical, 2022 - 2032F |
6.2.6 Malta Lecithin Market Revenues & Volume, By Personal Care And Cosmetics, 2022 - 2032F |
6.2.7 Malta Lecithin Market Revenues & Volume, By Animal Feed, 2022 - 2032F |
6.3 Malta Lecithin Market, By Form |
6.3.1 Overview and Analysis |
6.3.2 Malta Lecithin Market Revenues & Volume, By Liquid, 2022 - 2032F |
6.3.3 Malta Lecithin Market Revenues & Volume, By Powder, 2022 - 2032F |
6.3.4 Malta Lecithin Market Revenues & Volume, By Granules, 2022 - 2032F |
7 Malta Lecithin Market Import-Export Trade Statistics |
7.1 Malta Lecithin Market Export to Major Countries |
7.2 Malta Lecithin Market Imports from Major Countries |
8 Malta Lecithin Market Key Performance Indicators |
8.1 Number of new product launches containing malta lecithin |
8.2 Percentage increase in applications of malta lecithin in different industries |
8.3 Investment in research and development for innovative uses of malta lecithin |
9 Malta Lecithin Market - Opportunity Assessment |
9.1 Malta Lecithin Market Opportunity Assessment, By Source, 2022 & 2032F |
9.2 Malta Lecithin Market Opportunity Assessment, By End-use, 2022 & 2032F |
9.3 Malta Lecithin Market Opportunity Assessment, By Form, 2022 & 2032F |
10 Malta Lecithin Market - Competitive Landscape |
10.1 Malta Lecithin Market Revenue Share, By Companies, 2025 |
10.2 Malta Lecithin Market Competitive Benchmarking, By Operating and Technical Parameters |
11 Company Profiles |
12 Recommendations | 13 Disclaimer |
Global Go To Market Strategy - 2030
Export potential enables firms to identify high-growth global markets with greater confidence by combining advanced trade intelligence with a structured quantitative methodology. The framework analyzes emerging demand trends and country-level import patterns while integrating macroeconomic and trade datasets such as GDP and population forecasts, bilateral import–export flows, tariff structures, elasticity differentials between developed and developing economies, geographic distance, and import demand projections. Using weighted trade values from 2020–2024 as the base period to project country-to-country export potential for 2030, these inputs are operationalized through calculated drivers such as gravity model parameters, tariff impact factors, and projected GDP per-capita growth. Through an analysis of hidden potentials, demand hotspots, and market conditions that are most favorable to success, this method enables firms to focus on target countries, maximize returns, and global expansion with data, backed by accuracy.
By factoring in the projected importer demand gap that is currently unmet and could be potential opportunity, it identifies the potential for the Exporter (Country) among 190 countries, against the general trade analysis, which identifies the biggest importer or exporter.
To discover high-growth global markets and optimize your business strategy:
Click Here
Pricing
- Single User License$ 1,995
- Department License$ 2,400
- Site License$ 3,120
- Global License$ 3,795

Leadership Perspectives from Industry Events
Search
Thought Leadership and Analyst Meet


Our Clients
6WResearch In News
- Doha a strategic location for EV manufacturing hub: IPA Qatar
- Demand for luxury TVs surging in the GCC, says Samsung
- Empowering Growth: The Thriving Journey of Bangladesh’s Cable Industry
- Demand for luxury TVs surging in the GCC, says Samsung
- Video call with a traditional healer? Once unthinkable, it’s now common in South Africa
- Intelligent Buildings To Smooth GCC’s Path To Net Zero
Latest Reports
- Cape Verde Portable Hand-Thrown Extinguisher Market (2026-2032)
- Canada Portable Hand-Thrown Extinguisher Market (2026-2032)
- Cameroon Portable Hand-Thrown Extinguisher Market (2026-2032)
- Burundi Portable Hand-Thrown Extinguisher Market (2026-2032)
- Burkina Faso Portable Hand-Thrown Extinguisher Market (2026-2032)
- Bulgaria Portable Hand-Thrown Extinguisher Market (2026-2032)
- Brunei Portable Hand-Thrown Extinguisher Market (2026-2032)
- Botswana Portable Hand-Thrown Extinguisher Market (2026-2032)
- Bosnia and Herzegovina Portable Hand-Thrown Extinguisher Market (2026-2032)
- Bolivia Portable Hand-Thrown Extinguisher Market (2026-2032)
Industry Events and Analyst Meet

HIMTEX 2026

India Refining Summit 2026

India EV Show 2026

EV tech India Expo 2026

Auto Tech Asia 2026
Whitepaper
- Middle East & Africa Commercial Security Market Click here to view more.
- Middle East & Africa Fire Safety Systems & Equipment Market Click here to view more.
- GCC Drone Market Click here to view more.
- Middle East Lighting Fixture Market Click here to view more.
- GCC Physical & Perimeter Security Market Click here to view more.