Malta Optical Sorter Market (2026-2032) | Growth, Analysis, Size, Forecast, Revenue, Companies, Outlook, Trends, Industry, Segmentation, Value & Share
Market Forecast By Type (Hardware, Software), By End-user Industries (Food, Recycling, Mining, Other End-user Industries) And Competitive Landscape
| Product Code: ETC5574342 | Publication Date: Nov 2023 | Updated Date: Apr 2026 | Product Type: Market Research Report | |
| Publisher: 6Wresearch | Author: Ravi Bhandari | No. of Pages: 60 | No. of Figures: 30 | No. of Tables: 5 |
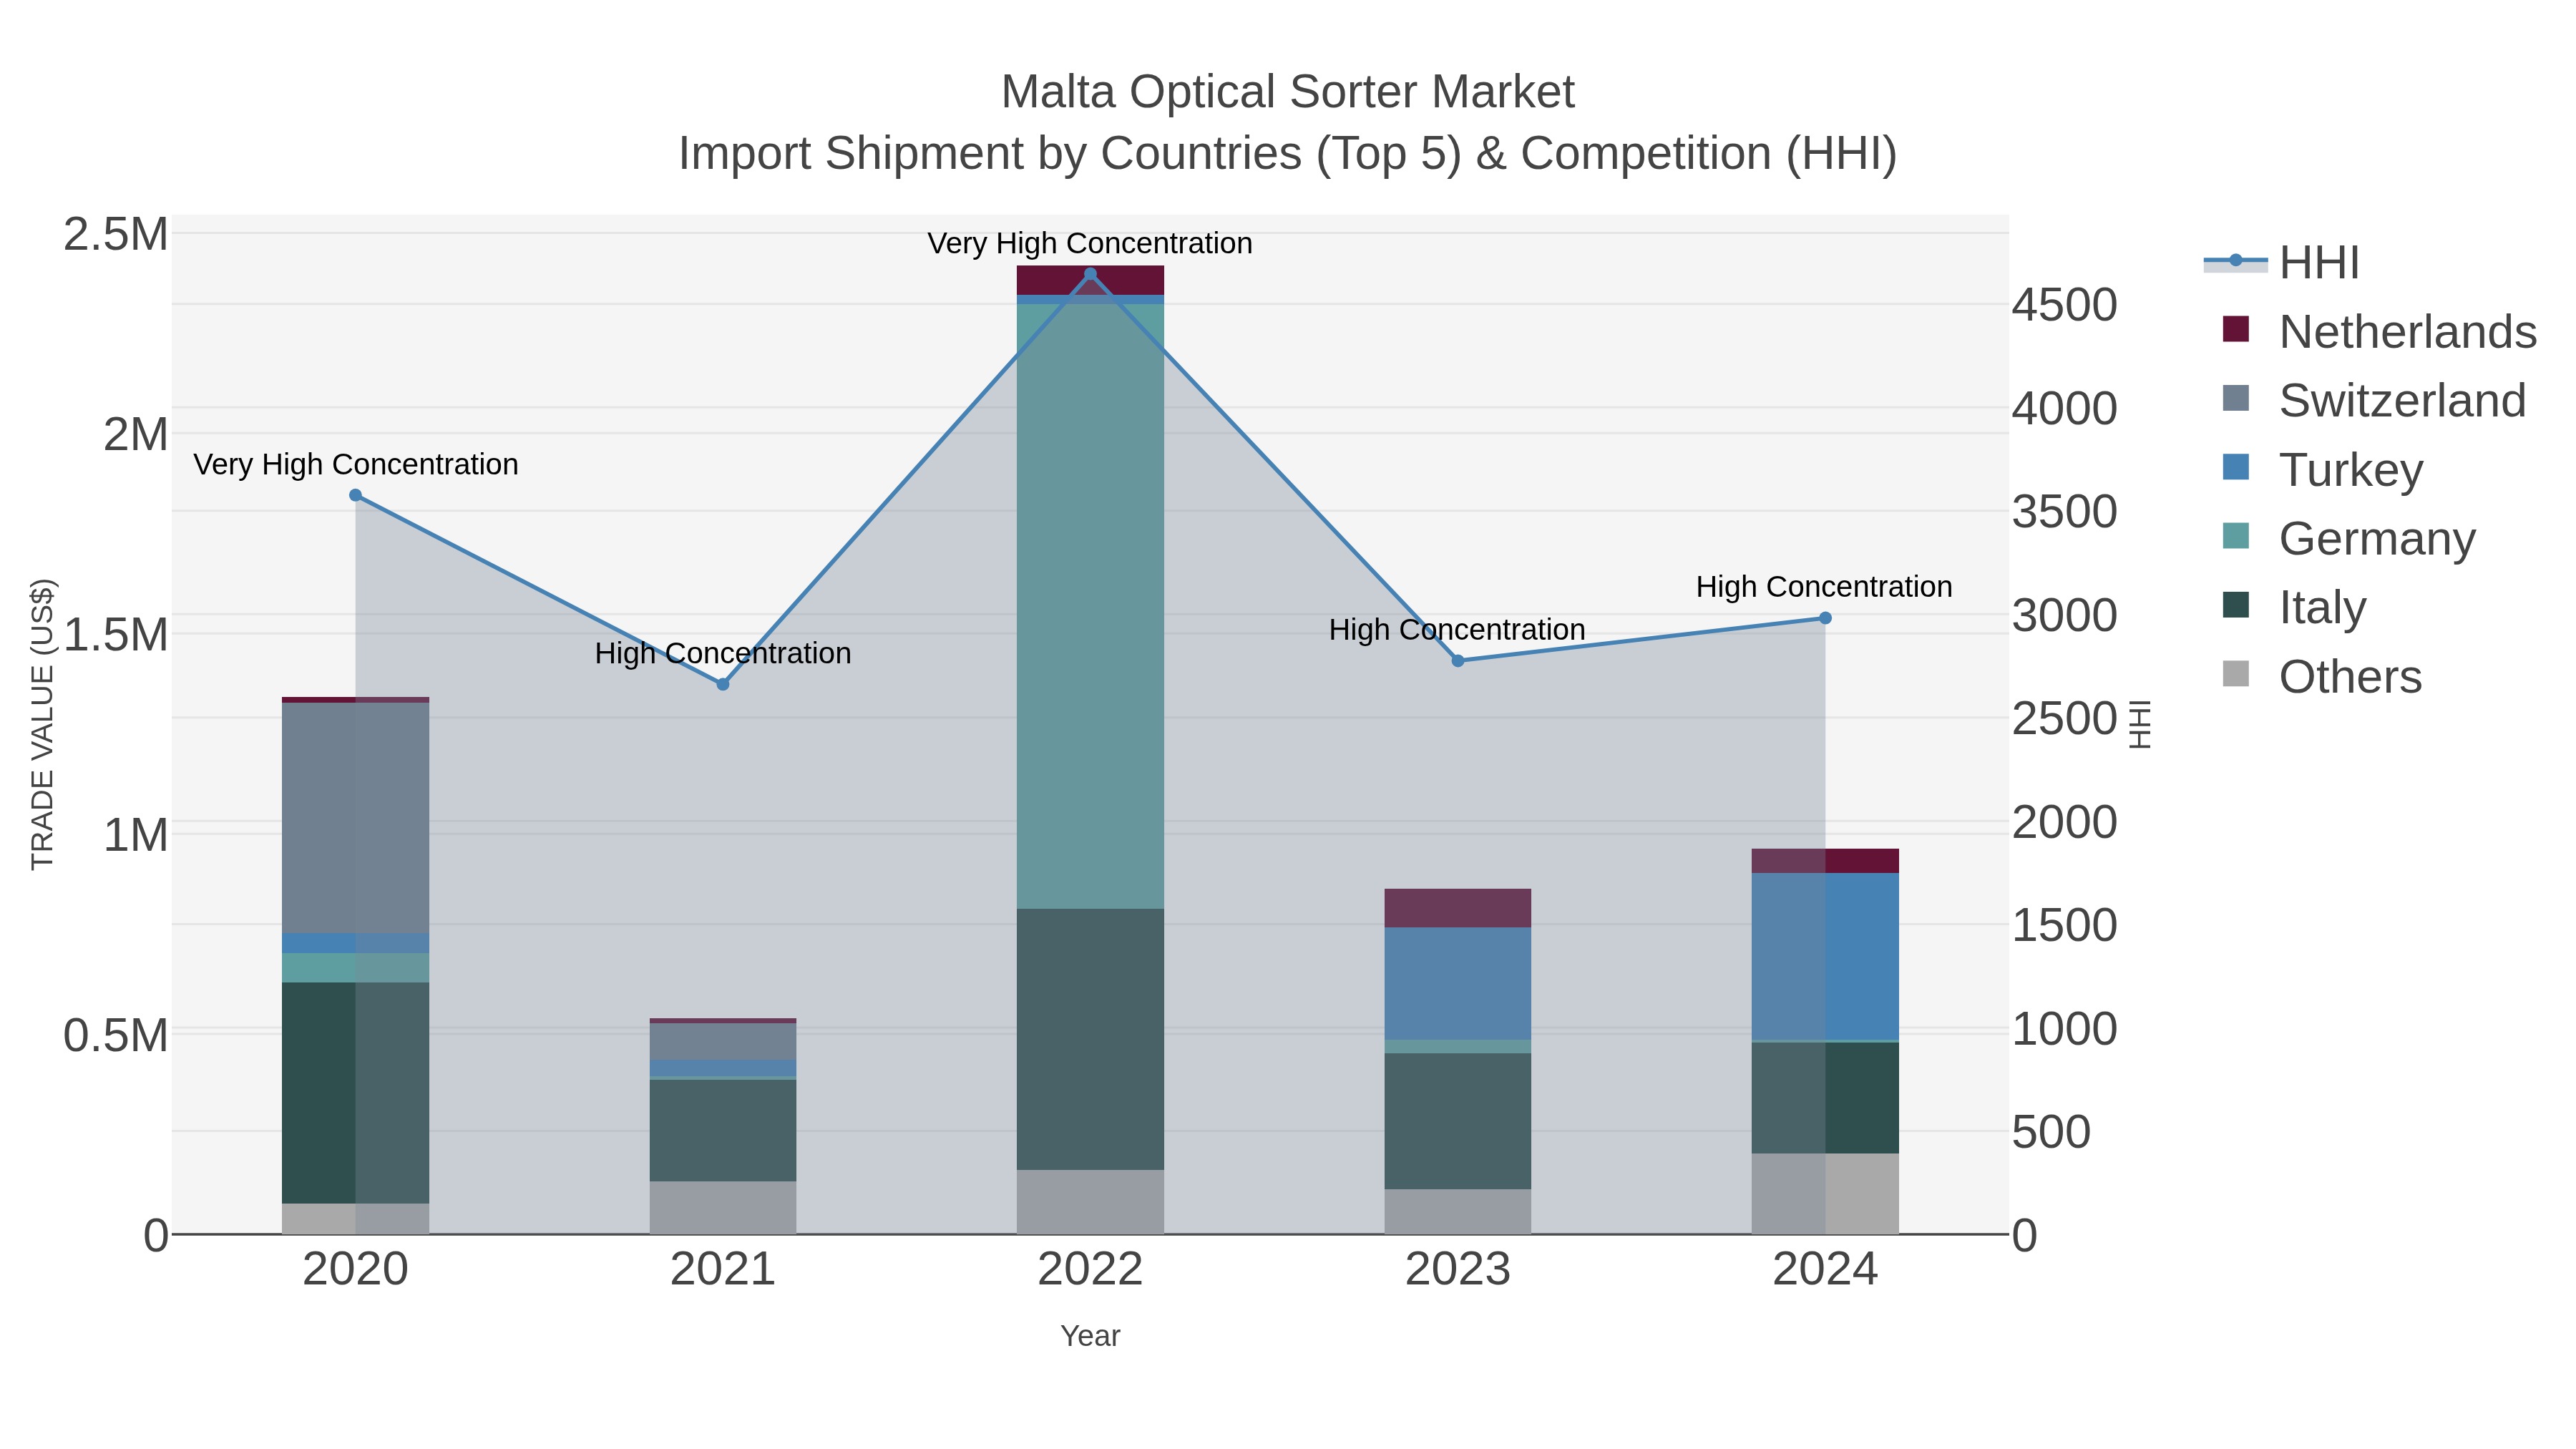
Malta Optical Sorter Market Top 5 Importing Countries and Market Competition (HHI) Analysis
Malta continues to rely on imports of optical sorters, with Turkey, Italy, China, Netherlands, and Spain being the top exporting countries in 2024. Despite a high concentration of market share, the industry experienced a negative compound annual growth rate (CAGR) of -7.94% from 2020 to 2024. However, there was a notable growth rebound in 2024, with a growth rate of 11.51% compared to the previous year. These trends suggest a dynamic market landscape with potential opportunities for market players in the optical sorter industry in Malta.
Key Highlights of the Report:
- Malta Optical Sorter Market Outlook
- Market Size of Malta Optical Sorter Market, 2025
- Forecast of Malta Optical Sorter Market, 2032
- Historical Data and Forecast of Malta Optical Sorter Revenues & Volume for the Period 2022 - 2032F
- Malta Optical Sorter Market Trend Evolution
- Malta Optical Sorter Market Drivers and Challenges
- Malta Optical Sorter Price Trends
- Malta Optical Sorter Porter`s Five Forces
- Malta Optical Sorter Industry Life Cycle
- Historical Data and Forecast of Malta Optical Sorter Market Revenues & Volume By Type for the Period 2022 - 2032F
- Historical Data and Forecast of Malta Optical Sorter Market Revenues & Volume By Hardware for the Period 2022 - 2032F
- Historical Data and Forecast of Malta Optical Sorter Market Revenues & Volume By Software for the Period 2022 - 2032F
- Historical Data and Forecast of Malta Optical Sorter Market Revenues & Volume By End-user Industries for the Period 2022 - 2032F
- Historical Data and Forecast of Malta Optical Sorter Market Revenues & Volume By Food for the Period 2022 - 2032F
- Historical Data and Forecast of Malta Optical Sorter Market Revenues & Volume By Recycling for the Period 2022 - 2032F
- Historical Data and Forecast of Malta Optical Sorter Market Revenues & Volume By Mining for the Period 2022 - 2032F
- Historical Data and Forecast of Malta Optical Sorter Market Revenues & Volume By Other End-user Industries for the Period 2022 - 2032F
- Malta Optical Sorter Import Export Trade Statistics
- Market Opportunity Assessment By Type
- Market Opportunity Assessment By End-user Industries
- Malta Optical Sorter Top Companies Market Share
- Malta Optical Sorter Competitive Benchmarking By Technical and Operational Parameters
- Malta Optical Sorter Company Profiles
- Malta Optical Sorter Key Strategic Recommendations
Frequently Asked Questions About the Market Study (FAQs):
6Wresearch actively monitors the Malta Optical Sorter Market and publishes its comprehensive annual report, highlighting emerging trends, growth drivers, revenue analysis, and forecast outlook. Our insights help businesses to make data-backed strategic decisions with ongoing market dynamics. Our analysts track relevent industries related to the Malta Optical Sorter Market, allowing our clients with actionable intelligence and reliable forecasts tailored to emerging regional needs.
Yes, we provide customisation as per your requirements. To learn more, feel free to contact us on sales@6wresearch.com
1 Executive Summary |
2 Introduction |
2.1 Key Highlights of the Report |
2.2 Report Description |
2.3 Market Scope & Segmentation |
2.4 Research Methodology |
2.5 Assumptions |
3 Malta Optical Sorter Market Overview |
3.1 Malta Country Macro Economic Indicators |
3.2 Malta Optical Sorter Market Revenues & Volume, 2022 & 2032F |
3.3 Malta Optical Sorter Market - Industry Life Cycle |
3.4 Malta Optical Sorter Market - Porter's Five Forces |
3.5 Malta Optical Sorter Market Revenues & Volume Share, By Type, 2022 & 2032F |
3.6 Malta Optical Sorter Market Revenues & Volume Share, By End-user Industries, 2022 & 2032F |
4 Malta Optical Sorter Market Dynamics |
4.1 Impact Analysis |
4.2 Market Drivers |
4.2.1 Increasing adoption of automation in the food processing industry |
4.2.2 Growing demand for high-quality and defect-free products |
4.2.3 Stringent government regulations related to food safety and quality control |
4.2.4 Technological advancements in optical sorting technology |
4.2.5 Rising focus on sustainability and reducing food waste |
4.3 Market Restraints |
4.3.1 High initial investment cost of optical sorters |
4.3.2 Lack of awareness and skilled workforce for operating optical sorters |
4.3.3 Limited customization options for specific sorting requirements |
4.3.4 Challenges in integrating optical sorting systems with existing production lines |
4.3.5 Maintenance and operational costs associated with optical sorters |
5 Malta Optical Sorter Market Trends |
6 Malta Optical Sorter Market Segmentations |
6.1 Malta Optical Sorter Market, By Type |
6.1.1 Overview and Analysis |
6.1.2 Malta Optical Sorter Market Revenues & Volume, By Hardware, 2022 - 2032F |
6.1.3 Malta Optical Sorter Market Revenues & Volume, By Software, 2022 - 2032F |
6.2 Malta Optical Sorter Market, By End-user Industries |
6.2.1 Overview and Analysis |
6.2.2 Malta Optical Sorter Market Revenues & Volume, By Food, 2022 - 2032F |
6.2.3 Malta Optical Sorter Market Revenues & Volume, By Recycling, 2022 - 2032F |
6.2.4 Malta Optical Sorter Market Revenues & Volume, By Mining, 2022 - 2032F |
6.2.5 Malta Optical Sorter Market Revenues & Volume, By Other End-user Industries, 2022 - 2032F |
7 Malta Optical Sorter Market Import-Export Trade Statistics |
7.1 Malta Optical Sorter Market Export to Major Countries |
7.2 Malta Optical Sorter Market Imports from Major Countries |
8 Malta Optical Sorter Market Key Performance Indicators |
8.1 Percentage increase in efficiency and accuracy of sorting operations |
8.2 Reduction in product defects and waste |
8.3 Improvement in product quality and consistency |
8.4 Downtime due to maintenance and technical issues |
8.5 Return on investment (ROI) from implementing optical sorting technology |
9 Malta Optical Sorter Market - Opportunity Assessment |
9.1 Malta Optical Sorter Market Opportunity Assessment, By Type, 2022 & 2032F |
9.2 Malta Optical Sorter Market Opportunity Assessment, By End-user Industries, 2022 & 2032F |
10 Malta Optical Sorter Market - Competitive Landscape |
10.1 Malta Optical Sorter Market Revenue Share, By Companies, 2025 |
10.2 Malta Optical Sorter Market Competitive Benchmarking, By Operating and Technical Parameters |
11 Company Profiles |
12 Recommendations | 13 Disclaimer |
Global Go To Market Strategy - 2030
Export potential enables firms to identify high-growth global markets with greater confidence by combining advanced trade intelligence with a structured quantitative methodology. The framework analyzes emerging demand trends and country-level import patterns while integrating macroeconomic and trade datasets such as GDP and population forecasts, bilateral import–export flows, tariff structures, elasticity differentials between developed and developing economies, geographic distance, and import demand projections. Using weighted trade values from 2020–2024 as the base period to project country-to-country export potential for 2030, these inputs are operationalized through calculated drivers such as gravity model parameters, tariff impact factors, and projected GDP per-capita growth. Through an analysis of hidden potentials, demand hotspots, and market conditions that are most favorable to success, this method enables firms to focus on target countries, maximize returns, and global expansion with data, backed by accuracy.
By factoring in the projected importer demand gap that is currently unmet and could be potential opportunity, it identifies the potential for the Exporter (Country) among 190 countries, against the general trade analysis, which identifies the biggest importer or exporter.
To discover high-growth global markets and optimize your business strategy:
Click Here
Pricing
- Single User License$ 1,995
- Department License$ 2,400
- Site License$ 3,120
- Global License$ 3,795

Leadership Perspectives from Industry Events
Search
Thought Leadership and Analyst Meet


Our Clients
6WResearch In News
- Doha a strategic location for EV manufacturing hub: IPA Qatar
- Demand for luxury TVs surging in the GCC, says Samsung
- Empowering Growth: The Thriving Journey of Bangladesh’s Cable Industry
- Demand for luxury TVs surging in the GCC, says Samsung
- Video call with a traditional healer? Once unthinkable, it’s now common in South Africa
- Intelligent Buildings To Smooth GCC’s Path To Net Zero
Latest Reports
- Cape Verde Portable Hand-Thrown Extinguisher Market (2026-2032)
- Canada Portable Hand-Thrown Extinguisher Market (2026-2032)
- Cameroon Portable Hand-Thrown Extinguisher Market (2026-2032)
- Burundi Portable Hand-Thrown Extinguisher Market (2026-2032)
- Burkina Faso Portable Hand-Thrown Extinguisher Market (2026-2032)
- Bulgaria Portable Hand-Thrown Extinguisher Market (2026-2032)
- Brunei Portable Hand-Thrown Extinguisher Market (2026-2032)
- Botswana Portable Hand-Thrown Extinguisher Market (2026-2032)
- Bosnia and Herzegovina Portable Hand-Thrown Extinguisher Market (2026-2032)
- Bolivia Portable Hand-Thrown Extinguisher Market (2026-2032)
Industry Events and Analyst Meet

HIMTEX 2026

India Refining Summit 2026

India EV Show 2026

EV tech India Expo 2026

Auto Tech Asia 2026
Whitepaper
- Middle East & Africa Commercial Security Market Click here to view more.
- Middle East & Africa Fire Safety Systems & Equipment Market Click here to view more.
- GCC Drone Market Click here to view more.
- Middle East Lighting Fixture Market Click here to view more.
- GCC Physical & Perimeter Security Market Click here to view more.