Malta Sillimanite Bricks Market (2026-2032) | Value, Growth, Analysis, Companies, Outlook, Forecast, Size, Segmentation, Trends, Share, Revenue & Industry
Market Forecast By Type (Firing, Casting), By Application (Non-Ferrous Metal Metallurgy Industries, Iron and Steel Industries, Metallurgical Processing Industries, Ceramics and Grinding Wheel Industries, Silicate Industries) And Competitive Landscape
| Product Code: ETC5319267 | Publication Date: Nov 2023 | Updated Date: Apr 2026 | Product Type: Market Research Report | |
| Publisher: 6Wresearch | Author: Ravi Bhandari | No. of Pages: 60 | No. of Figures: 30 | No. of Tables: 5 |
Malta Sillimanite Bricks Market Size (2020-2030)
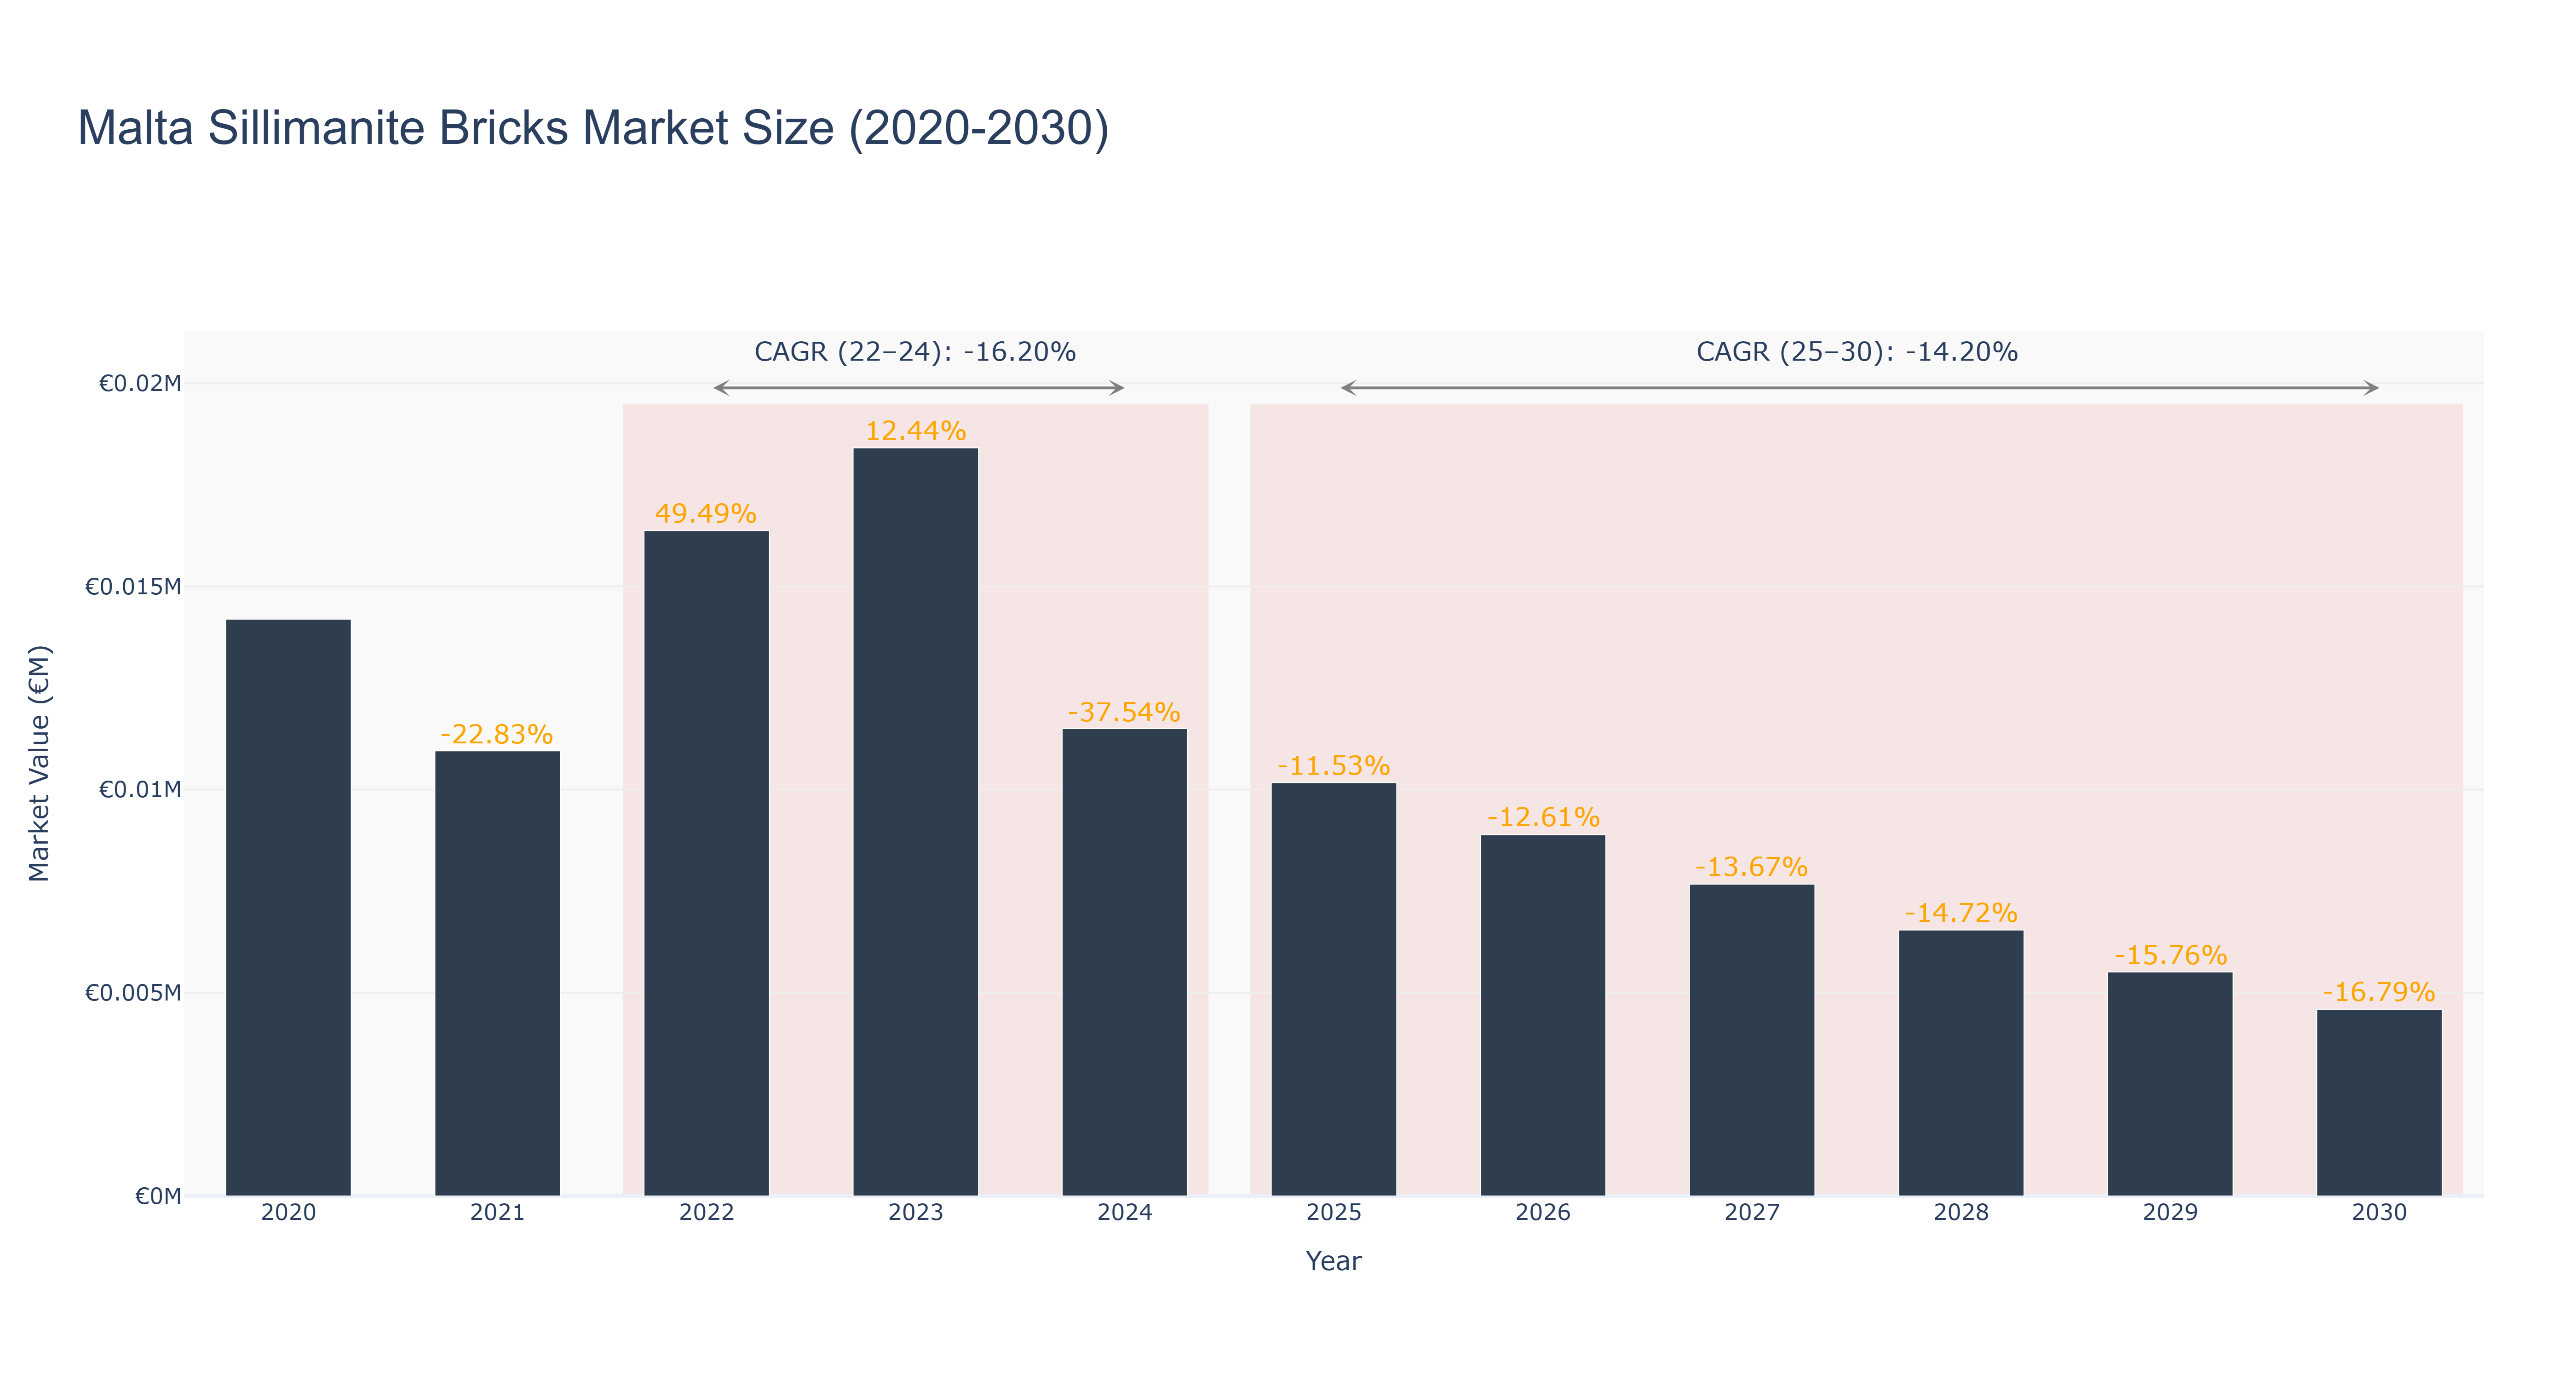
The Malta Sillimanite Bricks Market has experienced significant fluctuations over recent years, marked by a peak market size of €18.41 thousand in 2023. The actual data from 2022 to 2024 reveals a recovery in 2022, with a notable growth of 49.49%, followed by a decline to €11.50 thousand in 2024, reflecting a CAGR of -16.20%. Looking ahead, the forecasted period from 2025 to 2030 presents a continued downward trend, with market sizes projected to decrease from €10.17 thousand in 2025 to €4.59 thousand in 2030, resulting in a CAGR of -14.20%. This decline can be attributed to reduced demand in construction and manufacturing sectors, alongside potential shifts towards alternative materials. Future developments may hinge on macroeconomic factors and infrastructure projects, though specific initiatives in Malta's market remain limited. Overall, the outlook suggests ongoing challenges for the industry.
Malta Sillimanite Bricks Market: Production & Trade Performance (2019-2025)
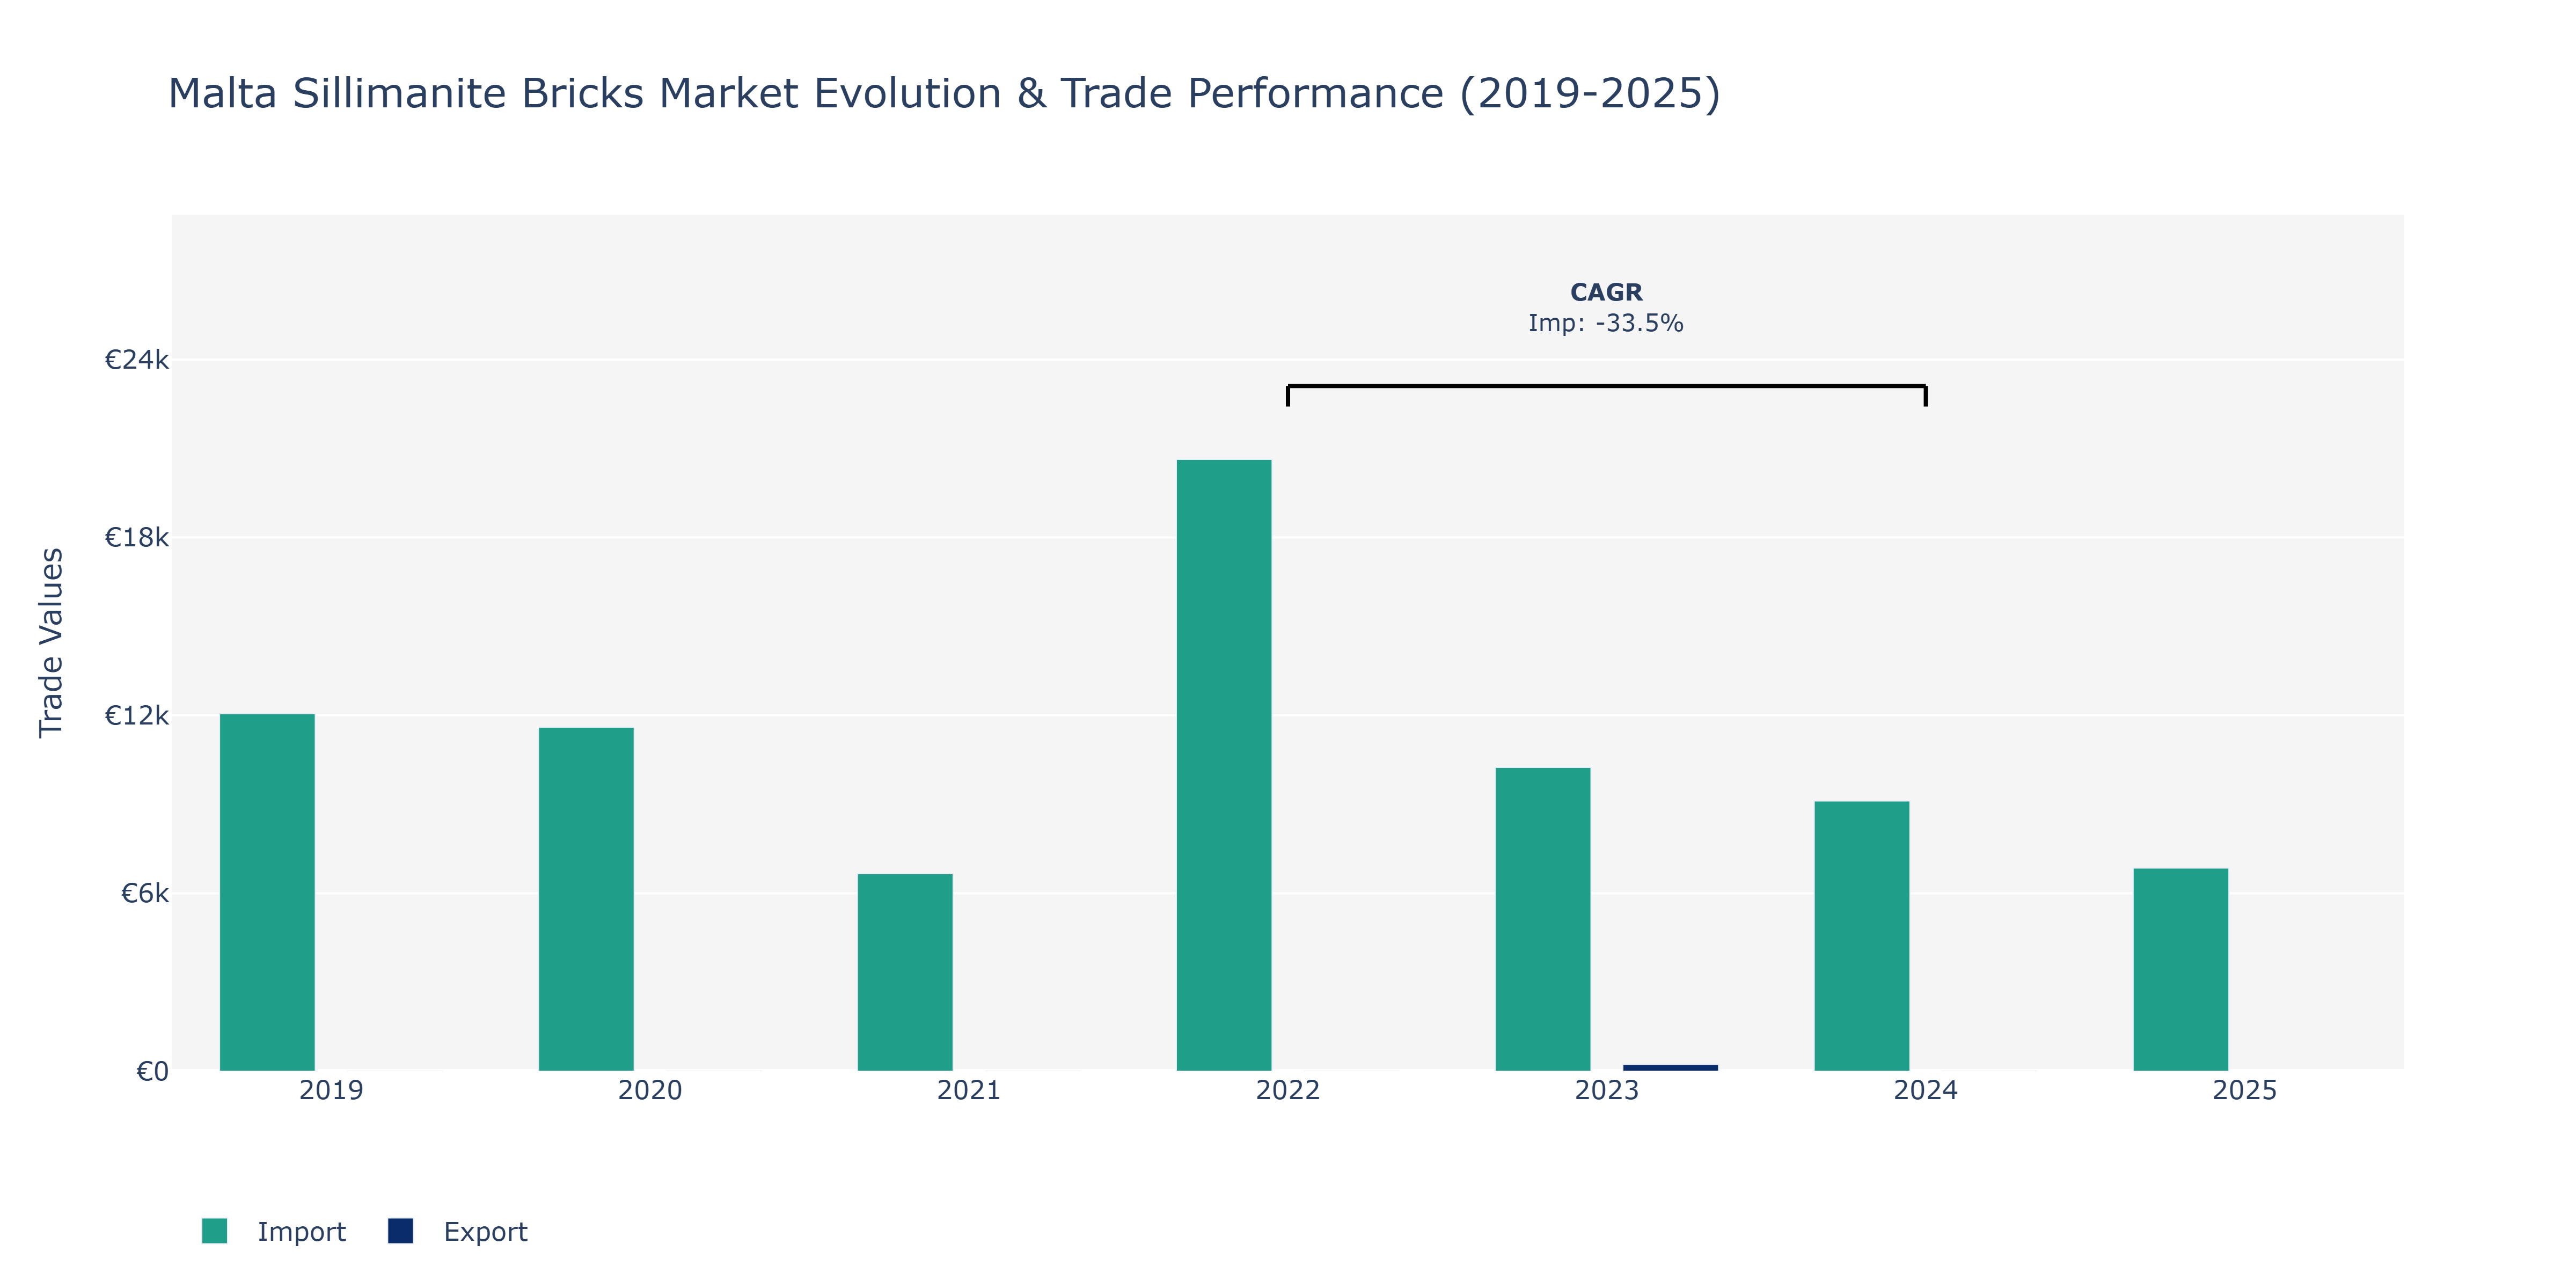
In the Malta Sillimanite Bricks Market, imports experienced fluctuations over the years, starting at €12.06 thousand in 2019 and decreasing to €6.66 thousand in 2021. A notable surge occurred in 2022, reaching €20.63 thousand, before a subsequent decline to €6.85 thousand in 2025. Exports were introduced in 2023 at €0.23 billion, while imports stood at €10.25 thousand in the same year. The sharp decrease in imports in 2021 could be attributed to shifts in construction projects or changes in demand for raw materials. The peak in 2022 might reflect increased infrastructure development or renovations requiring a higher supply of sillimanite bricks. The subsequent decrease in 2025 could be influenced by regulatory changes, market saturation, or economic fluctuations affecting demand. Such market dynamics underscore the importance of adapting to evolving industry trends and maintaining a competitive edge in the construction sector.
Key Highlights of the Report:
- Malta Sillimanite Bricks Market Outlook
- Market Size of Malta Sillimanite Bricks Market, 2025
- Forecast of Malta Sillimanite Bricks Market, 2032
- Historical Data and Forecast of Malta Sillimanite Bricks Revenues & Volume for the Period 2022 - 2032F
- Malta Sillimanite Bricks Market Trend Evolution
- Malta Sillimanite Bricks Market Drivers and Challenges
- Malta Sillimanite Bricks Price Trends
- Malta Sillimanite Bricks Porter`s Five Forces
- Malta Sillimanite Bricks Industry Life Cycle
- Historical Data and Forecast of Malta Sillimanite Bricks Market Revenues & Volume By Type for the Period 2022 - 2032F
- Historical Data and Forecast of Malta Sillimanite Bricks Market Revenues & Volume By Firing for the Period 2022 - 2032F
- Historical Data and Forecast of Malta Sillimanite Bricks Market Revenues & Volume By Casting for the Period 2022 - 2032F
- Historical Data and Forecast of Malta Sillimanite Bricks Market Revenues & Volume By Application for the Period 2022 - 2032F
- Historical Data and Forecast of Malta Sillimanite Bricks Market Revenues & Volume By Non-Ferrous Metal Metallurgy Industries for the Period 2022 - 2032F
- Historical Data and Forecast of Malta Sillimanite Bricks Market Revenues & Volume By Iron and Steel Industries for the Period 2022 - 2032F
- Historical Data and Forecast of Malta Sillimanite Bricks Market Revenues & Volume By Metallurgical Processing Industries for the Period 2022 - 2032F
- Historical Data and Forecast of Malta Sillimanite Bricks Market Revenues & Volume By Ceramics and Grinding Wheel Industries for the Period 2022 - 2032F
- Historical Data and Forecast of Malta Sillimanite Bricks Market Revenues & Volume By Silicate Industries for the Period 2022 - 2032F
- Malta Sillimanite Bricks Import Export Trade Statistics
- Market Opportunity Assessment By Type
- Market Opportunity Assessment By Application
- Malta Sillimanite Bricks Top Companies Market Share
- Malta Sillimanite Bricks Competitive Benchmarking By Technical and Operational Parameters
- Malta Sillimanite Bricks Company Profiles
- Malta Sillimanite Bricks Key Strategic Recommendations
Frequently Asked Questions About the Market Study (FAQs):
6Wresearch actively monitors the Malta Sillimanite Bricks Market and publishes its comprehensive annual report, highlighting emerging trends, growth drivers, revenue analysis, and forecast outlook. Our insights help businesses to make data-backed strategic decisions with ongoing market dynamics. Our analysts track relevent industries related to the Malta Sillimanite Bricks Market, allowing our clients with actionable intelligence and reliable forecasts tailored to emerging regional needs.
Yes, we provide customisation as per your requirements. To learn more, feel free to contact us on sales@6wresearch.com
1 Executive Summary |
2 Introduction |
2.1 Key Highlights of the Report |
2.2 Report Description |
2.3 Market Scope & Segmentation |
2.4 Research Methodology |
2.5 Assumptions |
3 Malta Sillimanite Bricks Market Overview |
3.1 Malta Country Macro Economic Indicators |
3.2 Malta Sillimanite Bricks Market Revenues & Volume, 2022 & 2032F |
3.3 Malta Sillimanite Bricks Market - Industry Life Cycle |
3.4 Malta Sillimanite Bricks Market - Porter's Five Forces |
3.5 Malta Sillimanite Bricks Market Revenues & Volume Share, By Type, 2022 & 2032F |
3.6 Malta Sillimanite Bricks Market Revenues & Volume Share, By Application, 2022 & 2032F |
4 Malta Sillimanite Bricks Market Dynamics |
4.1 Impact Analysis |
4.2 Market Drivers |
4.2.1 Increasing demand for high-temperature refractory materials in industries such as steel, glass, and ceramics |
4.2.2 Growing focus on energy-efficient and sustainable manufacturing processes |
4.2.3 Rising investments in infrastructure projects and industrial development in emerging economies |
4.3 Market Restraints |
4.3.1 Fluctuations in raw material prices affecting production costs |
4.3.2 Intense competition from alternative refractory materials like alumina bricks and magnesia bricks |
4.3.3 Impact of stringent environmental regulations on production processes and materials sourcing |
5 Malta Sillimanite Bricks Market Trends |
6 Malta Sillimanite Bricks Market Segmentations |
6.1 Malta Sillimanite Bricks Market, By Type |
6.1.1 Overview and Analysis |
6.1.2 Malta Sillimanite Bricks Market Revenues & Volume, By Firing, 2022 - 2032F |
6.1.3 Malta Sillimanite Bricks Market Revenues & Volume, By Casting, 2022 - 2032F |
6.2 Malta Sillimanite Bricks Market, By Application |
6.2.1 Overview and Analysis |
6.2.2 Malta Sillimanite Bricks Market Revenues & Volume, By Non-Ferrous Metal Metallurgy Industries, 2022 - 2032F |
6.2.3 Malta Sillimanite Bricks Market Revenues & Volume, By Iron and Steel Industries, 2022 - 2032F |
6.2.4 Malta Sillimanite Bricks Market Revenues & Volume, By Metallurgical Processing Industries, 2022 - 2032F |
6.2.5 Malta Sillimanite Bricks Market Revenues & Volume, By Ceramics and Grinding Wheel Industries, 2022 - 2032F |
6.2.6 Malta Sillimanite Bricks Market Revenues & Volume, By Silicate Industries, 2022 - 2032F |
7 Malta Sillimanite Bricks Market Import-Export Trade Statistics |
7.1 Malta Sillimanite Bricks Market Export to Major Countries |
7.2 Malta Sillimanite Bricks Market Imports from Major Countries |
8 Malta Sillimanite Bricks Market Key Performance Indicators |
8.1 Percentage of market penetration in key industries (steel, glass, ceramics) |
8.2 Rate of adoption of energy-efficient manufacturing technologies |
8.3 Number of new infrastructure projects and industrial plants using malta sillimanite bricks |
8.4 Customer satisfaction ratings and feedback on the performance of malta sillimanite bricks |
8.5 Innovation rate in developing new formulations and applications for malta sillimanite bricks |
9 Malta Sillimanite Bricks Market - Opportunity Assessment |
9.1 Malta Sillimanite Bricks Market Opportunity Assessment, By Type, 2022 & 2032F |
9.2 Malta Sillimanite Bricks Market Opportunity Assessment, By Application, 2022 & 2032F |
10 Malta Sillimanite Bricks Market - Competitive Landscape |
10.1 Malta Sillimanite Bricks Market Revenue Share, By Companies, 2025 |
10.2 Malta Sillimanite Bricks Market Competitive Benchmarking, By Operating and Technical Parameters |
11 Company Profiles |
12 Recommendations | 13 Disclaimer |
Global Go To Market Strategy - 2030
Export potential enables firms to identify high-growth global markets with greater confidence by combining advanced trade intelligence with a structured quantitative methodology. The framework analyzes emerging demand trends and country-level import patterns while integrating macroeconomic and trade datasets such as GDP and population forecasts, bilateral import–export flows, tariff structures, elasticity differentials between developed and developing economies, geographic distance, and import demand projections. Using weighted trade values from 2020–2024 as the base period to project country-to-country export potential for 2030, these inputs are operationalized through calculated drivers such as gravity model parameters, tariff impact factors, and projected GDP per-capita growth. Through an analysis of hidden potentials, demand hotspots, and market conditions that are most favorable to success, this method enables firms to focus on target countries, maximize returns, and global expansion with data, backed by accuracy.
By factoring in the projected importer demand gap that is currently unmet and could be potential opportunity, it identifies the potential for the Exporter (Country) among 190 countries, against the general trade analysis, which identifies the biggest importer or exporter.
To discover high-growth global markets and optimize your business strategy:
Click Here
Pricing
- Single User License$ 1,995
- Department License$ 2,400
- Site License$ 3,120
- Global License$ 3,795

Leadership Perspectives from Industry Events
Search
Thought Leadership and Analyst Meet


Our Clients
6WResearch In News
- Doha a strategic location for EV manufacturing hub: IPA Qatar
- Demand for luxury TVs surging in the GCC, says Samsung
- Empowering Growth: The Thriving Journey of Bangladesh’s Cable Industry
- Demand for luxury TVs surging in the GCC, says Samsung
- Video call with a traditional healer? Once unthinkable, it’s now common in South Africa
- Intelligent Buildings To Smooth GCC’s Path To Net Zero
Latest Reports
- Cape Verde Portable Hand-Thrown Extinguisher Market (2026-2032)
- Canada Portable Hand-Thrown Extinguisher Market (2026-2032)
- Cameroon Portable Hand-Thrown Extinguisher Market (2026-2032)
- Burundi Portable Hand-Thrown Extinguisher Market (2026-2032)
- Burkina Faso Portable Hand-Thrown Extinguisher Market (2026-2032)
- Bulgaria Portable Hand-Thrown Extinguisher Market (2026-2032)
- Brunei Portable Hand-Thrown Extinguisher Market (2026-2032)
- Botswana Portable Hand-Thrown Extinguisher Market (2026-2032)
- Bosnia and Herzegovina Portable Hand-Thrown Extinguisher Market (2026-2032)
- Bolivia Portable Hand-Thrown Extinguisher Market (2026-2032)
Industry Events and Analyst Meet

HIMTEX 2026

India Refining Summit 2026

India EV Show 2026

EV tech India Expo 2026

Auto Tech Asia 2026
Whitepaper
- Middle East & Africa Commercial Security Market Click here to view more.
- Middle East & Africa Fire Safety Systems & Equipment Market Click here to view more.
- GCC Drone Market Click here to view more.
- Middle East Lighting Fixture Market Click here to view more.
- GCC Physical & Perimeter Security Market Click here to view more.