Myanmar Copper Forged Market (2026-2032) | Industry, Trends, Share, Analysis, Revenue, Outlook, Value, Companies, COVID-19 IMPACT, Forecast, Growth & Size
Market Forecast By Product Types (Closed Die Forging, Open Die Forging, Rolled Ring Forging), By Applications (Automotive, Aerospace, Oil & Gas, Construction, Agriculture, Others) And Competitive Landscape
| Product Code: ETC009234 | Publication Date: Jun 2023 | Product Type: Report | ||
| Publisher: 6Wresearch | Author: Ravi Bhandari | No. of Pages: 70 | No. of Figures: 35 | No. of Tables: 5 |
Myanmar Copper Forged Market Summary
The myanmar copper forged market was estimated at USD 432 Million in 2025 and is projected to reach USD 576 Million by 2032, growing at a CAGR of 4.8% from 2026 to 2032.
Myanmar Copper Forged Market Growth Rate Analysis (2021-2032)
The Myanmar Copper Forged market has shown stable growth over the past few years, with annual growth rates reflecting a slight upward trend—from 4.9% in 2021 to a projected 5.3% in 2024. This growth can be attributed to increasing demand for copper forged products in key sectors like construction and electrical wiring, driven by rising infrastructure projects and a national push towards energy transition. However, the growth rates are expected to fluctuate slightly, with a dip to 4.7% in 2027 and 2031, likely influenced by global economic conditions and raw material price volatility. The market is anticipated to stabilize again by 2030, as investments in production technology and improved supply chains take effect, fostering resilience and fostering further growth prospects.
Myanmar Copper Forged Market Year-wise Growth Rate and Key Drivers
This graph highlights how the Myanmar Copper Forged Market has steadily grown over the past five years, supported by major growth factors.
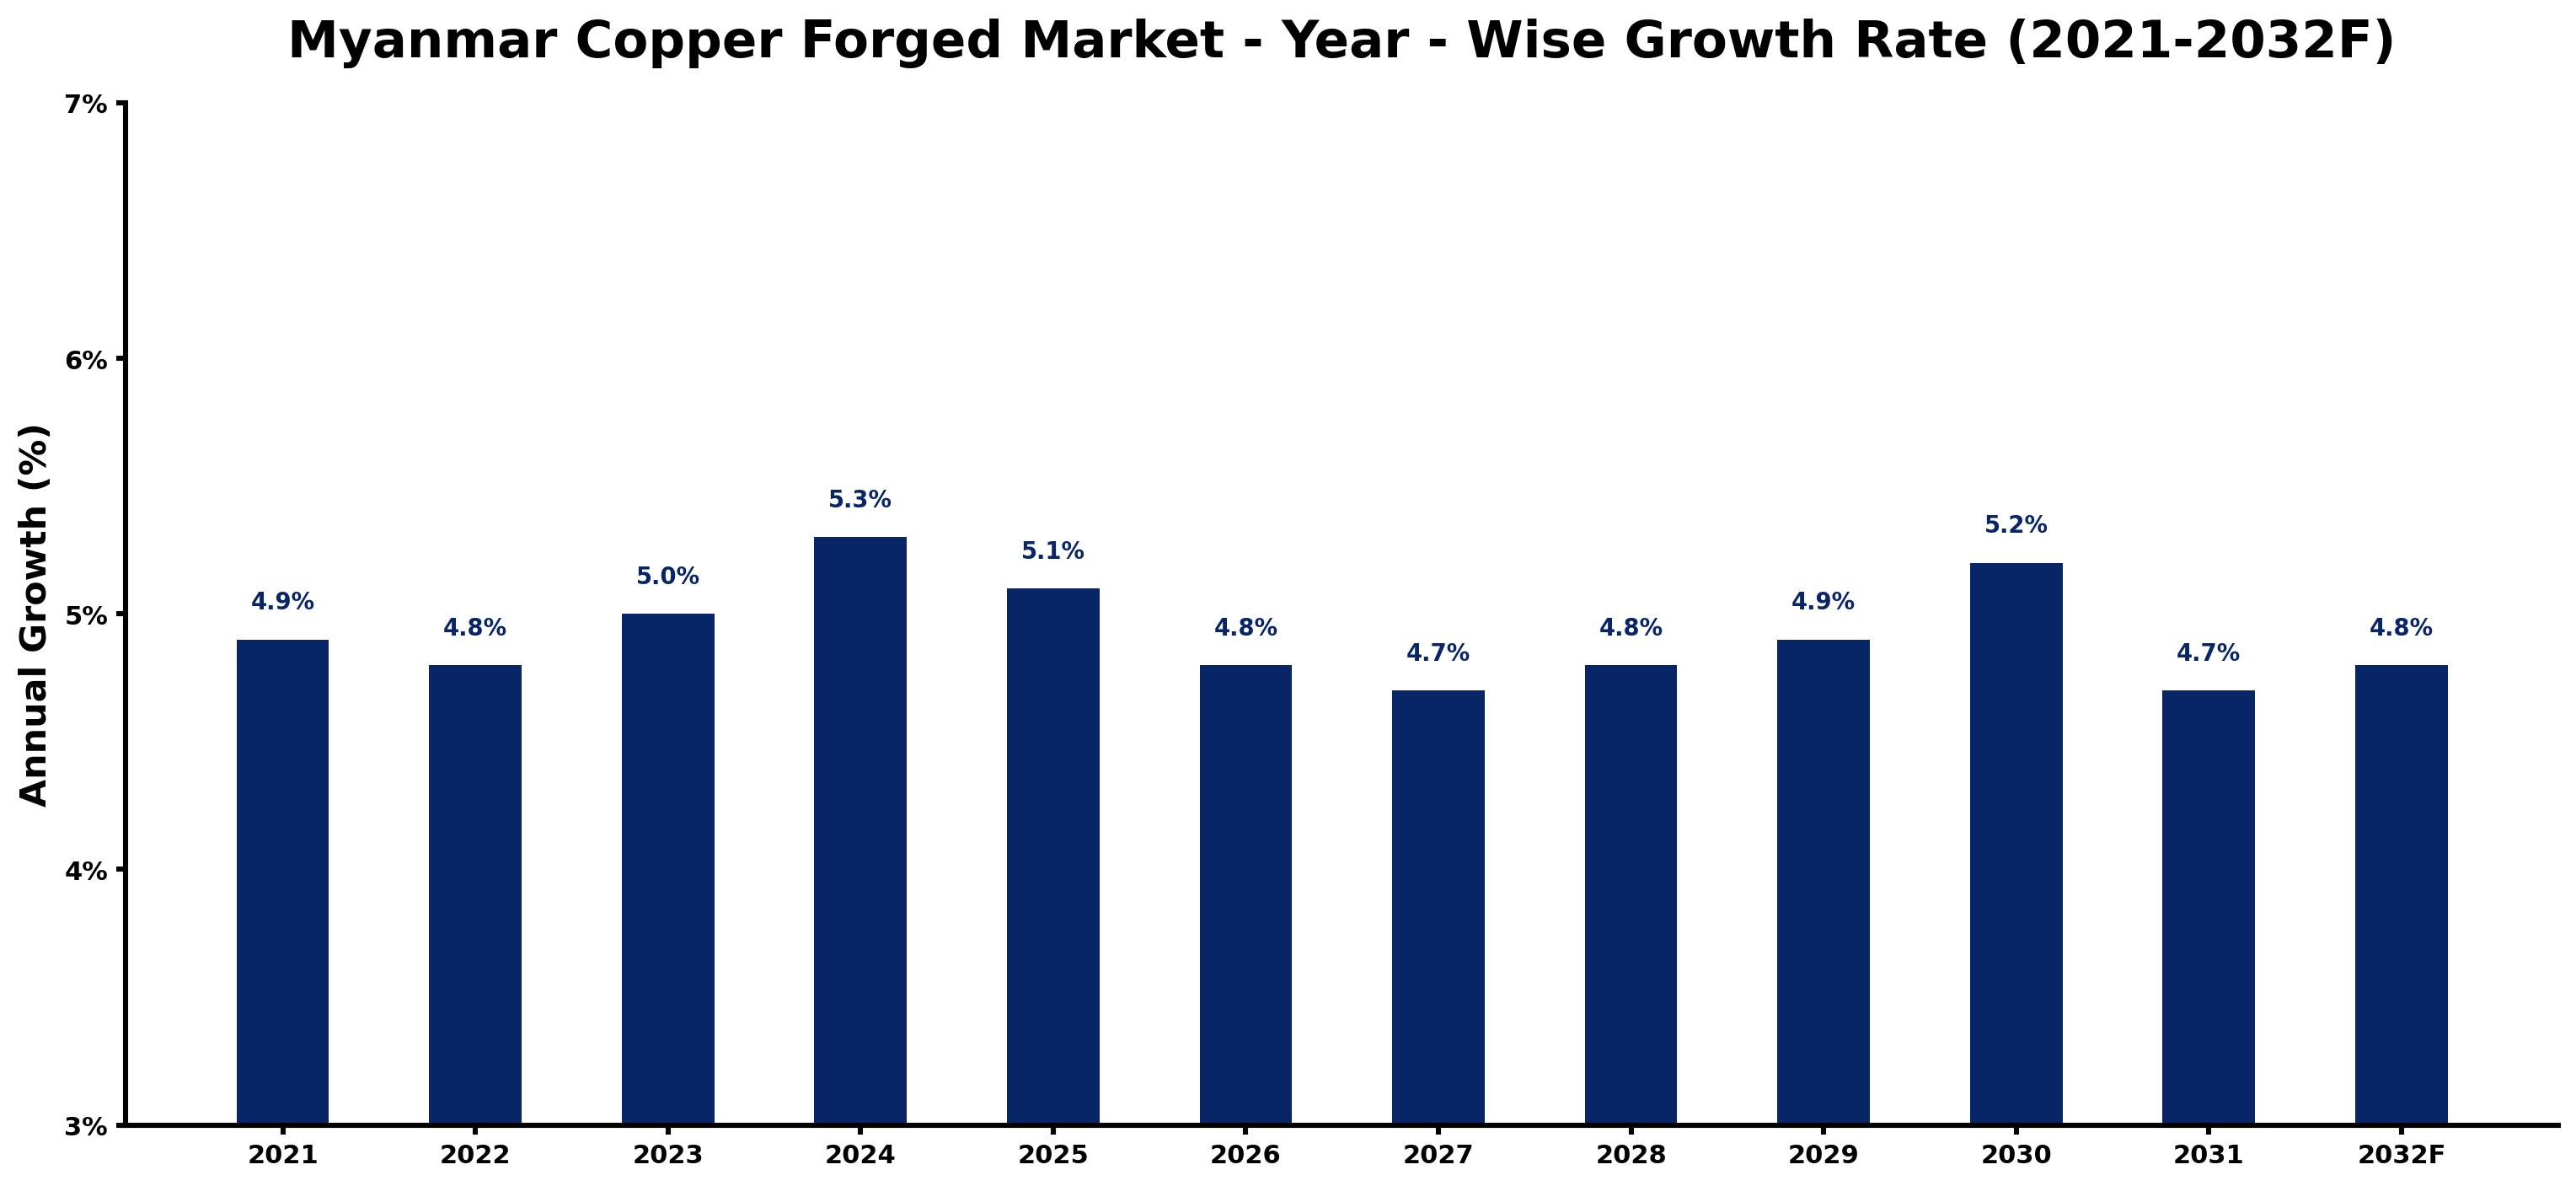
The table below presents the year wise growth rates along with the key drivers influencing the market
| Year | Growth Rate | Major Drivers |
| 2021 | 4.9% | Post-coup economic stabilization efforts spurred demand for copper in various sectors. |
| 2022 | 4.8% | Local manufacturers focused on improving product quality to meet international standards. |
| 2023 | 5.0% | Infrastructure development projects increased, creating a strong need for copper forged components. |
| 2024 | 5.3% | Investment in renewable energy systems highlighted copper's essential role in technology infrastructure. |
| 2025 | 5.1% | International partnerships began enhancing skills training for local copper workforce capabilities. |
| 2026 | 4.8% | Emergence of electric vehicle initiatives necessitated more copper for battery production. |
| 2027 | 4.7% | Urbanization trends drove the construction sector's demand for quality copper forgings. |
| 2028 | 4.8% | Export opportunities expanded as neighboring markets sought quality Myanmar copper supplies. |
| 2029 | 4.9% | Technological upgrades in manufacturing processes began optimizing productivity and reducing waste. |
| 2030 | 5.2% | Increased environmental awareness pushed firms to adopt sustainable copper sourcing practices. |
| 2031 | 4.7% | Local firms diversified product lines, catering to various industrial and consumer needs. |
| 2032 | 4.8% | Market consolidation trends emerged, strengthening competitive advantage among key players. |
Note - Market size estimations and growth projections presented in this report are based on 6Wresearch's advanced forecasting approach, validated with industry datasets as of June 2026.
Myanmar Copper Forged Market Synopsis
The Myanmar Copper Forged Market is projected to reach 4.8% and witness significant growth during the forecast period (2026-2032). The market is anticipated to grow at a compound annual growth rate (CAGR) of 5.10% driven by several critical factors. The essential growth drivers include increasing infrastructure development activities, rising demand from various industries such as automotive and building construction, and growing industrialization in emerging economies, particularly China and India. Additionally, government initiatives that promote investments in metal fabrication, combined with increasing disposable incomes, are bolstering the demand for copper forged products across diverse end-user segments. The surge in digitalization has also significantly advanced various sectors, particularly automation and robotics, further enhancing the prospects for the Myanmar Copper Forged Market during the forecast period.
Myanmar Copper Forged Market Growth Drivers
The growth trajectory of the Myanmar Copper Forged Market is propelled by multiple factors that are intricately linked to the economic landscape of the country. Key growth drivers include:
- Investment in Infrastructure: With ongoing enhancements in infrastructure, the demand for high-quality forged copper components is surging, particularly in construction projects ranging from residential to commercial.
- Automotive Industry Demand: The automotive sector is characterized by an increasing need for components that require robust and durable materials, thereby amplifying the demand for forged copper products.
- Industrialization Trends: As Myanmar continues to industrialize, there is a notable uptake in manufacturing activities which leads to greater consumption of copper forged products.
- Government Support: Initiatives that encourage foreign investments in the metal fabrication industry contribute to the robustness of the copper forged market.
- Technological Advances: Innovations in production technologies are enhancing the efficiency and quality of copper forged products, making them more appealing to a broader range of industries.
Myanmar Copper Forged Market Challenges and Restraints
Despite promising growth rates, the Myanmar Copper Forged Market faces several challenges that could impede its expansion. These constraints include:
- Supply Chain Disruptions: Uncertainties in global supply chains can lead to material shortages and increased costs, affecting the overall production landscape.
- Regulatory Hurdles: Stricter regulations related to environmental impacts can pose challenges for manufacturers in terms of compliance and operational adjustments.
- Competition from Alternatives: The emergence of alternative materials that may offer lower costs or superior attributes could potentially divert demand away from copper forged products.
- Skilled Labor Shortage: The need for a skilled workforce in manufacturing processes may hinder production capabilities, affecting market growth.
- Market Volatility: Fluctuations in copper prices can impact profitability and investment decisions within the sector.
Myanmar Copper Forged Market Trends and Opportunities
The Myanmar Copper Forged Market is witnessing emerging trends that furnish new opportunities for stakeholders. Significant trends include:
- Sustainability Focus: As industries move towards environmentally sustainable practices, there is growing interest in recycling and reusing copper materials, leading to potential growth in the copper forged market.
- Digital Transformation: The ongoing digitalization in manufacturing processes presents opportunities for enhanced efficiency and product quality through advanced technologies.
- Expansion of End-use Industries: As sectors such as renewable energy and electric vehicles grow, the demand for copper forged components is expected to rise significantly.
- Customization: A trend towards personalized products is fostering the development of specialized copper forged solutions tailored to specific industry needs.
- Collaborations and Partnerships: Increasing partnerships between local manufacturers and foreign firms can catalyze the exchange of technology and expertise, boosting market growth.
Myanmar Copper Forged Market Government Investment and Initiatives
Government investment initiatives play a pivotal role in shaping the Myanmar Copper Forged Market. The government is actively promoting policies aimed at enhancing the domestic manufacturing sector through incentives and funding for modernizing facilities. Efforts to nurture a favorable business environment include:
- Investment Incentives: The government provides various tax benefits and incentives for companies investing in the metal fabrication sector, which includes copper forging.
- Infrastructure Development Projects: Significant public spending on infrastructure projects is expected to create sustained demand for copper forged products across various applications.
- Training Programs: Government-supported initiatives to enhance workforce skills in metal fabrication and related technologies are being implemented to address the skilled labor shortage.
- Trade Agreements: Bilateral trade agreements may reduce barriers to entry for international firms, facilitating a more competitive environment for local manufacturers.
- Research Funding: The government is promoting research and development in material sciences, encouraging innovations in copper forging techniques and end-use applications.
Myanmar Copper Forged Market Latest Developments (May 2025 - June 2026)
Recent developments in the Myanmar Copper Forged Market from May 2025 to June 2026 reflect the dynamic shifts within the industry. Key industry directions during this period have included:
- Adoption of Advanced Technologies: Manufacturers have begun integrating advanced production technologies to enhance the efficiency and quality of copper forging processes.
- Increased Collaboration: There has been a rise in partnerships between local firms and international entities, aimed at sharing best practices and technological advancements.
- Focus on Sustainability: Companies are increasingly adopting sustainable practices by investing in recycling initiatives and energy-efficient production methods.
- Market Expansion: With rising demand from end-user industries, many manufacturers have been exploring new market segments and applications for copper forged products.
- Government Policy Shifts: The government's focus on boosting local manufacturing capabilities has resulted in updated policies that favor investment in sectors like metal fabrication.
Myanmar Copper Forged Market - Key Attractiveness of the Report
- 10 Years of Market Numbers
- Historical Data Starting from 2022 to 2025
- Base Year: 2025
- Forecast Data until 2032
- Key Performance Indicators Impacting the Market
- Major Upcoming Developments and Projects
Key Highlights of the Report:
- Myanmar Copper Forged Market Outlook
- Market Size of Myanmar Copper Forged Market, 2025
- Forecast of Myanmar Copper Forged Market, 2032F
- Historical Data and Forecast of Myanmar Copper Forged Revenues & Volume for the Period 2022-2032F
- Myanmar Copper Forged Market Trend Evolution
- Myanmar Copper Forged Market Drivers and Challenges
- Myanmar Copper Forged Price Trends
- Myanmar Copper Forged Porter's Five Forces
- Myanmar Copper Forged Industry Life Cycle
- Historical Data and Forecast of Myanmar Copper Forged Market Revenues & Volume By Product Types for the Period 2022-2032F
- Historical Data and Forecast of Myanmar Copper Forged Market Revenues & Volume By Closed Die Forging for the Period 2022-2032F
- Historical Data and Forecast of Myanmar Copper Forged Market Revenues & Volume By Open Die Forging for the Period 2022-2032F
- Historical Data and Forecast of Myanmar Copper Forged Market Revenues & Volume By Rolled Ring Forging for the Period 2022-2032F
- Historical Data and Forecast of Myanmar Copper Forged Market Revenues & Volume By Applications for the Period 2022-2032F
- Historical Data and Forecast of Myanmar Copper Forged Market Revenues & Volume By Automotive for the Period 2022-2032F
- Historical Data and Forecast of Myanmar Copper Forged Market Revenues & Volume By Aerospace for the Period 2022-2032F
- Historical Data and Forecast of Myanmar Copper Forged Market Revenues & Volume By Oil & Gas for the Period 2022-2032F
- Historical Data and Forecast of Myanmar Copper Forged Market Revenues & Volume By Construction for the Period 2022-2032F
- Historical Data and Forecast of Myanmar Copper Forged Market Revenues & Volume By Agriculture for the Period 2022-2032F
- Historical Data and Forecast of Myanmar Copper Forged Market Revenues & Volume By Others for the Period 2022-2032F
- Myanmar Copper Forged Import Export Trade Statistics
- Market Opportunity Assessment By Product Types
- Market Opportunity Assessment By Applications
- Myanmar Copper Forged Top Companies Market Share
- Myanmar Copper Forged Competitive Benchmarking By Technical and Operational Parameters
- Myanmar Copper Forged Company Profiles
- Myanmar Copper Forged Key Strategic Recommendations
Frequently Asked Questions About the Market Study (FAQs):
The growth of the Myanmar Copper Forged Market is primarily driven by increasing infrastructure development, rising demand from the automotive sector, and significant industrialization in the region.
Government policies, including investment incentives and public spending on infrastructure, significantly enhance the development and competitiveness of the copper forged market.
Key challenges include supply chain disruptions, regulatory hurdles, and competition from alternative materials.
Opportunities include advances in technology, shifts towards sustainability, and the expansion into emerging industrial sectors.
6Wresearch actively monitors the Myanmar Copper Forged Market and publishes its comprehensive annual report, highlighting emerging trends, growth drivers, revenue analysis, and forecast outlook. Our insights help businesses to make data-backed strategic decisions with ongoing market dynamics. Our analysts track relevent industries related to the Myanmar Copper Forged Market, allowing our clients with actionable intelligence and reliable forecasts tailored to emerging regional needs.
Yes, we provide customisation as per your requirements. To learn more, feel free to contact us on sales@6wresearch.com
1 Executive Summary |
2 Introduction |
2.1 Key Highlights of the Report |
2.2 Report Description |
2.3 Market Scope & Segmentation |
2.4 Research Methodology |
2.5 Assumptions |
3 Myanmar Copper Forged Market Overview |
3.1 Myanmar Country Macro Economic Indicators |
3.2 Myanmar Copper Forged Market Revenues & Volume, 2022 & 2032F |
3.3 Myanmar Copper Forged Market - Industry Life Cycle |
3.4 Myanmar Copper Forged Market - Porter's Five Forces |
3.5 Myanmar Copper Forged Market Revenues & Volume Share, By Product Types, 2022 & 2032F |
3.6 Myanmar Copper Forged Market Revenues & Volume Share, By Applications, 2022 & 2032F |
4 Myanmar Copper Forged Market Dynamics |
4.1 Impact Analysis |
4.2 Market Drivers |
4.3 Market Restraints |
5 Myanmar Copper Forged Market Trends |
6 Myanmar Copper Forged Market, By Types |
6.1 Myanmar Copper Forged Market, By Product Types |
6.1.1 Overview and Analysis |
6.1.2 Myanmar Copper Forged Market Revenues & Volume, By Product Types, 2022-2032F |
6.1.3 Myanmar Copper Forged Market Revenues & Volume, By Closed Die Forging, 2022-2032F |
6.1.4 Myanmar Copper Forged Market Revenues & Volume, By Open Die Forging, 2022-2032F |
6.1.5 Myanmar Copper Forged Market Revenues & Volume, By Rolled Ring Forging, 2022-2032F |
6.2 Myanmar Copper Forged Market, By Applications |
6.2.1 Overview and Analysis |
6.2.2 Myanmar Copper Forged Market Revenues & Volume, By Automotive, 2022-2032F |
6.2.3 Myanmar Copper Forged Market Revenues & Volume, By Aerospace, 2022-2032F |
6.2.4 Myanmar Copper Forged Market Revenues & Volume, By Oil & Gas, 2022-2032F |
6.2.5 Myanmar Copper Forged Market Revenues & Volume, By Construction, 2022-2032F |
6.2.6 Myanmar Copper Forged Market Revenues & Volume, By Agriculture, 2022-2032F |
6.2.7 Myanmar Copper Forged Market Revenues & Volume, By Others, 2022-2032F |
7 Myanmar Copper Forged Market Import-Export Trade Statistics |
7.1 Myanmar Copper Forged Market Export to Major Countries |
7.2 Myanmar Copper Forged Market Imports from Major Countries |
8 Myanmar Copper Forged Market Key Performance Indicators |
9 Myanmar Copper Forged Market - Opportunity Assessment |
9.1 Myanmar Copper Forged Market Opportunity Assessment, By Product Types, 2022 & 2032F |
9.2 Myanmar Copper Forged Market Opportunity Assessment, By Applications, 2022 & 2032F |
10 Myanmar Copper Forged Market - Competitive Landscape |
10.1 Myanmar Copper Forged Market Revenue Share, By Companies, 2025 |
10.2 Myanmar Copper Forged Market Competitive Benchmarking, By Operating and Technical Parameters |
11 Company Profiles |
12 Recommendations |
13 Disclaimer |
Global Go To Market Strategy - 2030
Export potential enables firms to identify high-growth global markets with greater confidence by combining advanced trade intelligence with a structured quantitative methodology. The framework analyzes emerging demand trends and country-level import patterns while integrating macroeconomic and trade datasets such as GDP and population forecasts, bilateral import–export flows, tariff structures, elasticity differentials between developed and developing economies, geographic distance, and import demand projections. Using weighted trade values from 2020–2024 as the base period to project country-to-country export potential for 2030, these inputs are operationalized through calculated drivers such as gravity model parameters, tariff impact factors, and projected GDP per-capita growth. Through an analysis of hidden potentials, demand hotspots, and market conditions that are most favorable to success, this method enables firms to focus on target countries, maximize returns, and global expansion with data, backed by accuracy.
By factoring in the projected importer demand gap that is currently unmet and could be potential opportunity, it identifies the potential for the Exporter (Country) among 190 countries, against the general trade analysis, which identifies the biggest importer or exporter.
To discover high-growth global markets and optimize your business strategy:
Click Here
Pricing
- Single User License$ 1,995
- Department License$ 2,400
- Site License$ 3,120
- Global License$ 3,795

Leadership Perspectives from Industry Events
Search
Thought Leadership and Analyst Meet


Our Clients
6WResearch In News
- India Air Conditioner Market Set for Strong Rebound in 2026 After Weather-Led Correction and GST-Driven Recovery: 6Wresearch
- ADAS in India: How Automatic Emergency Braking, Blind Spot Detection & Driver Monitoring are Transforming Road Safety
- Doha a strategic location for EV manufacturing hub: IPA Qatar
- Demand for luxury TVs surging in the GCC, says Samsung
- Empowering Growth: The Thriving Journey of Bangladesh’s Cable Industry
- Demand for luxury TVs surging in the GCC, says Samsung
Latest Reports
- Poland Fire Protection Systems Market (2026-2032)
- Cape Verde Portable Hand-Thrown Extinguisher Market (2026-2032)
- Canada Portable Hand-Thrown Extinguisher Market (2026-2032)
- Cameroon Portable Hand-Thrown Extinguisher Market (2026-2032)
- Burundi Portable Hand-Thrown Extinguisher Market (2026-2032)
- Burkina Faso Portable Hand-Thrown Extinguisher Market (2026-2032)
- Bulgaria Portable Hand-Thrown Extinguisher Market (2026-2032)
- Brunei Portable Hand-Thrown Extinguisher Market (2026-2032)
- Botswana Portable Hand-Thrown Extinguisher Market (2026-2032)
- Bosnia and Herzegovina Portable Hand-Thrown Extinguisher Market (2026-2032)
Industry Events and Analyst Meet

HIMTEX 2026

India Refining Summit 2026

India EV Show 2026

EV tech India Expo 2026

Auto Tech Asia 2026
Whitepaper
- Middle East & Africa Commercial Security Market Click here to view more.
- Middle East & Africa Fire Safety Systems & Equipment Market Click here to view more.
- GCC Drone Market Click here to view more.
- Middle East Lighting Fixture Market Click here to view more.
- GCC Physical & Perimeter Security Market Click here to view more.