Myanmar Industrial Services Market (2026-2032) | Forecast, Revenue, Share, Companies, Value, Growth, Industry, Analysis, Trends, Outlook & Size
Market Forecast By Type (Engineering and Consulting, Installation and Commissioning, Operational Improvement and Maintenance), By Applications (Distributed Control System (DCS), Programmable Logic Controller (PLC), Supervisory Control and Data Acquisition (SCADA), Electric Motors and Drives, Valves and Actuators, Human Machine Interface (HMI), Manufacturing Execution System (MES), Safety Systems) And Competitive Landscape
| Product Code: ETC036114 | Publication Date: Oct 2020 | Updated Date: Jun 2026 | Product Type: Report | |
| Publisher: 6Wresearch | Author: Ravi Bhandari | No. of Pages: 70 | No. of Figures: 35 | No. of Tables: 5 |
Myanmar Industrial Services Market Summary
The myanmar industrial services market was estimated at USD 207 Million in 2025 and is projected to reach USD 227 Million by 2032, growing at a CAGR of 0.9% from 2026 to 2032.
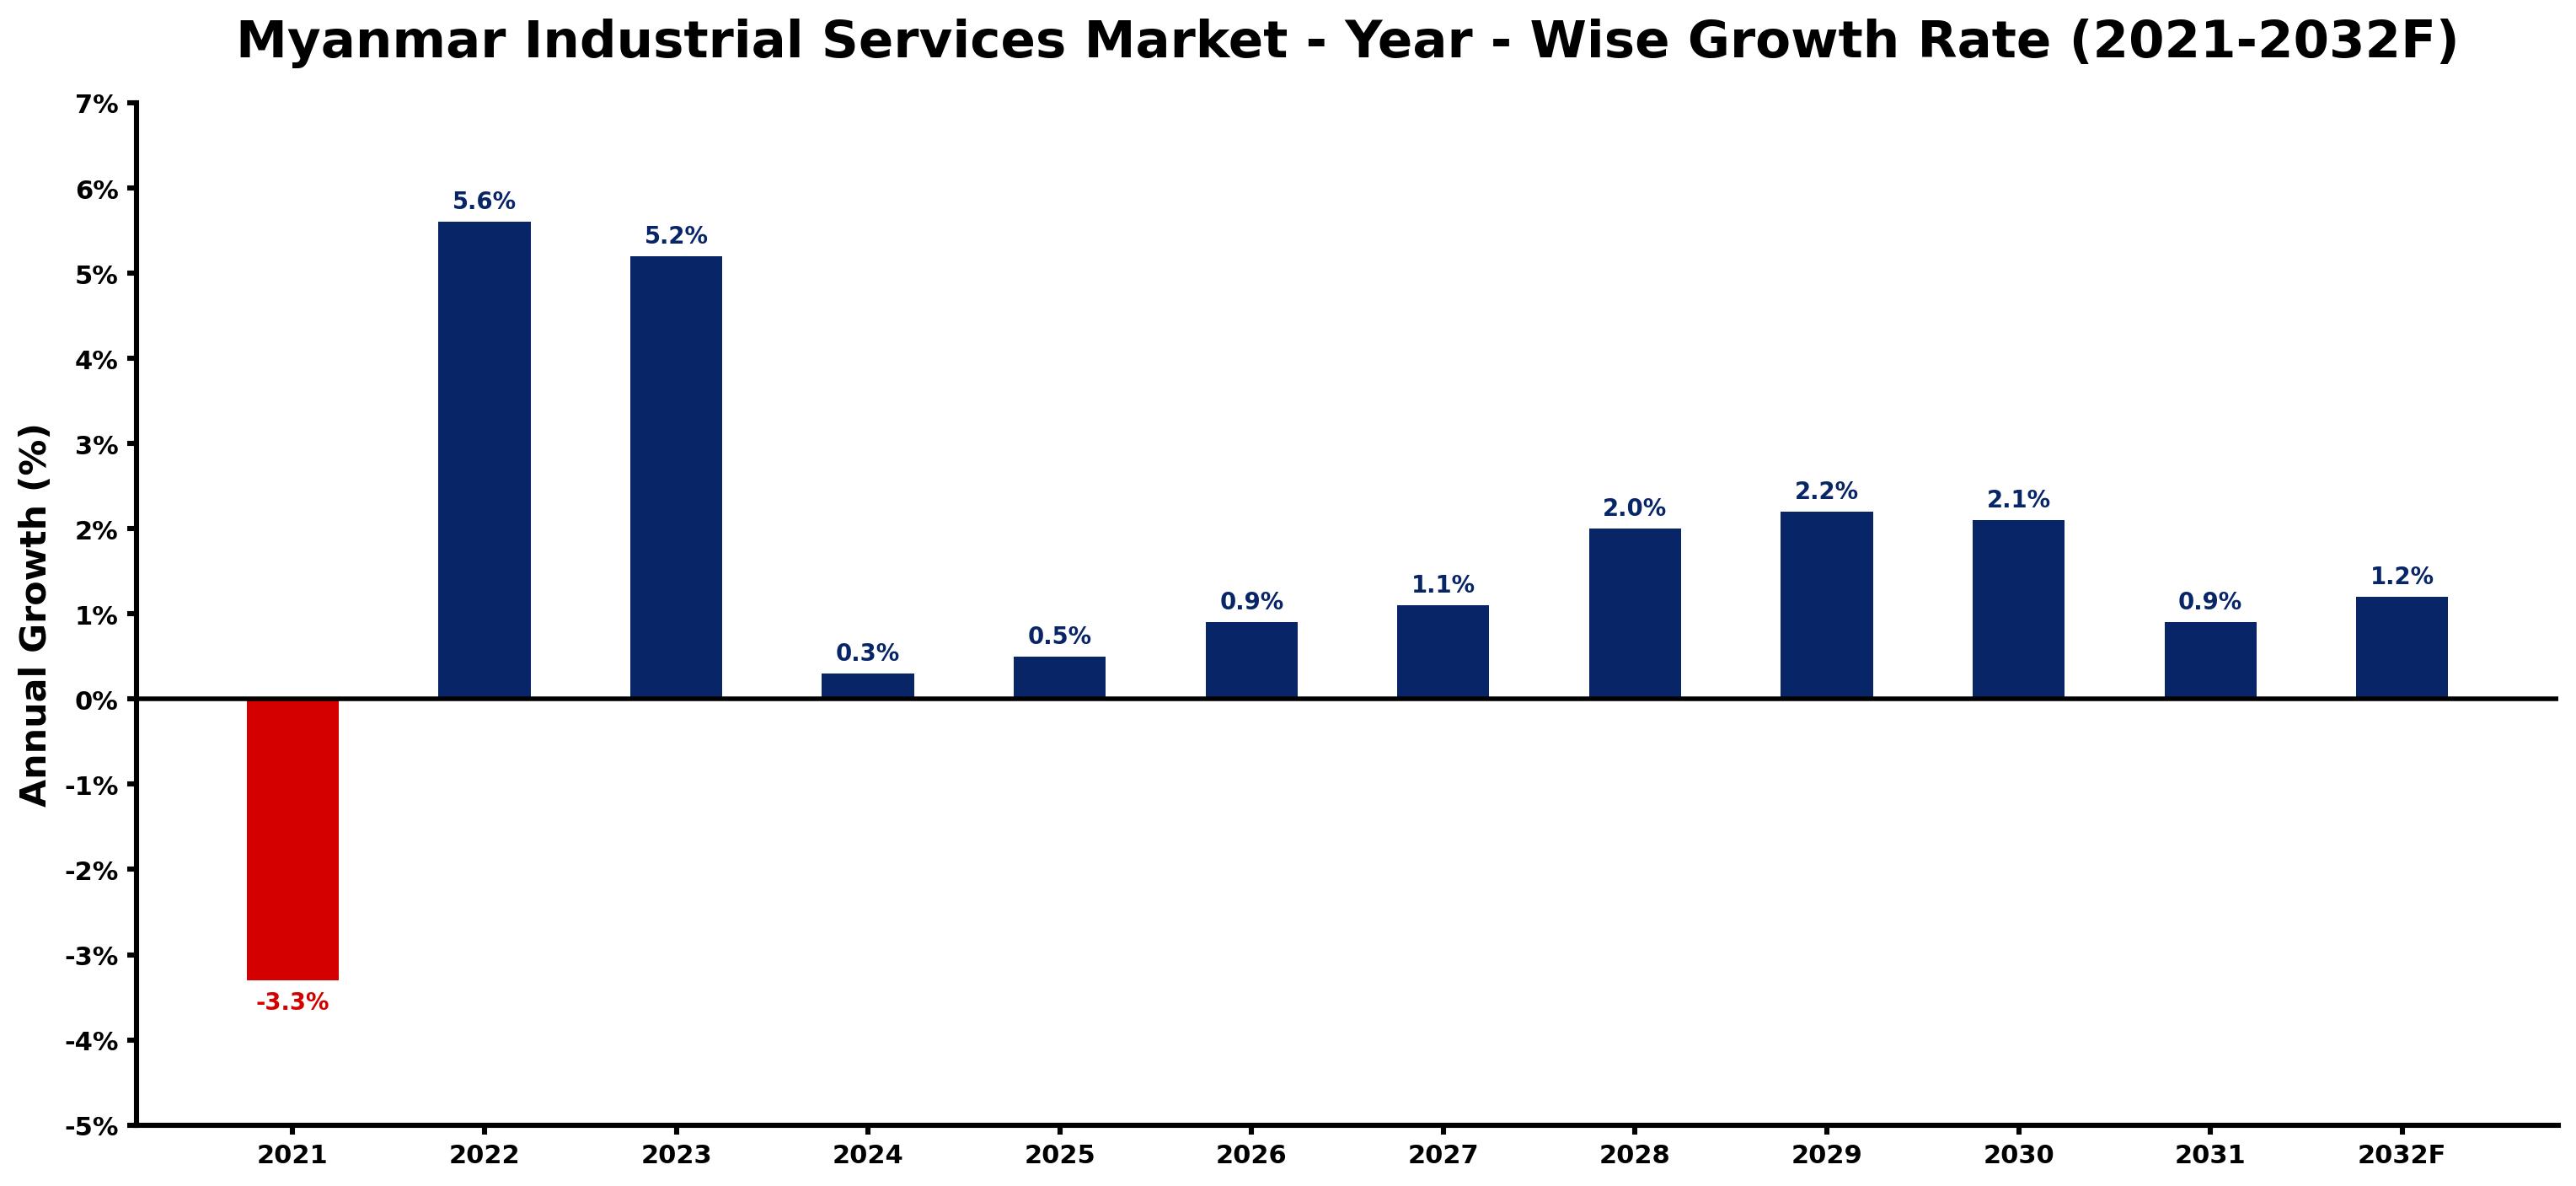
Myanmar Industrial Services Market Growth Rate Analysis (2021-2032)
The Myanmar Industrial Services Market has experienced notable fluctuations in recent years, initially contracting by 3.3% in 2021. However, a rebound began in 2022 with a growth rate of 5.6%, driven by increased foreign investments and infrastructure development amid a rising demand for industrial services. This upward trend has continued, with growth rates of 5.2% in 2023 and projections of modest increases in the following years, indicating a gradual recovery. Factors such as the ongoing energy transition, advancements in technology, and supportive government policies are likely to bolster growth, with expected rates peaking at 2.2% in 2029 before stabilizing. The market is poised to adapt, capitalizing on digitalization and evolving consumer needs.
Myanmar Industrial Services Market Year-wise Growth Rate and Key Drivers
This graph highlights how the Myanmar Industrial Services Market has steadily grown over the past five years, supported by major growth factors.
The table below presents the year wise growth rates along with the key drivers influencing the market
| Year | Growth Rate | Major Drivers |
| 2021 | -3.3% | Increased geopolitical instability deterred foreign investment, significantly hampering growth opportunities in industrial services. |
| 2022 | 5.6% | Investment influx from ASEAN countries enhanced infrastructure development and operational capabilities. |
| 2023 | 5.2% | Emerging local talents are shifting industry focus towards sustainable practices and solutions. |
| 2024 | 0.3% | Collaborations between global firms and local businesses are fostering innovative service offerings. |
| 2025 | 0.5% | Urbanization trends are driving the demand for advanced industrial service solutions. |
| 2026 | 0.9% | Technological integration within industries is reshaping traditional service delivery models. |
| 2027 | 1.1% | Supply chain complexities are prompting enhanced logistics and supply chain management services. |
| 2028 | 2.0% | Increased foreign direct investment is significantly upgrading Myanmar's industrial landscape. |
| 2029 | 2.2% | Local government initiatives aim to strengthen vocational training programs for skilled labor. |
| 2030 | 2.1% | Environmental concerns are pushing businesses towards adopting greener industrial practices. |
| 2031 | 0.9% | Digital transformation strategies are becoming integral to operational efficiency in industries. |
| 2032 | 1.2% | The growth of e-commerce is reshaping service demands across various industrial sectors. |
Note - Market size estimations and growth projections presented in this report are based on 6Wresearch's advanced forecasting approach, validated with industry datasets as of June 2026.
Myanmar Industrial Services Market Synopsis
The Myanmar Industrial Services Market is projected to reach 0.9% and witness significant growth during the forecast period (2026-2032). This market serves as a critical support framework for various industries, encompassing essential services such as maintenance, repair, and technical consulting. As the manufacturing and infrastructure sectors continue to expand, the demand for specialized industrial services is expected to rise, prompting a transformation in operational efficiencies.
Myanmar Industrial Services Market Growth Drivers
The growth of the Myanmar Industrial Services Market is fueled by several key drivers:
- The expansion of the manufacturing sector is a primary driver, leading to increased requirements for maintenance and repair services to ensure continuous operations.
- Infrastructure development plays a critical role, as ongoing projects necessitate technical consulting and operational support to manage complex systems effectively.
- The increasing emphasis on operational efficiency is pushing businesses to adopt specialized services like predictive maintenance and asset management, thereby enhancing productivity.
- Growing awareness of energy optimization practices is encouraging industries to seek services that improve energy efficiency and reduce operational costs.
- The trend towards digital transformation is driving the adoption of advanced industrial services, which include the integration of technology in traditional service offerings.
Myanmar Industrial Services Market Challenges and Restraints
Despite the promising growth prospects, the Myanmar Industrial Services Market faces several challenges:
- A significant skill shortage hampers the industry's ability to meet demand, with a limited pool of qualified technicians affecting service delivery.
- Concerns regarding the quality and reliability of services are prevalent, prompting customers to seek more accountable service providers.
- The lack of standardization in service offerings can lead to inconsistencies, making it difficult for businesses to choose reliable partners.
- Investment in technology and training is required, yet many companies face financial constraints that limit their ability to enhance service capabilities.
- The evolving regulatory landscape can create uncertainty, as businesses must adapt to changing policies that may impact operational procedures and investments.
Myanmar Industrial Services Market Trends and Opportunities
As the Myanmar Industrial Services Market evolves, several trends and opportunities are emerging:
- The rise in automation and IoT technologies is creating new avenues for services that integrate advanced monitoring solutions for industrial equipment.
- Companies are increasingly exploring outsourcing options for their industrial services, providing opportunities for third-party service providers to flourish.
- The adoption of sustainability practices is gaining traction, leading to heightened demand for services focused on environmental compliance and energy efficiency.
- Continued investment in workforce development presents an opportunity for service providers to enhance their service quality through training and certification programs.
- The collaboration between service providers and manufacturers is becoming more common, creating synergies that can improve service delivery and reduce operational bottlenecks.
Myanmar Industrial Services Market Government Investment and Initiatives
The government of Myanmar recognizes the importance of the industrial services sector in enhancing national competitiveness. Initiatives have been introduced to promote investment and growth:
- Policies aimed at improving access to financing for service providers are being implemented, enabling businesses to invest in necessary technology and workforce training.
- Government initiatives focusing on skills development and vocational training programs are designed to address the skill gap within the industrial services sector.
- Collaboration between public and private sectors is being encouraged to foster innovation and service delivery improvements across the market.
- Investment in infrastructure projects is accompanied by a push for enhanced logistics and technical service frameworks, crucial for sustaining industrial growth.
- Efforts to streamline regulatory procedures are underway, aimed at creating a more favorable business environment for service providers to thrive.
Myanmar Industrial Services Market Latest Developments (May 2025 - June 2026)
The recent period has seen significant developments within the Myanmar Industrial Services Market, reflecting a dynamic industry landscape:
- Increased investment in digital technologies has been observed, with many service providers implementing automated systems to enhance operational efficiency.
- Collaborative partnerships between local businesses and international service providers have emerged, bringing advanced expertise and best practices to the market.
- Emerging trends in green technologies are prompting service providers to innovate in offering eco-friendly solutions tailored to client needs.
- The emphasis on predictive maintenance tools has intensified, aligning with the growing recognition of their importance in minimizing downtime and extending the lifecycle of industrial equipment.
- Regulatory adjustments aimed at improving service quality and accountability have been introduced, influencing the operational strategies of service providers across the market.
Myanmar Industrial Services Market - Key Attractiveness of the Report
- 10 Years of Market Numbers
- Historical Data Starting from 2022 to 2025
- Base Year: 2025
- Forecast Data until 2032
- Key Performance Indicators Impacting the Market
- Major Upcoming Developments and Projects
Key Highlights of the Report:
- Myanmar Industrial Services Market Outlook
- Market Size of Myanmar Industrial Services Market, 2025
- Forecast of Myanmar Industrial Services Market, 2032
- Historical Data and Forecast of Myanmar Industrial Services Revenues & Volume for the Period 2022-2032F
- Myanmar Industrial Services Market Trend Evolution
- Myanmar Industrial Services Market Drivers and Challenges
- Myanmar Industrial Services Price Trends
- Myanmar Industrial Services Porter's Five Forces
- Myanmar Industrial Services Industry Life Cycle
- Historical Data and Forecast of Myanmar Industrial Services Market Revenues & Volume By Type for the Period 2022-2032F
- Historical Data and Forecast of Myanmar Industrial Services Market Revenues & Volume By Engineering and Consulting for the Period 2022-2032F
- Historical Data and Forecast of Myanmar Industrial Services Market Revenues & Volume By Installation and Commissioning for the Period 2022-2032F
- Historical Data and Forecast of Myanmar Industrial Services Market Revenues & Volume By Operational Improvement and Maintenance for the Period 2022-2032F
- Historical Data and Forecast of Myanmar Industrial Services Market Revenues & Volume By Applications for the Period 2022-2032F
- Historical Data and Forecast of Myanmar Industrial Services Market Revenues & Volume By Distributed Control System (DCS) for the Period 2022-2032F
- Historical Data and Forecast of Myanmar Industrial Services Market Revenues & Volume By Programmable Logic Controller (PLC) for the Period 2022-2032F
- Historical Data and Forecast of Myanmar Industrial Services Market Revenues & Volume By Supervisory Control and Data Acquisition (SCADA) for the Period 2022-2032F
- Historical Data and Forecast of Myanmar Industrial Services Market Revenues & Volume By Electric Motors and Drives for the Period 2022-2032F
- Historical Data and Forecast of Myanmar Industrial Services Market Revenues & Volume By Valves and Actuators for the Period 2022-2032F
- Historical Data and Forecast of Myanmar Industrial Services Market Revenues & Volume By Human Machine Interface (HMI) for the Period 2022-2032F
- Historical Data and Forecast of Myanmar Industrial Services Market Revenues & Volume By Manufacturing Execution System (MES) for the Period 2022-2032F
- Historical Data and Forecast of Myanmar Industrial Services Market Revenues & Volume By Safety Systems for the Period 2022-2032F
- Myanmar Industrial Services Import Export Trade Statistics
- Market Opportunity Assessment By Type
- Market Opportunity Assessment By Applications
- Myanmar Industrial Services Top Companies Market Share
- Myanmar Industrial Services Competitive Benchmarking By Technical and Operational Parameters
- Myanmar Industrial Services Company Profiles
- Myanmar Industrial Services Key Strategic Recommendations
Frequently Asked Questions About the Market Study (FAQs):
The market is driven by the expansion of manufacturing and infrastructure, increasing operational efficiency, and the demand for specialized services.
Key challenges include skill shortages, service quality issues, and a lack of standardization among service offerings.
The government is implementing policies to improve access to financing, promote skills development, and encourage collaboration between service providers and industries.
Trends include the rise of automation, sustainability practices, and increased outsourcing of industrial services to specialized providers.
6Wresearch actively monitors the Myanmar Industrial Services Market and publishes its comprehensive annual report, highlighting emerging trends, growth drivers, revenue analysis, and forecast outlook. Our insights help businesses to make data-backed strategic decisions with ongoing market dynamics. Our analysts track relevent industries related to the Myanmar Industrial Services Market, allowing our clients with actionable intelligence and reliable forecasts tailored to emerging regional needs.
Yes, we provide customisation as per your requirements. To learn more, feel free to contact us on sales@6wresearch.com
1 Executive Summary |
2 Introduction |
2.1 Key Highlights of the Report |
2.2 Report Description |
2.3 Market Scope & Segmentation |
2.4 Research Methodology |
2.5 Assumptions |
3 Myanmar Industrial Services Market Overview |
3.1 Myanmar Country Macro Economic Indicators |
3.2 Myanmar Industrial Services Market Revenues & Volume, 2022 & 2032F |
3.3 Myanmar Industrial Services Market - Industry Life Cycle |
3.4 Myanmar Industrial Services Market - Porter's Five Forces |
3.5 Myanmar Industrial Services Market Revenues & Volume Share, By Type, 2022 & 2032F |
3.6 Myanmar Industrial Services Market Revenues & Volume Share, By Applications, 2022 & 2032F |
4 Myanmar Industrial Services Market Dynamics |
4.1 Impact Analysis |
4.2 Market Drivers |
4.2.1 Increasing industrialization and infrastructure development in Myanmar |
4.2.2 Growing foreign direct investment (FDI) in the industrial sector |
4.2.3 Government initiatives to promote industrial growth and attract investments |
4.3 Market Restraints |
4.3.1 Limited skilled labor force and technical expertise in the industrial services sector |
4.3.2 Infrastructure challenges such as inadequate transportation and utilities |
4.3.3 Regulatory and bureaucratic hurdles affecting business operations |
5 Myanmar Industrial Services Market Trends |
6 Myanmar Industrial Services Market, By Types |
6.1 Myanmar Industrial Services Market, By Type |
6.1.1 Overview and Analysis |
6.1.2 Myanmar Industrial Services Market Revenues & Volume, By Type, 2022-2032F |
6.1.3 Myanmar Industrial Services Market Revenues & Volume, By Engineering and Consulting, 2022-2032F |
6.1.4 Myanmar Industrial Services Market Revenues & Volume, By Installation and Commissioning, 2022-2032F |
6.1.5 Myanmar Industrial Services Market Revenues & Volume, By Operational Improvement and Maintenance, 2022-2032F |
6.2 Myanmar Industrial Services Market, By Applications |
6.2.1 Overview and Analysis |
6.2.2 Myanmar Industrial Services Market Revenues & Volume, By Distributed Control System (DCS), 2022-2032F |
6.2.3 Myanmar Industrial Services Market Revenues & Volume, By Programmable Logic Controller (PLC), 2022-2032F |
6.2.4 Myanmar Industrial Services Market Revenues & Volume, By Supervisory Control and Data Acquisition (SCADA), 2022-2032F |
6.2.5 Myanmar Industrial Services Market Revenues & Volume, By Electric Motors and Drives, 2022-2032F |
6.2.6 Myanmar Industrial Services Market Revenues & Volume, By Valves and Actuators, 2022-2032F |
6.2.7 Myanmar Industrial Services Market Revenues & Volume, By Human Machine Interface (HMI), 2022-2032F |
6.2.8 Myanmar Industrial Services Market Revenues & Volume, By Safety Systems, 2022-2032F |
6.2.9 Myanmar Industrial Services Market Revenues & Volume, By Safety Systems, 2022-2032F |
7 Myanmar Industrial Services Market Import-Export Trade Statistics |
7.1 Myanmar Industrial Services Market Export to Major Countries |
7.2 Myanmar Industrial Services Market Imports from Major Countries |
8 Myanmar Industrial Services Market Key Performance Indicators |
8.1 Percentage of industrial sector contribution to Myanmar's GDP |
8.2 Number of new industrial projects announced or initiated |
8.3 Average annual growth rate of industrial services sector revenue |
9 Myanmar Industrial Services Market - Opportunity Assessment |
9.1 Myanmar Industrial Services Market Opportunity Assessment, By Type, 2022 & 2032F |
9.2 Myanmar Industrial Services Market Opportunity Assessment, By Applications, 2022 & 2032F |
10 Myanmar Industrial Services Market - Competitive Landscape |
10.1 Myanmar Industrial Services Market Revenue Share, By Companies, 2025 |
10.2 Myanmar Industrial Services Market Competitive Benchmarking, By Operating and Technical Parameters |
11 Company Profiles |
12 Recommendations |
13 Disclaimer |
Global Go To Market Strategy - 2030
Export potential enables firms to identify high-growth global markets with greater confidence by combining advanced trade intelligence with a structured quantitative methodology. The framework analyzes emerging demand trends and country-level import patterns while integrating macroeconomic and trade datasets such as GDP and population forecasts, bilateral import–export flows, tariff structures, elasticity differentials between developed and developing economies, geographic distance, and import demand projections. Using weighted trade values from 2020–2024 as the base period to project country-to-country export potential for 2030, these inputs are operationalized through calculated drivers such as gravity model parameters, tariff impact factors, and projected GDP per-capita growth. Through an analysis of hidden potentials, demand hotspots, and market conditions that are most favorable to success, this method enables firms to focus on target countries, maximize returns, and global expansion with data, backed by accuracy.
By factoring in the projected importer demand gap that is currently unmet and could be potential opportunity, it identifies the potential for the Exporter (Country) among 190 countries, against the general trade analysis, which identifies the biggest importer or exporter.
To discover high-growth global markets and optimize your business strategy:
Click Here
Pricing
- Single User License$ 1,995
- Department License$ 2,400
- Site License$ 3,120
- Global License$ 3,795

Leadership Perspectives from Industry Events
Search
Thought Leadership and Analyst Meet


Our Clients
6WResearch In News
- India Air Conditioner Market Set for Strong Rebound in 2026 After Weather-Led Correction and GST-Driven Recovery: 6Wresearch
- ADAS in India: How Automatic Emergency Braking, Blind Spot Detection & Driver Monitoring are Transforming Road Safety
- Doha a strategic location for EV manufacturing hub: IPA Qatar
- Demand for luxury TVs surging in the GCC, says Samsung
- Empowering Growth: The Thriving Journey of Bangladesh’s Cable Industry
- Demand for luxury TVs surging in the GCC, says Samsung
Latest Reports
- Poland Fire Protection Systems Market (2026-2032)
- Cape Verde Portable Hand-Thrown Extinguisher Market (2026-2032)
- Canada Portable Hand-Thrown Extinguisher Market (2026-2032)
- Cameroon Portable Hand-Thrown Extinguisher Market (2026-2032)
- Burundi Portable Hand-Thrown Extinguisher Market (2026-2032)
- Burkina Faso Portable Hand-Thrown Extinguisher Market (2026-2032)
- Bulgaria Portable Hand-Thrown Extinguisher Market (2026-2032)
- Brunei Portable Hand-Thrown Extinguisher Market (2026-2032)
- Botswana Portable Hand-Thrown Extinguisher Market (2026-2032)
- Bosnia and Herzegovina Portable Hand-Thrown Extinguisher Market (2026-2032)
Industry Events and Analyst Meet

HIMTEX 2026

India Refining Summit 2026

India EV Show 2026

EV tech India Expo 2026

Auto Tech Asia 2026
Whitepaper
- Middle East & Africa Commercial Security Market Click here to view more.
- Middle East & Africa Fire Safety Systems & Equipment Market Click here to view more.
- GCC Drone Market Click here to view more.
- Middle East Lighting Fixture Market Click here to view more.
- GCC Physical & Perimeter Security Market Click here to view more.