Myanmar Notebooks & Writing Pads Market (2026-2032) | Analysis, Size, Value, Industry, Revenue, Companies, Forecast, Growth, Trends, Share, Outlook
Market Forecast By Distribution Channels (Online, Offline), By Applications (Corporate Office, Educational Institutes), By Product Types (Writing Pads, Paper Notebooks) And Competitive Landscape
| Product Code: ETC006534 | Publication Date: Sep 2020 | Updated Date: Jun 2026 | Product Type: Report | |
| Publisher: 6Wresearch | Author: Ravi Bhandari | No. of Pages: 70 | No. of Figures: 35 | No. of Tables: 5 |
Myanmar Notebooks & Writing Pads Market Summary
The myanmar notebooks & writing pads market was estimated at USD 282 Million in 2025 and is projected to reach USD 381 Million by 2032, growing at a CAGR of 5.1% from 2026 to 2032.
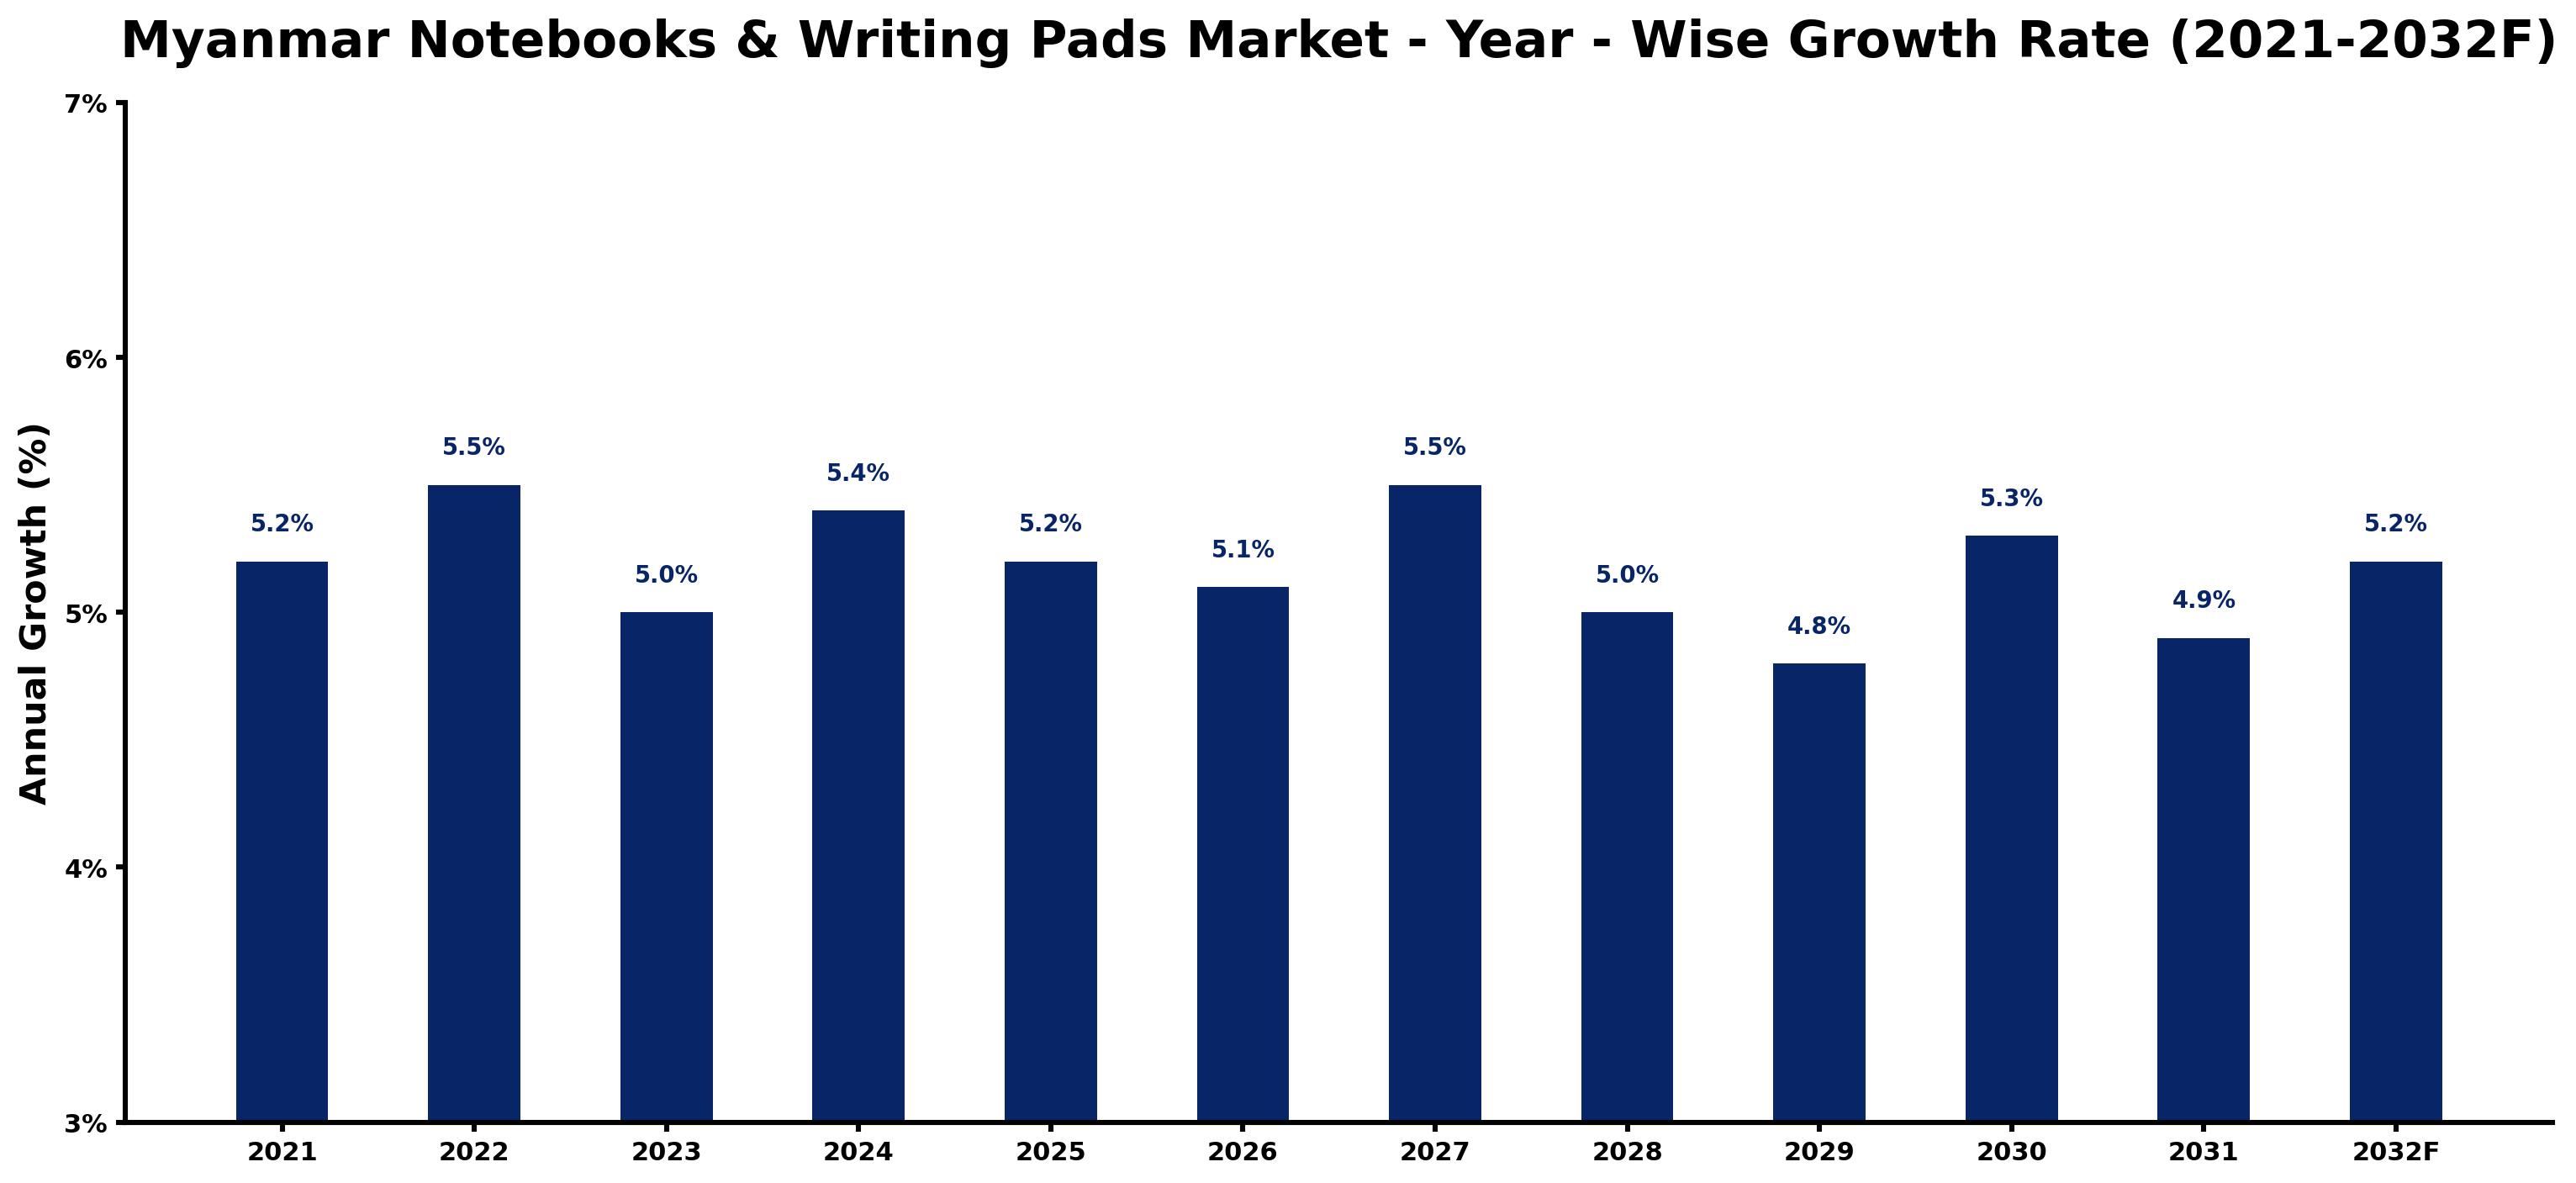
Myanmar Notebooks & Writing Pads Market Growth Rate Analysis (2021-2032)
The Myanmar notebooks and writing pads market has seen stable growth rates, albeit with slight fluctuations over the years. From a solid 5.2% in 2021, the market grew to 5.5% in 2022, driven by increased consumer demand stemming from a rising focus on education and personal creativity. Growth softened to 5.0% in 2023 due to supply chain challenges, but rebounded to 5.4% in 2024 as domestic production improved. The following years show a similar pattern, with rates hovering around 5%, reflecting consistent investments in local manufacturing and increased digitalization among competitors. However, as trends indicate a gradual slowdown, stakeholders must remain agile to capitalize on emerging opportunities.
Myanmar Notebooks & Writing Pads Market Year-wise Growth Rate and Key Drivers
This graph highlights how the Myanmar Notebooks & Writing Pads Market has steadily grown over the past five years, supported by major growth factors.
The table below presents the year wise growth rates along with the key drivers influencing the market
| Year | Growth Rate | Major Drivers |
| 2021 | 5.2% | Post-pandemic recovery saw a surge in educational materials demand across Myanmar. |
| 2022 | 5.5% | Increased urbanization led to higher retail outlet accessibility for stationery products. |
| 2023 | 5.0% | Economic stabilization encouraged local manufacturers to enhance production capabilities significantly. |
| 2024 | 5.4% | Rising literacy rates cultivated a new generation of avid learners and writers. |
| 2025 | 5.2% | E-commerce platforms gained traction, making notebooks widely available across remote areas. |
| 2026 | 5.1% | Local artisans began creating unique, culturally relevant designs appealing to consumers. |
| 2027 | 5.5% | Educational reforms emphasized creative learning, boosting interest in writing materials. |
| 2028 | 5.0% | Sustainable materials became a focus, attracting environmentally conscious consumers to the market. |
| 2029 | 4.8% | Corporate gifting trends embraced high-quality notebooks, expanding the premium segment rapidly. |
| 2030 | 5.3% | Youth culture embraced personalized stationery, driving demand for customized writing pads. |
| 2031 | 4.9% | Digital nomad trends fostered a need for portable, functional writing solutions. |
| 2032 | 5.2% | Continued investments in education infrastructure supported consistent demand for notebooks. |
Note - Market size estimations and growth projections presented in this report are based on 6Wresearch's advanced forecasting approach, validated with industry datasets as of June 2026.
Key Highlights of the Report:
- Myanmar Notebooks & Writing Pads Market Outlook
- Market Size of Myanmar Notebooks & Writing Pads Market, 2025
- Forecast of Myanmar Notebooks & Writing Pads Market, 2032F
- Historical Data and Forecast of Myanmar Notebooks & Writing Pads Revenues & Volume for the Period 2022-2032F
- Myanmar Notebooks & Writing Pads Market Trend Evolution
- Myanmar Notebooks & Writing Pads Market Drivers and Challenges
- Myanmar Notebooks & Writing Pads Price Trends
- Myanmar Notebooks & Writing Pads Porter's Five Forces
- Myanmar Notebooks & Writing Pads Industry Life Cycle
- Historical Data and Forecast of Myanmar Notebooks & Writing Pads Market Revenues & Volume By Distribution Channels for the Period 2022-2032F
- Historical Data and Forecast of Myanmar Notebooks & Writing Pads Market Revenues & Volume By Online for the Period 2022-2032F
- Historical Data and Forecast of Myanmar Notebooks & Writing Pads Market Revenues & Volume By Offline for the Period 2022-2032F
- Historical Data and Forecast of Myanmar Notebooks & Writing Pads Market Revenues & Volume By Applications for the Period 2022-2032F
- Historical Data and Forecast of Myanmar Notebooks & Writing Pads Market Revenues & Volume By Corporate Office for the Period 2022-2032F
- Historical Data and Forecast of Myanmar Notebooks & Writing Pads Market Revenues & Volume By Educational Institutes for the Period 2022-2032F
- Historical Data and Forecast of Myanmar Notebooks & Writing Pads Market Revenues & Volume By Product Types for the Period 2022-2032F
- Historical Data and Forecast of Myanmar Notebooks & Writing Pads Market Revenues & Volume By Writing Pads for the Period 2022-2032F
- Historical Data and Forecast of Myanmar Notebooks & Writing Pads Market Revenues & Volume By Paper Notebooks for the Period 2022-2032F
- Myanmar Notebooks & Writing Pads Import Export Trade Statistics
- Market Opportunity Assessment By Distribution Channels
- Market Opportunity Assessment By Applications
- Market Opportunity Assessment By Product Types
- Myanmar Notebooks & Writing Pads Top Companies Market Share
- Myanmar Notebooks & Writing Pads Competitive Benchmarking By Technical and Operational Parameters
- Myanmar Notebooks & Writing Pads Company Profiles
- Myanmar Notebooks & Writing Pads Key Strategic Recommendations
Frequently Asked Questions About the Market Study (FAQs):
6Wresearch actively monitors the Myanmar Notebooks & Writing Pads Market and publishes its comprehensive annual report, highlighting emerging trends, growth drivers, revenue analysis, and forecast outlook. Our insights help businesses to make data-backed strategic decisions with ongoing market dynamics. Our analysts track relevent industries related to the Myanmar Notebooks & Writing Pads Market, allowing our clients with actionable intelligence and reliable forecasts tailored to emerging regional needs.
Yes, we provide customisation as per your requirements. To learn more, feel free to contact us on sales@6wresearch.com
1 Executive Summary |
2 Introduction |
2.1 Key Highlights of the Report |
2.2 Report Description |
2.3 Market Scope & Segmentation |
2.4 Research Methodology |
2.5 Assumptions |
3 Myanmar Notebooks & Writing Pads Market Overview |
3.1 Myanmar Country Macro Economic Indicators |
3.2 Myanmar Notebooks & Writing Pads Market Revenues & Volume, 2022 & 2032F |
3.3 Myanmar Notebooks & Writing Pads Market - Industry Life Cycle |
3.4 Myanmar Notebooks & Writing Pads Market - Porter's Five Forces |
3.5 Myanmar Notebooks & Writing Pads Market Revenues & Volume Share, By Distribution Channels, 2022 & 2032F |
3.6 Myanmar Notebooks & Writing Pads Market Revenues & Volume Share, By Applications, 2022 & 2032F |
3.7 Myanmar Notebooks & Writing Pads Market Revenues & Volume Share, By Product Types, 2022 & 2032F |
4 Myanmar Notebooks & Writing Pads Market Dynamics |
4.1 Impact Analysis |
4.2 Market Drivers |
4.3 Market Restraints |
5 Myanmar Notebooks & Writing Pads Market Trends |
6 Myanmar Notebooks & Writing Pads Market, By Types |
6.1 Myanmar Notebooks & Writing Pads Market, By Distribution Channels |
6.1.1 Overview and Analysis |
6.1.2 Myanmar Notebooks & Writing Pads Market Revenues & Volume, By Distribution Channels, 2022 - 2032F |
6.1.3 Myanmar Notebooks & Writing Pads Market Revenues & Volume, By Online, 2022 - 2032F |
6.1.4 Myanmar Notebooks & Writing Pads Market Revenues & Volume, By Offline, 2022 - 2032F |
6.2 Myanmar Notebooks & Writing Pads Market, By Applications |
6.2.1 Overview and Analysis |
6.2.2 Myanmar Notebooks & Writing Pads Market Revenues & Volume, By Corporate Office, 2022 - 2032F |
6.2.3 Myanmar Notebooks & Writing Pads Market Revenues & Volume, By Educational Institutes, 2022 - 2032F |
6.3 Myanmar Notebooks & Writing Pads Market, By Product Types |
6.3.1 Overview and Analysis |
6.3.2 Myanmar Notebooks & Writing Pads Market Revenues & Volume, By Writing Pads, 2022 - 2032F |
6.3.3 Myanmar Notebooks & Writing Pads Market Revenues & Volume, By Paper Notebooks, 2022 - 2032F |
7 Myanmar Notebooks & Writing Pads Market Import-Export Trade Statistics |
7.1 Myanmar Notebooks & Writing Pads Market Export to Major Countries |
7.2 Myanmar Notebooks & Writing Pads Market Imports from Major Countries |
8 Myanmar Notebooks & Writing Pads Market Key Performance Indicators |
9 Myanmar Notebooks & Writing Pads Market - Opportunity Assessment |
9.1 Myanmar Notebooks & Writing Pads Market Opportunity Assessment, By Distribution Channels, 2022 & 2032F |
9.2 Myanmar Notebooks & Writing Pads Market Opportunity Assessment, By Applications, 2022 & 2032F |
9.3 Myanmar Notebooks & Writing Pads Market Opportunity Assessment, By Product Types, 2022 & 2032F |
10 Myanmar Notebooks & Writing Pads Market - Competitive Landscape |
10.1 Myanmar Notebooks & Writing Pads Market Revenue Share, By Companies, 2025 |
10.2 Myanmar Notebooks & Writing Pads Market Competitive Benchmarking, By Operating and Technical Parameters |
11 Company Profiles |
12 Recommendations |
13 Disclaimer |
Global Go To Market Strategy - 2030
Export potential enables firms to identify high-growth global markets with greater confidence by combining advanced trade intelligence with a structured quantitative methodology. The framework analyzes emerging demand trends and country-level import patterns while integrating macroeconomic and trade datasets such as GDP and population forecasts, bilateral import–export flows, tariff structures, elasticity differentials between developed and developing economies, geographic distance, and import demand projections. Using weighted trade values from 2020–2024 as the base period to project country-to-country export potential for 2030, these inputs are operationalized through calculated drivers such as gravity model parameters, tariff impact factors, and projected GDP per-capita growth. Through an analysis of hidden potentials, demand hotspots, and market conditions that are most favorable to success, this method enables firms to focus on target countries, maximize returns, and global expansion with data, backed by accuracy.
By factoring in the projected importer demand gap that is currently unmet and could be potential opportunity, it identifies the potential for the Exporter (Country) among 190 countries, against the general trade analysis, which identifies the biggest importer or exporter.
To discover high-growth global markets and optimize your business strategy:
Click Here
Pricing
- Single User License$ 1,995
- Department License$ 2,400
- Site License$ 3,120
- Global License$ 3,795

Leadership Perspectives from Industry Events
Search
Thought Leadership and Analyst Meet


Our Clients
6WResearch In News
- India Air Conditioner Market Set for Strong Rebound in 2026 After Weather-Led Correction and GST-Driven Recovery: 6Wresearch
- ADAS in India: How Automatic Emergency Braking, Blind Spot Detection & Driver Monitoring are Transforming Road Safety
- Doha a strategic location for EV manufacturing hub: IPA Qatar
- Demand for luxury TVs surging in the GCC, says Samsung
- Empowering Growth: The Thriving Journey of Bangladesh’s Cable Industry
- Demand for luxury TVs surging in the GCC, says Samsung
Latest Reports
- Poland Fire Protection Systems Market (2026-2032)
- Cape Verde Portable Hand-Thrown Extinguisher Market (2026-2032)
- Canada Portable Hand-Thrown Extinguisher Market (2026-2032)
- Cameroon Portable Hand-Thrown Extinguisher Market (2026-2032)
- Burundi Portable Hand-Thrown Extinguisher Market (2026-2032)
- Burkina Faso Portable Hand-Thrown Extinguisher Market (2026-2032)
- Bulgaria Portable Hand-Thrown Extinguisher Market (2026-2032)
- Brunei Portable Hand-Thrown Extinguisher Market (2026-2032)
- Botswana Portable Hand-Thrown Extinguisher Market (2026-2032)
- Bosnia and Herzegovina Portable Hand-Thrown Extinguisher Market (2026-2032)
Industry Events and Analyst Meet

HIMTEX 2026

India Refining Summit 2026

India EV Show 2026

EV tech India Expo 2026

Auto Tech Asia 2026
Whitepaper
- Middle East & Africa Commercial Security Market Click here to view more.
- Middle East & Africa Fire Safety Systems & Equipment Market Click here to view more.
- GCC Drone Market Click here to view more.
- Middle East Lighting Fixture Market Click here to view more.
- GCC Physical & Perimeter Security Market Click here to view more.