Myanmar Television Market (2026-2032) | Size, Growth, Share, Outlook, Revenue, Value, Industry, Trends, Companies, Forecast & Analysis
Market Forecast By Resolution (LCD TVs, OLED TVs), By Types (2D TVs, 3D TVs) And Competitive Landscape
| Product Code: ETC036654 | Publication Date: Oct 2020 | Updated Date: Jun 2026 | Product Type: Report | |
| Publisher: 6Wresearch | Author: Vasudha | No. of Pages: 70 | No. of Figures: 35 | No. of Tables: 5 |
Myanmar Television Market Summary
The myanmar television market was estimated at USD 330 Million in 2025 and is projected to reach USD 600 Million by 2032, growing at a CAGR of 10.3% from 2026 to 2032.
Myanmar Television Market Growth Rate Analysis (2021-2032)
The Myanmar television market is experiencing robust growth, marked by an impressive increase in annual growth rates, reaching 9.1% in 2023 and projected to climb to 12.7% by 2032. This upward trend is largely driven by rising consumer demand for diverse content and enhanced viewing experiences, alongside significant investments in digital infrastructure. As the country embraces digitalization, broadcasters are adopting advanced technologies which resonate well with the younger demographic. Furthermore, favorable government policies aimed at boosting the media sector have facilitated greater access to television services. As a result, the market's evolution reflects a vibrant landscape where both traditional and emerging platforms thrive, contributing to its strong growth trajectory.
Myanmar Television Market Year-wise Growth Rate and Key Drivers
This graph highlights how the Myanmar Television Market has steadily grown over the past five years, supported by major growth factors.
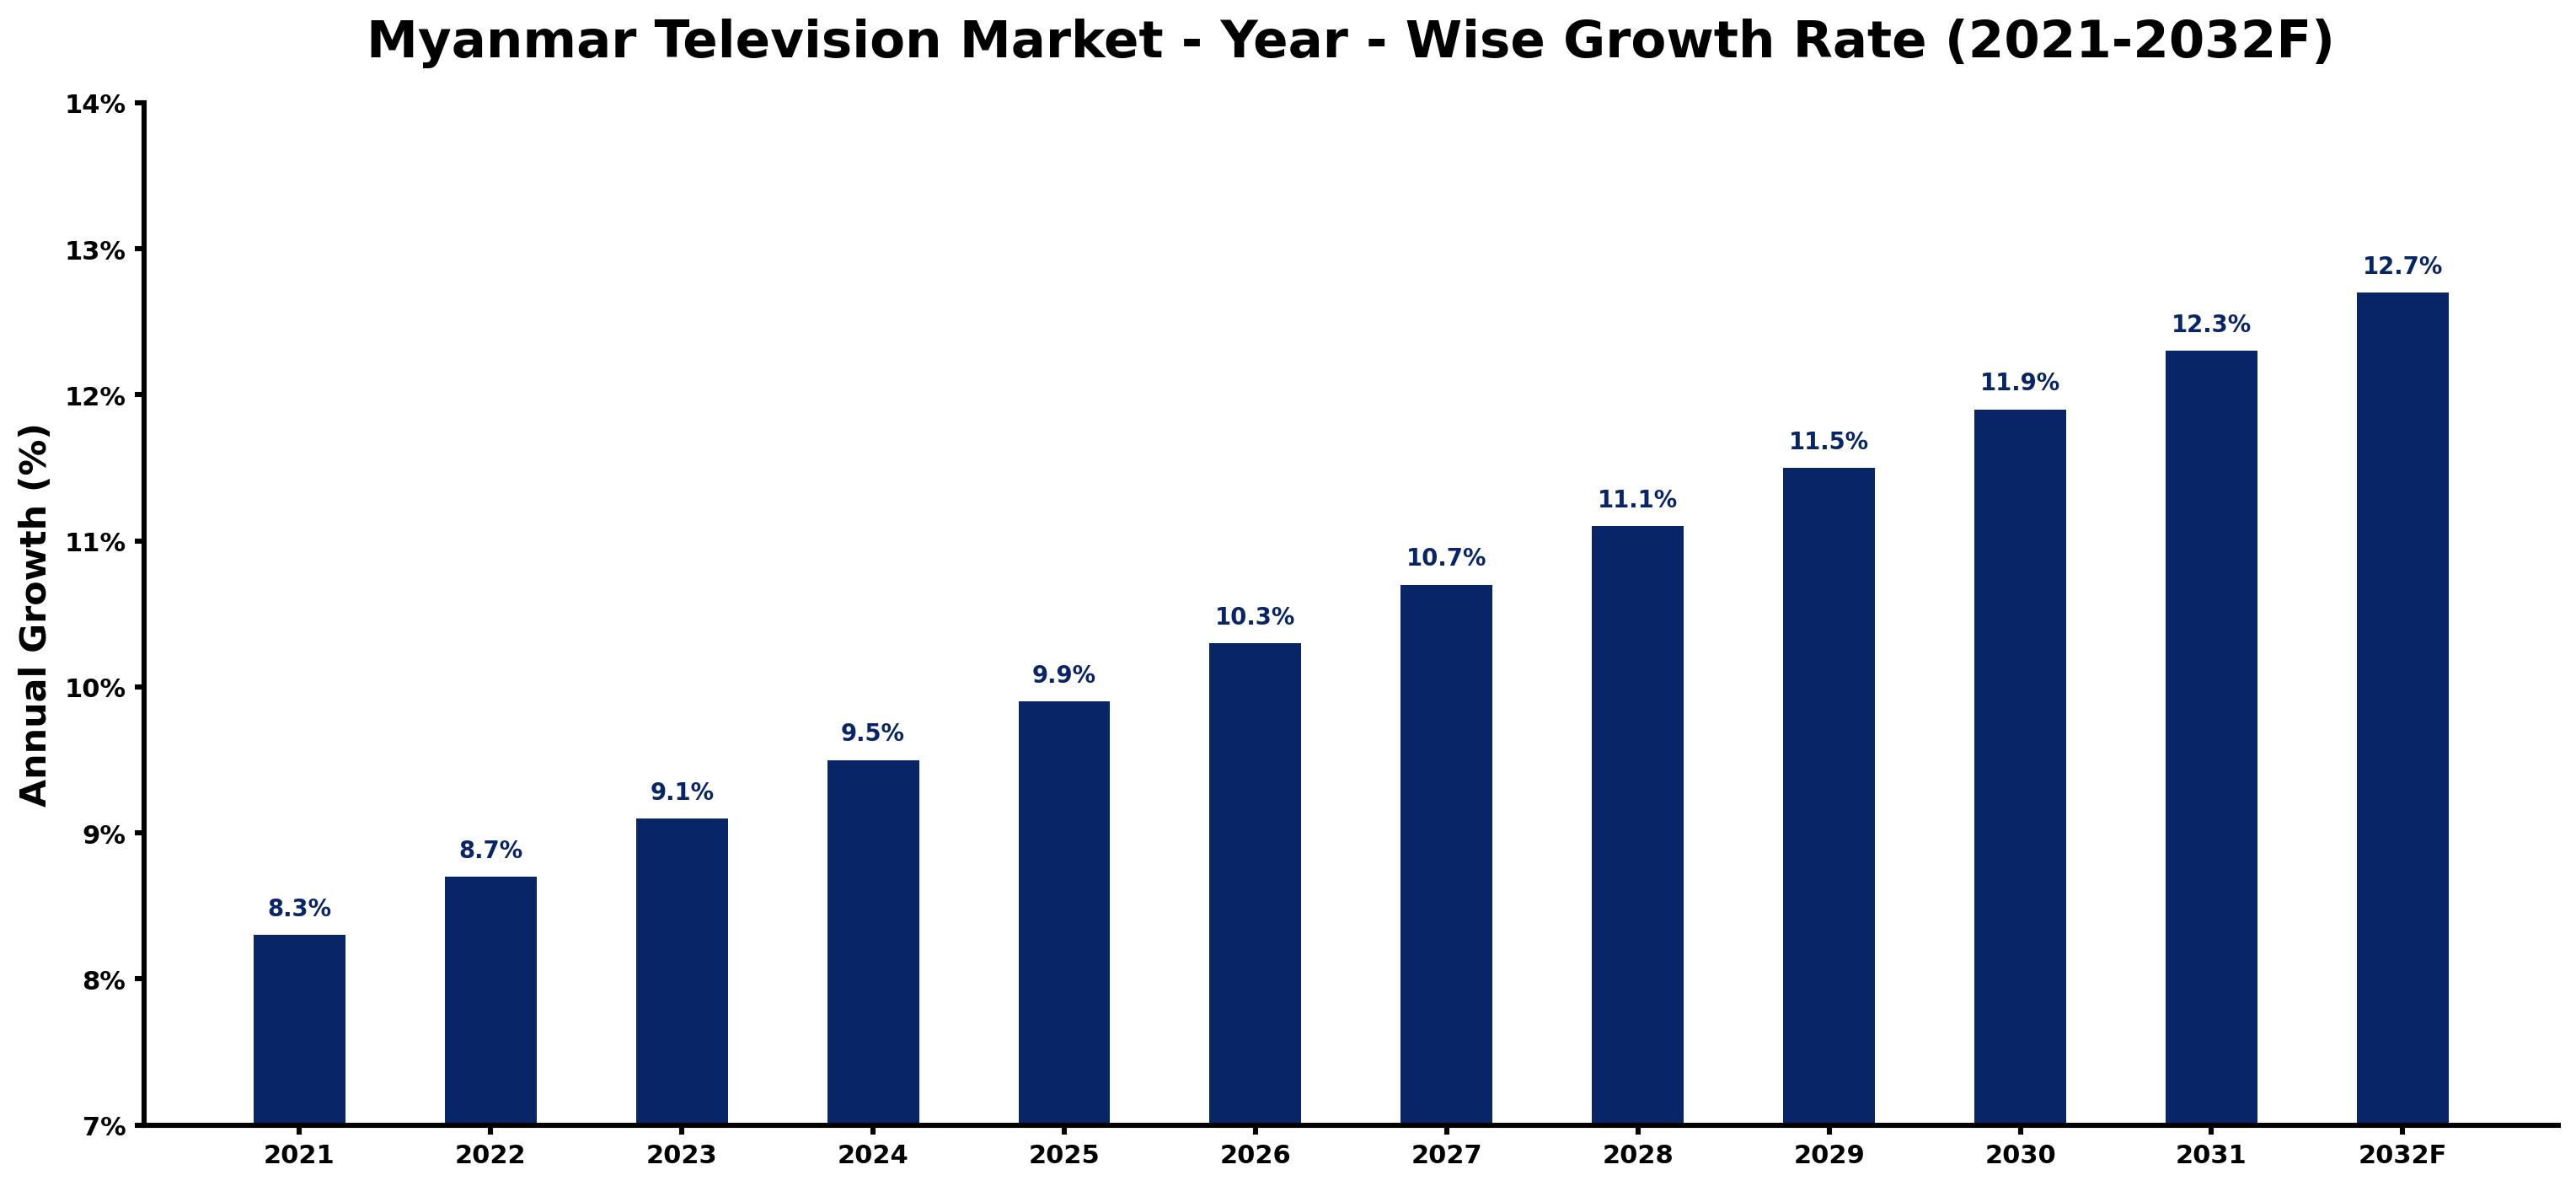
The table below presents the year wise growth rates along with the key drivers influencing the market
| Year | Growth Rate | Major Drivers |
| 2021 | 8.3% | Television viewership remains robust as cultural programming captures diverse audiences. |
| 2022 | 8.7% | Increased smartphone penetration fuels demand for mobile streaming services among millennials. |
| 2023 | 9.1% | Localized content creation gains traction, appealing to ethnic and regional groups. |
| 2024 | 9.5% | Partnerships with international networks enhance content variety and quality significantly. |
| 2025 | 9.9% | Digital advertising expenditures shift focus towards TV platforms, boosting revenue streams. |
| 2026 | 10.3% | Emerging OTT platforms disrupt traditional cable, reconfiguring viewer consumption patterns widely. |
| 2027 | 10.7% | Infrastructure improvements expand reach, allowing remote areas access to television services. |
| 2028 | 11.1% | Interactive television experiences emerge, engaging audiences and enhancing viewer retention rates. |
| 2029 | 11.5% | Content diversification incorporates health and education, addressing societal needs effectively. |
| 2030 | 11.9% | Youth-driven trends influence programming, prompting channels to innovate with fresh formats. |
| 2031 | 12.3% | Increased competition among broadcasters elevates production quality across the television landscape. |
| 2032 | 12.7% | Sustainability practices in production resonate with environmentally conscious viewers, shaping content. |
Note - Market size estimations and growth projections presented in this report are based on 6Wresearch's advanced forecasting approach, validated with industry datasets as of June 2026.
Myanmar Television Market Synopsis
The Myanmar Television Market is projected to reach 10.3% and witness significant growth during the forecast period (2026-2032). This market has experienced noteworthy expansion in recent years, primarily fueled by increasing disposable incomes, advancements in digital infrastructure, and a burgeoning middle-class population. The landscape is marked by a preponderance of free-to-air channels, complemented by a handful of pay-TV operators that provide a blend of local and international programming.
Myanmar Television Market Growth Drivers
Several key factors are driving the growth of the Myanmar television market:
- Rising disposable income levels across various demographic segments have significantly heightened consumer spending on entertainment, including television services.
- The proliferation of digital infrastructure throughout urban and rural areas is facilitating better access to television services and enhancing viewer experiences.
- The local middle class is expanding, creating a larger audience that demands diverse programming options, including both local and international content.
- The growing popularity of over-the-top (OTT) platforms is reshaping content consumption patterns, as viewers increasingly gravitate towards on-demand options that suit their schedules.
- Television serves as a significant medium for advertisers seeking to reach broad audiences, leading to increased investment in advertising budgets directed at the television sector.
Myanmar Television Market Trends and Opportunities
The landscape of the Myanmar television market is evolving, with notable trends emerging in content consumption and technology:
- An increasing number of consumers are favoring smart TVs and streaming services, which presents an opportunity for content providers to tailor offerings to tech-savvy audiences.
- Local content production is witnessing a resurgence, as there is a growing desire among viewers for programming that resonates with their cultural backgrounds and narratives.
- The demand for high-definition (HD) and 4K resolution televisions is escalating, prompting manufacturers to introduce advanced models that enhance the overall viewing experience.
- Strategic partnerships between content providers and television manufacturers are increasing, setting the stage for innovative content delivery methods that can engage consumers.
- As the market matures, niche content offerings targeting specific demographics are emerging as lucrative avenues, catering to diverse viewer preferences.
Myanmar Television Market Challenges and Restraints
Despite the promising growth outlook, the Myanmar television market faces several challenges that may impede its progress:
- Regulatory constraints imposed by the government create significant barriers to entry, including licensing restrictions, censorship, and limitations on foreign ownership.
- Infrastructure issues, particularly in rural areas, pose challenges for broadcasting capabilities and the widespread adoption of advanced television services.
- High import taxes on electronic goods render televisions expensive for the average consumer, potentially stunting market growth.
- Censorship laws and the requirement to adhere to national values can limit creative expression in program content, potentially leading to viewer dissatisfaction.
- The evolving competitive landscape may pressure existing players to innovate continuously to retain market share, increasing the operational burden on companies.
Myanmar Television Market Investment Opportunities
The Myanmar television market offers a range of investment opportunities for stakeholders looking to tap into a dynamic and rapidly evolving environment:
- Investing in local production companies or content studios can help capitalize on the growing demand for culturally relevant programming that resonates with Myanmar audiences.
- Opportunities exist for investment in technology infrastructure aimed at enhancing broadcasting quality and enabling broader audience engagement.
- Partnerships with local broadcasters can facilitate market entry, leveraging established networks to reach consumers more effectively.
- Investing in marketing strategies that highlight unique content offerings may help stand out in an increasingly crowded marketplace.
- As demand for high-definition content rises, investments in advanced technology and production capabilities can enhance viewer experiences and drive customer loyalty.
Myanmar Television Market Government Investment and Initiatives
Government policies play a pivotal role in shaping the landscape of the Myanmar Television Market. The Ministry of Information oversees the regulation of content and licensing, which significantly impacts operational frameworks.
Public spending initiatives aimed at improving infrastructure, especially in underdeveloped regions, are critical for expanding access to television services. Various development plans have been introduced to enhance digital connectivity, ensuring broader reach for service providers.
The government encourages local content production as part of cultural preservation efforts, providing incentives for broadcasters who prioritize indigenous programming. Such initiatives aim to promote domestic talent and storytelling, thereby fortifying national identity.
At the same time, regulations regarding foreign ownership are stringent, fostering a preference for locally-owned channels. This regulatory landscape aims to ensure that media narratives reflect national values.
Myanmar Television Market Latest Developments (May 2025 - June 2026)
Recent developments in the Myanmar television market reflect significant trends as of mid-2026. Stakeholders are increasingly focusing on digital content strategies, with many broadcasters evaluating their approaches to incorporate streaming services alongside traditional broadcasting.
There has been a noticeable uptick in the production of local television content, as networks respond to viewer desires for programs that resonate with cultural themes. Meanwhile, partnerships between broadcasters and technology firms are emerging to enhance the digital viewing experience.
Furthermore, discussions surrounding regulatory reforms suggest that the government may consider easing certain restrictions on content and broadcasting licenses, a shift that could have profound implications for market dynamics.
Efforts to bolster internet infrastructure are also underway, with government-backed initiatives aimed at improving connectivity, thereby facilitating greater access to both traditional and OTT content.
Myanmar Television Market - Key Attractiveness of the Report
- 10 Years of Market Numbers
- Historical Data Starting from 2022 to 2025
- Base Year: 2025
- Forecast Data until 2032
- Key Performance Indicators Impacting the Market
- Major Upcoming Developments and Projects
Key Highlights of the Report:
- Myanmar Television Market Outlook
- Market Size of Myanmar Television Market, 2025
- Forecast of Myanmar Television Market, 2032F
- Historical Data and Forecast of Myanmar Television Revenues & Volume for the Period 2022-2032F
- Myanmar Television Market Trend Evolution
- Myanmar Television Market Drivers and Challenges
- Myanmar Television Price Trends
- Myanmar Television Porter's Five Forces
- Myanmar Television Industry Life Cycle
- Historical Data and Forecast of Myanmar Television Market Revenues & Volume By Resolution for the Period 2022-2032F
- Historical Data and Forecast of Myanmar Television Market Revenues & Volume By LCD TVs for the Period 2022-2032F
- Historical Data and Forecast of Myanmar Television Market Revenues & Volume By OLED TVs for the Period 2022-2032F
- Historical Data and Forecast of Myanmar Television Market Revenues & Volume By Types for the Period 2022-2032F
- Historical Data and Forecast of Myanmar Television Market Revenues & Volume By 2D TVs for the Period 2022-2032F
- Historical Data and Forecast of Myanmar Television Market Revenues & Volume By 3D TVs for the Period 2022-2032F
- Myanmar Television Import Export Trade Statistics
- Market Opportunity Assessment By Resolution
- Market Opportunity Assessment By Types
- Myanmar Television Top Companies Market Share
- Myanmar Television Competitive Benchmarking By Technical and Operational Parameters
- Myanmar Television Company Profiles
- Myanmar Television Key Strategic Recommendations
Frequently Asked Questions About the Market Study (FAQs):
The growth is driven by rising disposable incomes, improved digital infrastructure, and a growing middle class, leading to increased demand for both local and international content.
Challenges include stringent regulatory frameworks, infrastructure limitations, high import taxes, and censorship laws that restrict content diversity.
Opportunities include investments in local content production, technology infrastructure, partnerships with broadcasters, and marketing strategies focused on unique programming.
The government regulates content and broadcasting licenses through the Ministry of Information, promoting local programming while imposing restrictions on foreign ownership to maintain control over media narratives.
6Wresearch actively monitors the Myanmar Television Market and publishes its comprehensive annual report, highlighting emerging trends, growth drivers, revenue analysis, and forecast outlook. Our insights help businesses to make data-backed strategic decisions with ongoing market dynamics. Our analysts track relevent industries related to the Myanmar Television Market, allowing our clients with actionable intelligence and reliable forecasts tailored to emerging regional needs.
Yes, we provide customisation as per your requirements. To learn more, feel free to contact us on sales@6wresearch.com
1 Executive Summary |
2 Introduction |
2.1 Key Highlights of the Report |
2.2 Report Description |
2.3 Market Scope & Segmentation |
2.4 Research Methodology |
2.5 Assumptions |
3 Myanmar Television Market Overview |
3.1 Myanmar Country Macro Economic Indicators |
3.2 Myanmar Television Market Revenues & Volume, 2022 & 2032F |
3.3 Myanmar Television Market - Industry Life Cycle |
3.4 Myanmar Television Market - Porter's Five Forces |
3.5 Myanmar Television Market Revenues & Volume Share, By Resolution, 2022 & 2032F |
3.6 Myanmar Television Market Revenues & Volume Share, By Types, 2022 & 2032F |
4 Myanmar Television Market Dynamics |
4.1 Impact Analysis |
4.2 Market Drivers |
4.3 Market Restraints |
5 Myanmar Television Market Trends |
6 Myanmar Television Market, By Types |
6.1 Myanmar Television Market, By Resolution |
6.1.1 Overview and Analysis |
6.1.2 Myanmar Television Market Revenues & Volume, By Resolution, 2022-2032F |
6.1.3 Myanmar Television Market Revenues & Volume, By LCD TVs, 2022-2032F |
6.1.4 Myanmar Television Market Revenues & Volume, By OLED TVs, 2022-2032F |
6.2 Myanmar Television Market, By Types |
6.2.1 Overview and Analysis |
6.2.2 Myanmar Television Market Revenues & Volume, By 2D TVs, 2022-2032F |
6.2.3 Myanmar Television Market Revenues & Volume, By 3D TVs, 2022-2032F |
7 Myanmar Television Market Import-Export Trade Statistics |
7.1 Myanmar Television Market Export to Major Countries |
7.2 Myanmar Television Market Imports from Major Countries |
8 Myanmar Television Market Key Performance Indicators |
9 Myanmar Television Market - Opportunity Assessment |
9.1 Myanmar Television Market Opportunity Assessment, By Resolution, 2022 & 2032F |
9.2 Myanmar Television Market Opportunity Assessment, By Types, 2022 & 2032F |
10 Myanmar Television Market - Competitive Landscape |
10.1 Myanmar Television Market Revenue Share, By Companies, 2025 |
10.2 Myanmar Television Market Competitive Benchmarking, By Operating and Technical Parameters |
11 Company Profiles |
12 Recommendations |
13 Disclaimer |
Global Go To Market Strategy - 2030
Export potential enables firms to identify high-growth global markets with greater confidence by combining advanced trade intelligence with a structured quantitative methodology. The framework analyzes emerging demand trends and country-level import patterns while integrating macroeconomic and trade datasets such as GDP and population forecasts, bilateral import–export flows, tariff structures, elasticity differentials between developed and developing economies, geographic distance, and import demand projections. Using weighted trade values from 2020–2024 as the base period to project country-to-country export potential for 2030, these inputs are operationalized through calculated drivers such as gravity model parameters, tariff impact factors, and projected GDP per-capita growth. Through an analysis of hidden potentials, demand hotspots, and market conditions that are most favorable to success, this method enables firms to focus on target countries, maximize returns, and global expansion with data, backed by accuracy.
By factoring in the projected importer demand gap that is currently unmet and could be potential opportunity, it identifies the potential for the Exporter (Country) among 190 countries, against the general trade analysis, which identifies the biggest importer or exporter.
To discover high-growth global markets and optimize your business strategy:
Click Here
Pricing
- Single User License$ 1,995
- Department License$ 2,400
- Site License$ 3,120
- Global License$ 3,795

Leadership Perspectives from Industry Events
Search
Thought Leadership and Analyst Meet


Our Clients
6WResearch In News
- India Air Conditioner Market Set for Strong Rebound in 2026 After Weather-Led Correction and GST-Driven Recovery: 6Wresearch
- ADAS in India: How Automatic Emergency Braking, Blind Spot Detection & Driver Monitoring are Transforming Road Safety
- Doha a strategic location for EV manufacturing hub: IPA Qatar
- Demand for luxury TVs surging in the GCC, says Samsung
- Empowering Growth: The Thriving Journey of Bangladesh’s Cable Industry
- Demand for luxury TVs surging in the GCC, says Samsung
Latest Reports
- Poland Fire Protection Systems Market (2026-2032)
- Cape Verde Portable Hand-Thrown Extinguisher Market (2026-2032)
- Canada Portable Hand-Thrown Extinguisher Market (2026-2032)
- Cameroon Portable Hand-Thrown Extinguisher Market (2026-2032)
- Burundi Portable Hand-Thrown Extinguisher Market (2026-2032)
- Burkina Faso Portable Hand-Thrown Extinguisher Market (2026-2032)
- Bulgaria Portable Hand-Thrown Extinguisher Market (2026-2032)
- Brunei Portable Hand-Thrown Extinguisher Market (2026-2032)
- Botswana Portable Hand-Thrown Extinguisher Market (2026-2032)
- Bosnia and Herzegovina Portable Hand-Thrown Extinguisher Market (2026-2032)
Industry Events and Analyst Meet

HIMTEX 2026

India Refining Summit 2026

India EV Show 2026

EV tech India Expo 2026

Auto Tech Asia 2026
Whitepaper
- Middle East & Africa Commercial Security Market Click here to view more.
- Middle East & Africa Fire Safety Systems & Equipment Market Click here to view more.
- GCC Drone Market Click here to view more.
- Middle East Lighting Fixture Market Click here to view more.
- GCC Physical & Perimeter Security Market Click here to view more.