Myanmar Wireless Charging Market (2026-2032) Outlook | Revenue, Industry, Size, Forecast, Value, Share, Analysis, Growth, Companies & Trends
Market Forecast By Technology (Resonant, RF, Inductive, Others), By Applications (Healthcare, Automotive, Consumer Electronics, Industrial, Others) And Competitive Landscape
| Product Code: ETC072233 | Publication Date: Jun 2021 | Updated Date: Jun 2026 | Product Type: Report | |
| Publisher: 6Wresearch | Author: Sumit Sagar | No. of Pages: 70 | No. of Figures: 35 | No. of Tables: 5 |
Myanmar Wireless Charging Market Size, Share & Growth Rate
The Myanmar Wireless Charging Market was estimated at USD 477 Million in 2025 and is projected to reach USD 643 Million by 2032, growing at a CAGR of 4.4% from 2026 to 2032. This growth trajectory is fueled by the rapid proliferation of smartphones and other electronic devices, reflecting a societal shift towards more convenient technology. Moreover, increasing consumer awareness of wireless charging's efficiency is boosting demand across urban areas, creating a favorable environment for market expansion.
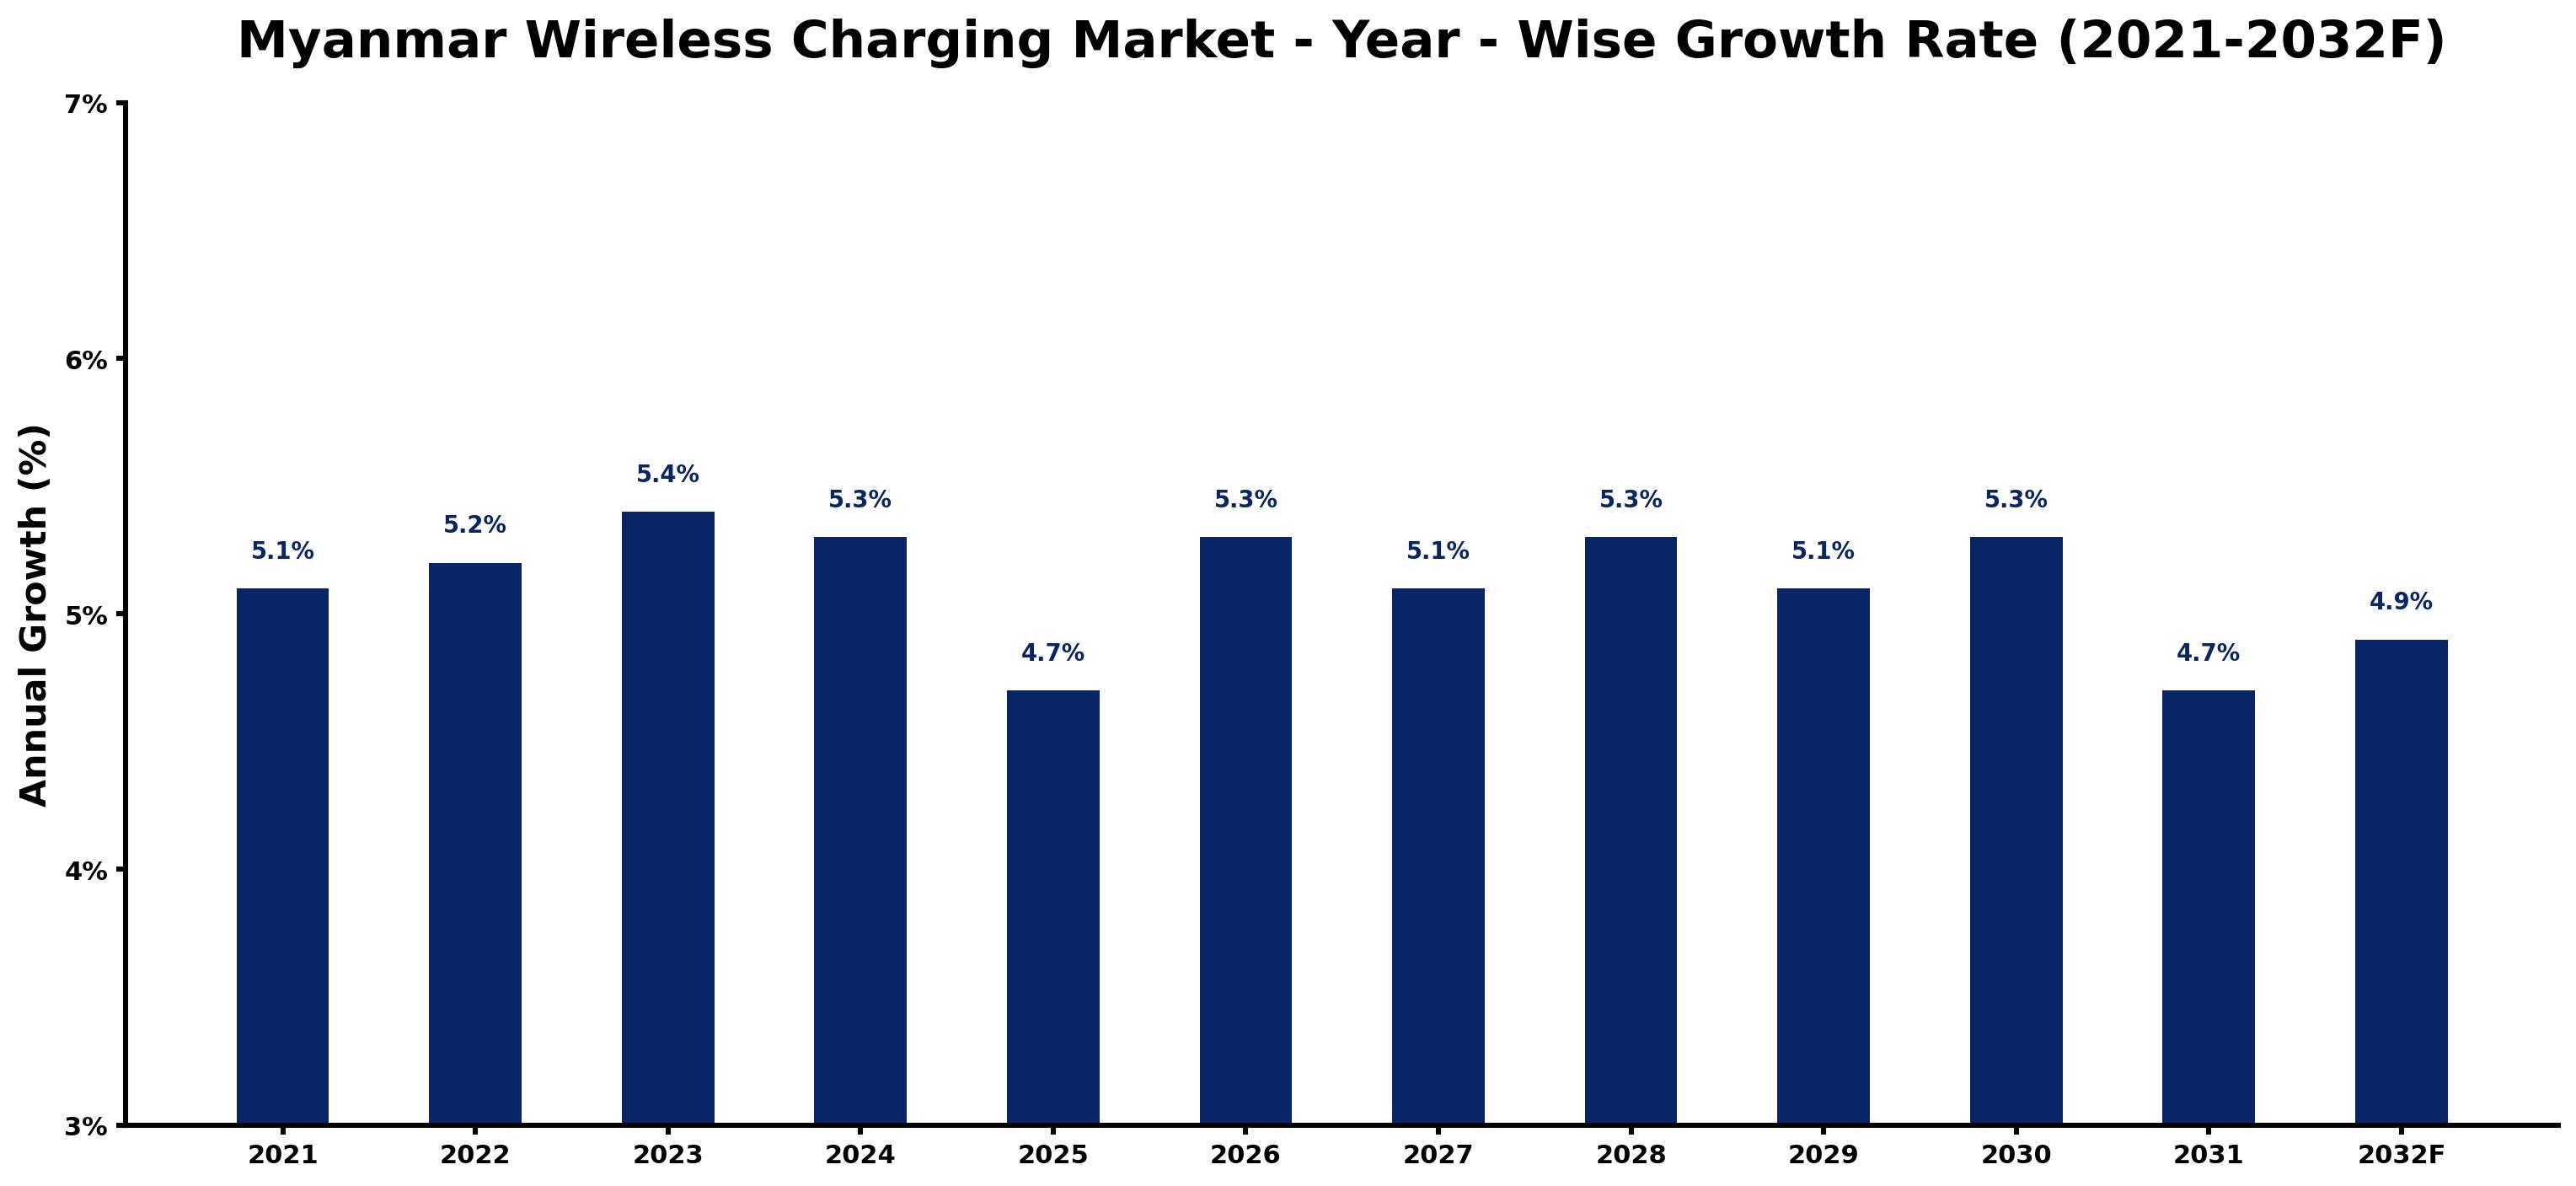
Myanmar Wireless Charging Market Growth Rate Analysis (2021-2032)
The Myanmar wireless charging market continues to evolve, showing a steady growth pattern driven by increasing consumer demand and advancements in technology. In 2021, the market recorded a growth rate of 5.1%, which slightly improved to 5.2% in 2022 and further to 5.4% in 2023. This upward trend can be attributed to the rising adoption of smart devices and a growing awareness of energy-efficient solutions. However, growth is anticipated to stabilize around 5.3% in 2026 before experiencing minor fluctuations, such as a dip to 4.7% in 2031, likely due to market saturation and changing consumer preferences. As digitalization and infrastructure improvements progress, the market is expected to regain momentum by 2032, when growth is projected at 4.9%.
Myanmar Wireless Charging Market Year-wise Growth Rate and Key Drivers
This graph highlights how the Myanmar Wireless Charging Market has steadily grown over the past five years, supported by major growth factors.
The table below presents the year‑wise growth rates along with the key drivers influencing the market
| Year | Growth Rate | Major Drivers |
| 2021 | 5.1% | Rapid growth in telecom and data center sectors |
| 2022 | 5.2% | Expansion of commercial construction activities |
| 2023 | 5.4% | Growing renewable energy integration projects |
| 2024 | 5.3% | Increasing smart city development projects |
| 2025 | 4.7% | Increasing smart city development projects |
| 2026 | 5.3% | Increasing industrial automation investments |
| 2027 | 5.1% | Rising electricity demand across industries |
| 2028 | 5.3% | Growing renewable energy integration projects |
| 2029 | 5.1% | Growing renewable energy integration projects |
| 2030 | 5.3% | Government infrastructure modernization initiatives |
| 2031 | 4.7% | Expansion of commercial construction activities |
| 2032 | 4.9% | Rising electricity demand across industries |
Note - Market size estimations and growth projections presented in this report are based on 6Wresearch’s advanced forecasting approach, validated with industry datasets as of June 2026.
Myanmar Wireless Charging Market Synopsis
A distinctive aspect of the Myanmar Wireless Charging Market is the surge in demand for wireless charging solutions in public venues, such as cafes and transportation hubs. These locations not only attract technology-savvy consumers but also encourage businesses to adopt charging technologies as a competitive advantage.
Moreover, the market is witnessing a notable inclination towards charging pads, stands, and vehicle mounts, tailored to the preferences of a growing smartphone user base. As the technology evolves, product offerings are diversifying, addressing the unique needs of consumers while enhancing user experience.
Myanmar Wireless Charging Market Key Takeaways
- The market is driven by the rising adoption of smartphones and electronic devices among consumers.
- Public spaces increasingly incorporate wireless charging solutions, enhancing customer convenience.
- Technological advancements are leading to faster charging speeds and improved device compatibility.
- Investment opportunities exist in various sectors including automotive and smart home technologies.
- Limited consumer awareness and infrastructure challenges pose hurdles for widespread adoption.
Evaluation of Restraints in Myanmar Wireless Charging Market
The Myanmar Wireless Charging Market faces notable barriers, primarily stemming from limited consumer awareness, particularly in rural areas where access to information is minimal. This lack of familiarity with the technology hampers growth potential. Additionally, the absence of standardized regulations creates uncertainty for manufacturers, making it challenging to ensure compatibility and safety. Furthermore, the higher costs associated with wireless charging solutions compared to traditional wired methods can deter price-sensitive consumers. Addressing these constraints will be essential for the market's maturation and wider acceptance.
Myanmar Wireless Charging Market Trends
Emerging trends indicate a growing consumer preference for integrated wireless charging technologies within everyday environments, including home and office setups. Moreover, there's a rising interest in electric vehicles that utilize wireless charging, paving the way for innovative solutions tailored to this sector. As manufacturers enhance their offerings to ensure faster and more efficient charging, the landscape is set for rapid technological evolution and adoption.
Myanmar Wireless Charging Market Opportunities
Investment opportunities abound in Myanmar's wireless charging sector. The increasing adoption of smart devices and electric vehicles presents unique avenues for market players. Collaborating with local telecommunications companies and retailers can significantly enhance market penetration. Additionally, focusing on building a robust infrastructure to support wireless charging solutions is crucial for long-term growth, offering lucrative prospects for investors and stakeholders.
Government Initiatives in the Myanmar Wireless Charging Market
While specific policies related to the wireless charging market are currently lacking, the government's commitment to enhancing telecommunications infrastructure and promoting digital connectivity indirectly supports the sector. As Myanmar continues to prioritize technological advancement, the wireless charging market stands to benefit from broader initiatives aimed at elevating user experiences and fostering the adoption of mobile technologies across the nation.
Future Insights of the Myanmar Wireless Charging Market
The outlook for the Myanmar Wireless Charging Market is optimistic, with continuous growth anticipated as smartphone penetration deepens. Increasing disposable incomes and a culture shift towards convenience and efficiency will further accelerate demand. As technological advancements yield faster wireless charging solutions, the market will likely see expanded applications across various sectors, including healthcare, automotive, and consumer electronics.
Myanmar Wireless Charging Market Latest Developments (May 2025 - June 2026)
Recent developments within the Myanmar Wireless Charging Market reflect a growing trend towards integrating charging technologies in public and commercial spaces. Various sectors are beginning to experiment with innovative implementations of wireless charging, demonstrating an increased acceptance among consumers. This evolving landscape suggests a vibrant future for the industry, as stakeholders adapt to emerging consumer needs and preferences.
Myanmar Wireless Charging Market - Key Attractiveness of the Report
- 10 Years of Market Numbers
- Historical Data Starting from 2022 to 2025
- Base Year: 2025
- Forecast Data until 2032
- Key Performance Indicators Impacting the Market
- Major Upcoming Developments and Projects
Key Highlights of the Report:
- Myanmar Wireless Charging Market Outlook
- Market Size of Myanmar Wireless Charging Market, 2025
- Forecast of Myanmar Wireless Charging Market, 2032
- Historical Data and Forecast of Myanmar Wireless Charging Revenues & Volume for the Period 2022-2032F
- Myanmar Wireless Charging Market Trend Evolution
- Myanmar Wireless Charging Market Drivers and Challenges
- Myanmar Wireless Charging Price Trends
- Myanmar Wireless Charging Porter's Five Forces
- Myanmar Wireless Charging Industry Life Cycle
- Historical Data and Forecast of Myanmar Wireless Charging Market Revenues & Volume By Technology for the Period 2022-2032F
- Historical Data and Forecast of Myanmar Wireless Charging Market Revenues & Volume By Resonant for the Period 2022-2032F
- Historical Data and Forecast of Myanmar Wireless Charging Market Revenues & Volume By RF for the Period 2022-2032F
- Historical Data and Forecast of Myanmar Wireless Charging Market Revenues & Volume By Inductive for the Period 2022-2032F
- Historical Data and Forecast of Myanmar Wireless Charging Market Revenues & Volume By Others for the Period 2022-2032F
- Historical Data and Forecast of Myanmar Wireless Charging Market Revenues & Volume By Applications for the Period 2022-2032F
- Historical Data and Forecast of Myanmar Wireless Charging Market Revenues & Volume By Healthcare for the Period 2022-2032F
- Historical Data and Forecast of Myanmar Wireless Charging Market Revenues & Volume By Automotive for the Period 2022-2032F
- Historical Data and Forecast of Myanmar Wireless Charging Market Revenues & Volume By Consumer Electronics for the Period 2022-2032F
- Historical Data and Forecast of Myanmar Wireless Charging Market Revenues & Volume By Industrial for the Period 2022-2032F
- Historical Data and Forecast of Myanmar Wireless Charging Market Revenues & Volume By Others for the Period 2022-2032F
- Myanmar Wireless Charging Import Export Trade Statistics
- Market Opportunity Assessment By Technology
- Market Opportunity Assessment By Applications
- Myanmar Wireless Charging Top Companies Market Share
- Myanmar Wireless Charging Competitive Benchmarking By Technical and Operational Parameters
- Myanmar Wireless Charging Company Profiles
- Myanmar Wireless Charging Key Strategic Recommendations
Myanmar Wireless Charging Market - Frequently Asked Questions
The increasing penetration of smartphones and consumer electronics is the primary driver. As more devices become compatible with wireless charging, consumers are seeking convenient solutions that eliminate the hassle of tangled cords.
The market was estimated at USD 477 Million in 2025 and is projected to reach USD 643 Million by 2032, growing at a CAGR of 4.4% from 2026 to 2032.
Public venues such as cafes and airports are increasingly incorporating wireless charging solutions to enhance customer convenience, which has spurred growth in this sector.
Major challenges include limited consumer awareness, especially in rural areas, along with a lack of standardized regulations that inhibit growth and widespread adoption.
Investors can explore opportunities in sectors like electric vehicles and smart home technologies, as well as collaborations with local businesses to enhance market reach.
6Wresearch actively monitors the Myanmar Wireless Charging Market and publishes its comprehensive annual report, highlighting emerging trends, growth drivers, revenue analysis, and forecast outlook. Our insights help businesses to make data-backed strategic decisions with ongoing market dynamics. Our analysts track relevent industries related to the Myanmar Wireless Charging Market, allowing our clients with actionable intelligence and reliable forecasts tailored to emerging regional needs.
Yes, we provide customisation as per your requirements. To learn more, feel free to contact us on sales@6wresearch.com
1 Executive Summary |
2 Introduction |
2.1 Key Highlights of the Report |
2.2 Report Description |
2.3 Market Scope & Segmentation |
2.4 Research Methodology |
2.5 Assumptions |
3 Myanmar Wireless Charging Market Overview |
3.1 Myanmar Country Macro Economic Indicators |
3.2 Myanmar Wireless Charging Market Revenues & Volume, 2022 & 2032F |
3.3 Myanmar Wireless Charging Market - Industry Life Cycle |
3.4 Myanmar Wireless Charging Market - Porter's Five Forces |
3.5 Myanmar Wireless Charging Market Revenues & Volume Share, By Technology, 2022 & 2032F |
3.6 Myanmar Wireless Charging Market Revenues & Volume Share, By Applications, 2022 & 2032F |
4 Myanmar Wireless Charging Market Dynamics |
4.1 Impact Analysis |
4.2 Market Drivers |
4.2.1 Increasing demand for reliable and continuous power supply in Nigeria |
4.2.2 Government initiatives and policies promoting the use of gas engines for power generation |
4.2.3 Growth in industrial sectors requiring higher power capacity |
4.3 Market Restraints |
4.3.1 High initial investment cost for 800kW and above gas engines |
4.3.2 Limited availability of natural gas infrastructure in certain regions of Nigeria |
4.3.3 Competition from alternative power generation technologies such as solar and wind |
5 Myanmar Wireless Charging Market Trends |
6 Myanmar Wireless Charging Market, By Types |
6.1 Myanmar Wireless Charging Market, By Technology |
6.1.1 Overview and Analysis |
6.1.2 Myanmar Wireless Charging Market Revenues & Volume, By Technology, 2022-2032F |
6.1.3 Myanmar Wireless Charging Market Revenues & Volume, By Resonant, 2022-2032F |
6.1.4 Myanmar Wireless Charging Market Revenues & Volume, By RF, 2022-2032F |
6.1.5 Myanmar Wireless Charging Market Revenues & Volume, By Inductive, 2022-2032F |
6.1.6 Myanmar Wireless Charging Market Revenues & Volume, By Others, 2022-2032F |
6.2 Myanmar Wireless Charging Market, By Applications |
6.2.1 Overview and Analysis |
6.2.2 Myanmar Wireless Charging Market Revenues & Volume, By Healthcare, 2022-2032F |
6.2.3 Myanmar Wireless Charging Market Revenues & Volume, By Automotive, 2022-2032F |
6.2.4 Myanmar Wireless Charging Market Revenues & Volume, By Consumer Electronics, 2022-2032F |
6.2.5 Myanmar Wireless Charging Market Revenues & Volume, By Industrial, 2022-2032F |
6.2.6 Myanmar Wireless Charging Market Revenues & Volume, By Others, 2022-2032F |
7 Myanmar Wireless Charging Market Import-Export Trade Statistics |
7.1 Myanmar Wireless Charging Market Export to Major Countries |
7.2 Myanmar Wireless Charging Market Imports from Major Countries |
8 Myanmar Wireless Charging Market Key Performance Indicators |
8.1 Average capacity utilization rate of 800kW and above gas engines in Nigeria |
8.2 Number of new gas engine installations in key industrial sectors |
8.3 Growth rate of natural gas infrastructure development in Nigeria |
8.4 Frequency of power outages and the impact on adoption of gas engines |
8.5 Adoption rate of government policies supporting gas engine usage in power generation |
9 Myanmar Wireless Charging Market - Opportunity Assessment |
9.1 Myanmar Wireless Charging Market Opportunity Assessment, By Technology, 2022 & 2032F |
9.2 Myanmar Wireless Charging Market Opportunity Assessment, By Applications, 2022 & 2032F |
10 Myanmar Wireless Charging Market - Competitive Landscape |
10.1 Myanmar Wireless Charging Market Revenue Share, By Companies, 2025 |
10.2 Myanmar Wireless Charging Market Competitive Benchmarking, By Operating and Technical Parameters |
11 Company Profiles |
12 Recommendations |
13 Disclaimer |
Global Go To Market Strategy - 2030
Export potential enables firms to identify high-growth global markets with greater confidence by combining advanced trade intelligence with a structured quantitative methodology. The framework analyzes emerging demand trends and country-level import patterns while integrating macroeconomic and trade datasets such as GDP and population forecasts, bilateral import–export flows, tariff structures, elasticity differentials between developed and developing economies, geographic distance, and import demand projections. Using weighted trade values from 2020–2024 as the base period to project country-to-country export potential for 2030, these inputs are operationalized through calculated drivers such as gravity model parameters, tariff impact factors, and projected GDP per-capita growth. Through an analysis of hidden potentials, demand hotspots, and market conditions that are most favorable to success, this method enables firms to focus on target countries, maximize returns, and global expansion with data, backed by accuracy.
By factoring in the projected importer demand gap that is currently unmet and could be potential opportunity, it identifies the potential for the Exporter (Country) among 190 countries, against the general trade analysis, which identifies the biggest importer or exporter.
To discover high-growth global markets and optimize your business strategy:
Click Here
Pricing
- Single User License$ 1,995
- Department License$ 2,400
- Site License$ 3,120
- Global License$ 3,795

Leadership Perspectives from Industry Events
Search
Thought Leadership and Analyst Meet


Our Clients
6WResearch In News
- India Air Conditioner Market Set for Strong Rebound in 2026 After Weather-Led Correction and GST-Driven Recovery: 6Wresearch
- ADAS in India: How Automatic Emergency Braking, Blind Spot Detection & Driver Monitoring are Transforming Road Safety
- Doha a strategic location for EV manufacturing hub: IPA Qatar
- Demand for luxury TVs surging in the GCC, says Samsung
- Empowering Growth: The Thriving Journey of Bangladesh’s Cable Industry
- Demand for luxury TVs surging in the GCC, says Samsung
Latest Reports
- Poland Fire Protection Systems Market (2026-2032)
- Cape Verde Portable Hand-Thrown Extinguisher Market (2026-2032)
- Canada Portable Hand-Thrown Extinguisher Market (2026-2032)
- Cameroon Portable Hand-Thrown Extinguisher Market (2026-2032)
- Burundi Portable Hand-Thrown Extinguisher Market (2026-2032)
- Burkina Faso Portable Hand-Thrown Extinguisher Market (2026-2032)
- Bulgaria Portable Hand-Thrown Extinguisher Market (2026-2032)
- Brunei Portable Hand-Thrown Extinguisher Market (2026-2032)
- Botswana Portable Hand-Thrown Extinguisher Market (2026-2032)
- Bosnia and Herzegovina Portable Hand-Thrown Extinguisher Market (2026-2032)
Industry Events and Analyst Meet

HIMTEX 2026

India Refining Summit 2026

India EV Show 2026

EV tech India Expo 2026

Auto Tech Asia 2026
Whitepaper
- Middle East & Africa Commercial Security Market Click here to view more.
- Middle East & Africa Fire Safety Systems & Equipment Market Click here to view more.
- GCC Drone Market Click here to view more.
- Middle East Lighting Fixture Market Click here to view more.
- GCC Physical & Perimeter Security Market Click here to view more.